Sample Category Title
Fed Boosts Equities – Mostly
US Federal Reserve Bank Chairman Jerome Powell yesterday told the US Senate's Banking Committee that the Fed has definitely changed its monetary policy: it will now be “data dependent” and “patient”. Sounding rather like his predecessor Janet Yellen, Powell emphasized that the Fed is unlikely to hike raise interest rate anytime soon and is ready to “adjust” details of its balance sheet run-off. He maintained optimism on the economy, though he acknowledged slowing and warned of risks such as volatile financial markets and uncertainties generated by the trade war.
This turnaround from the Fed has boosted equities over the last few weeks. Market participants moved back to thinking “bad news is good news”, i.e. bad news on the economy means the Fed will keep flooding market with liquidity). However, investors are not 100% confident the storm is over. Equity markets need their “Fed fix” to keep grinding higher and this is no more guaranteed. On Wednesday, equities are down across the board
Oil and Trump don't mix
Rising 30% since lows of December, crude oil has gained following the last OPEC meeting of last year. Production was curbed 1.53 million barrels per day in January, as Saudi Arabia cut supply, despite the USA production peak of 12 million bpd. We remain positive on oil prices under current settings. Currently trading at 65.66, Brent Crude is heading along 66 short-term.
US inventories remain at 454.5 million barrels, a level not seen since November 2017, while American Petroleum Institute estimates suggest a drop in US inventories of 4.2 million barrels in the week to 22 February. The US Energy Information Administration projects only 2.94 million. Consolidation of gains will largely depend on global economic health and stable geopolitics. The OPEC + group plans to maintain cuts through the first half of 2019, with perhaps some easing in H2. The threat of a US congressional NOPEC bill – that would allow OPEC to be sued under antitrust law – could disrupt. Additionally, the discord between India (world's 3rd largest oil buyer) and Pakistan might hit demand if it escalates.
CHFJPY Hovers In Consolidation Area, Neutral In Short-Term
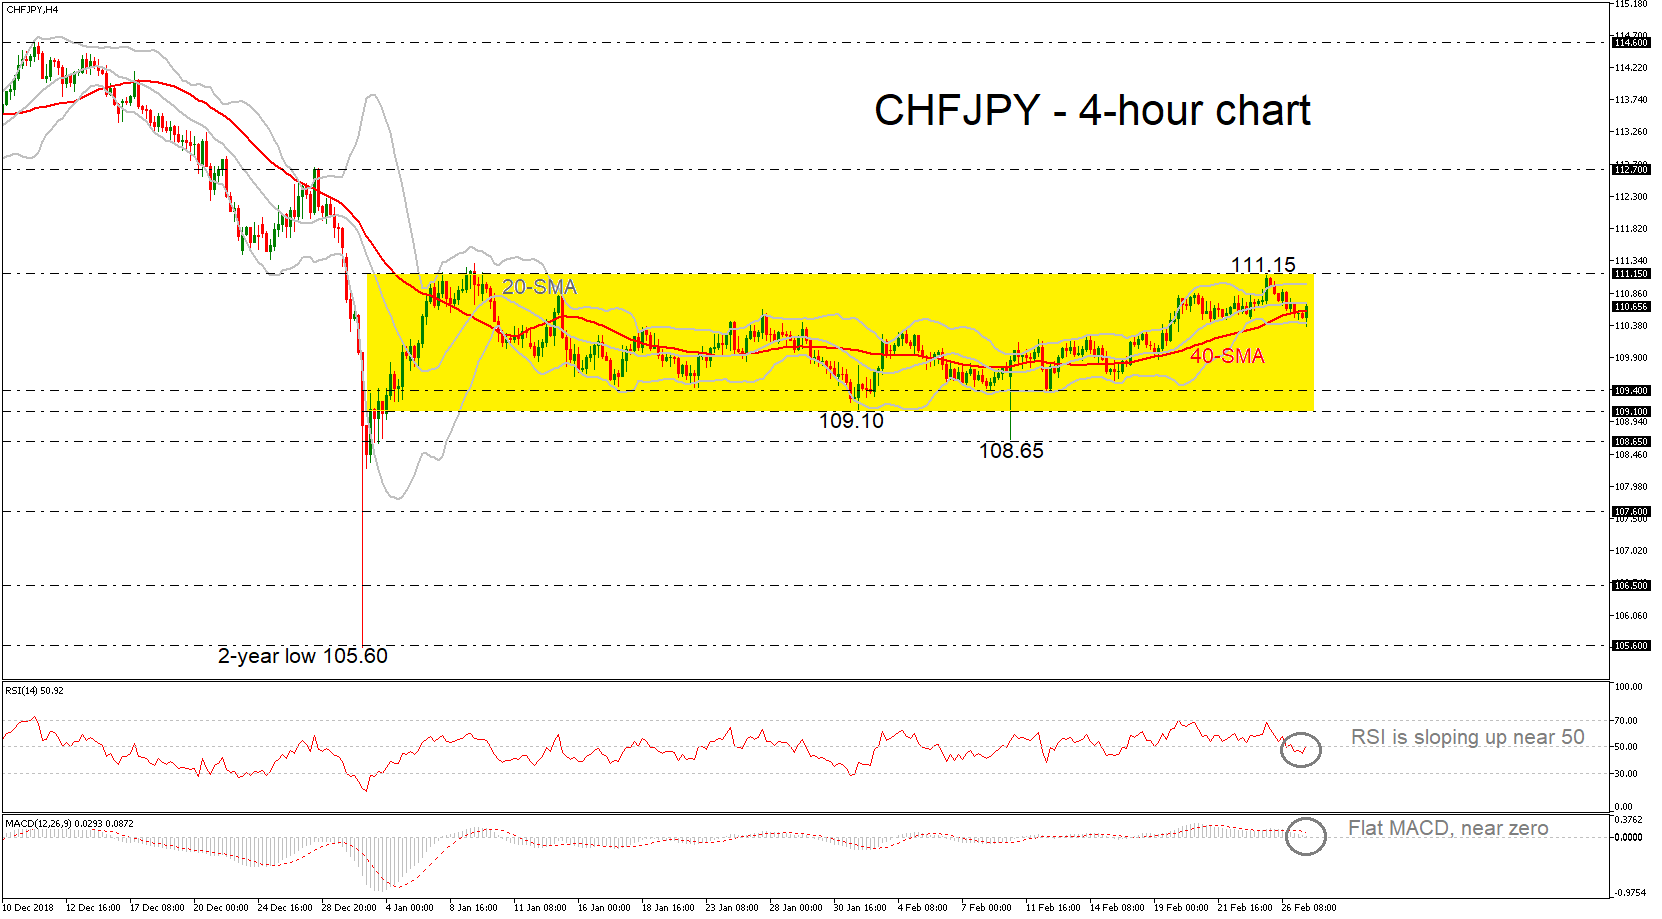
CHFJPY has been trading within a consolidation area over the last couple of months with upper boundary the 111.15 resistance level and lower boundary the 108.65 support. In the very short-term, the price is currently hovering within a narrow Bollinger band, indicating very weak momentum and a possible sharper movement in the future.
From the technical point of view, the RSI is pointing up near the neutral threshold of 50. Also, the MACD is flattening marginally near the zero line, indicating neutral bias in the 4-hour chart.
If the price breaks the lower Bollinger band to the downside the next support level to have in mind is the 109.40 barrier and then the 109.10 hurdle. More losses could drive the market towards the lower boundary of the trading range at 108.65 and in case of a successful fall below it could open the door for a new bearish rally until 107.60.
However, if bullish forces appear stronger, immediate resistance could be faced near the upper Bollinger band and the 111.15 strong resistance level. A jump above these lines would change the medium-term negative outlook to positive, sending prices towards 112.70, identified by the peaks on December 28.
Summing up, CHFJPY retains neutral bias and only a close above 111.15 could switch the current view to bullish. On the other hand, a close below 108.65 could endorse the medium-term structure.
USDJPY Bearish Below 110.40
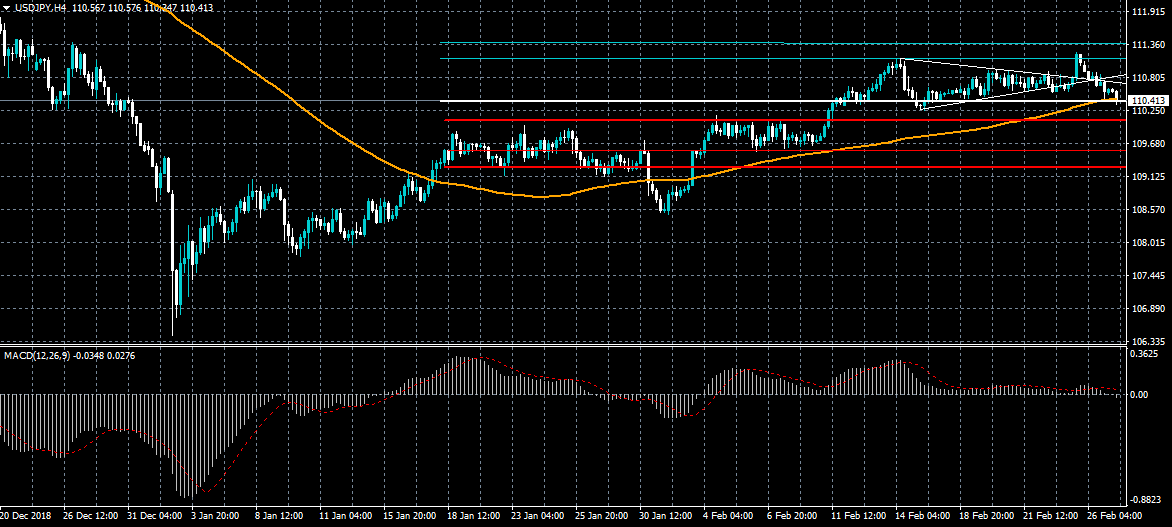
The US dollar is starting to come under technical selling against the Japanese yen currency after buyers failed to hold the price above the 111.00 resistance level. If sellers move price below the pivotal 110.40 level, the USDJPY pair may weaken towards the 109.60 support level. The MACD indicator on the four-hour time frame is also signaling further losses ahead for the USDJPY pair.
The USDJPY pair is bearish while trading below the 110.40 level, key technical support is found at the 110.10 and 109.60 levels.
If the USDJPY pair trades above the 110.40 level, buyers may test towards the 110.80 and 111.12 resistance levels.
EURUSD 1.1437 Strong Resistance
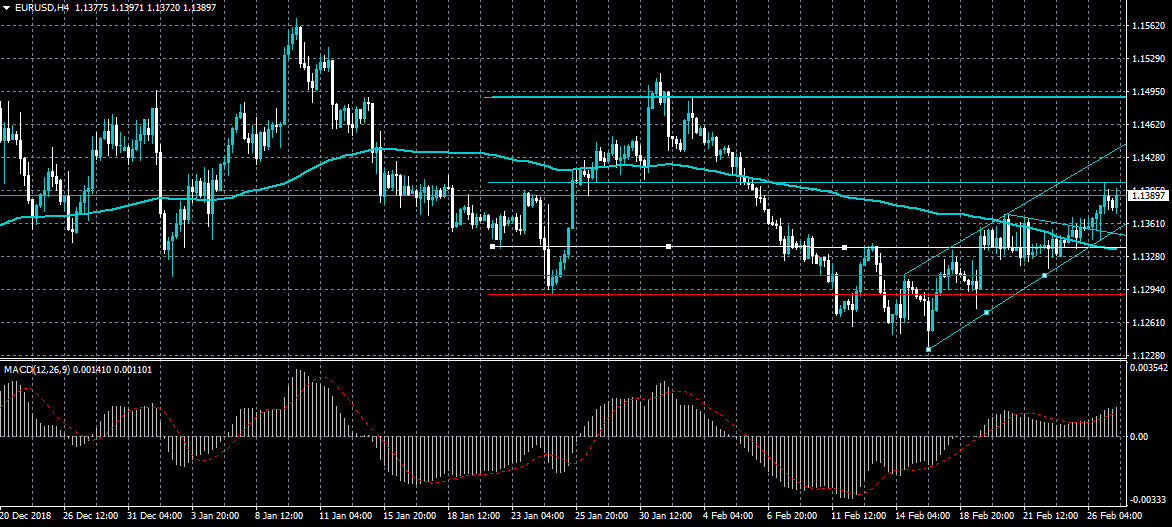
The euro has continued to show bullish price-action against the US dollar during the European trading session, with the pair pressing against the 1.1400 resistance level. The 1.1437 resistance level offers strong technical resistance if the 1.1400 level if eventually breached. Only a sustained break below the 1.1375 support level can negate the bullish intraday outlook surrounding the EURUSD pair.
The EURUSD pair is strongly bullish while trading above the 1.1375 level, key resistance is found at the 1.1400 and 1.1437 levels.
If the EURUSD pair trades below the 1.1375 level, key support is found at the 1.1360 and 1.1337 levels.
The US Dollar Index Has Updated Local Lows
The US dollar weakened against a basket of major currencies during yesterday's trading session. Dovish comments by Fed Chairman, Jerome Powell, put pressure on the US currency. The official said yesterday that the country's economy is in good condition. At the same time, the Central Bank will not rush to tighten monetary policy in the current year. The regulator will carefully evaluate future economic releases. The dollar index (#DX) updated local lows and closed the trading session in the red (-0.42%).
The political uncertainty concerning Brexit remains. UK Prime Minister, Theresa May, promised the lawmakers that if they did not approve the revised Brexit agreement by March 12, a vote on the no-deal Brexit would be taken. If parliamentarians reject this option, a vote on the Brexit delay will be held on March 14. These statements have supported the pound.
The "black gold" prices have been recovering after a sharp collapse at the beginning of this week. At the moment, futures for the WTI crude oil are testing the mark of $55.85 per barrel. At 17:30 (GMT+2:00), a report on crude oil inventories will be published in the US.
Market Indicators
- Yesterday, there was a variety of trends in the US stock market: #SPY (-0.07%), #DIA (-0.13%), #QQQ (+0.10%).
- The 10-year US government bonds yield is at the level of 2.63-2.64%.
Today, we recommend paying attention to the following statistics:
- Core consumer price index in Canada at 15:30 (GMT+2:00);
- Pending home sales index in the US at 17:00 (GMT+2:00).
USD/JPY Wave 4 Pullback Reaches 110 Support Zone
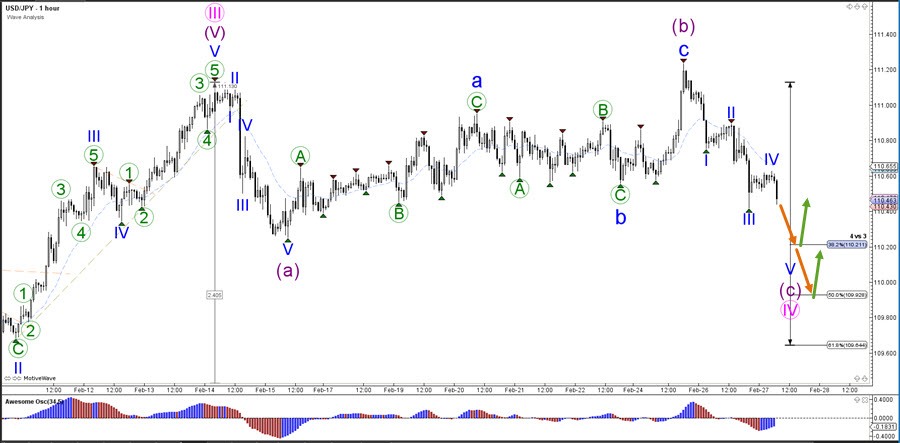
A bullish bounce in the support zone could confirm the continuation of the uptrend further north. Price could aim for the top of the uptrend channel and even move up towards 112.50. A bearish breakout, however, below the 61.8% Fibonacci retracement level could indicate more downside and an invalidation of the bullish wave pattern.
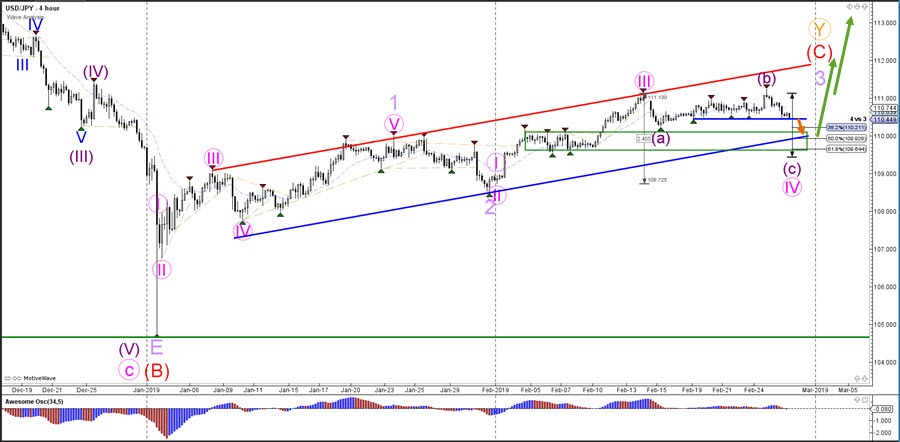
The USD/JPY seems to be completing a 5th wave (blue) at the moment of a larger bearish ABC (purple) zigzag pattern. A bullish bounce and candlestick patterns at the Fibonacci retracement levels of wave 4 vs 3 could indicate the end of the wave 4 (pink)
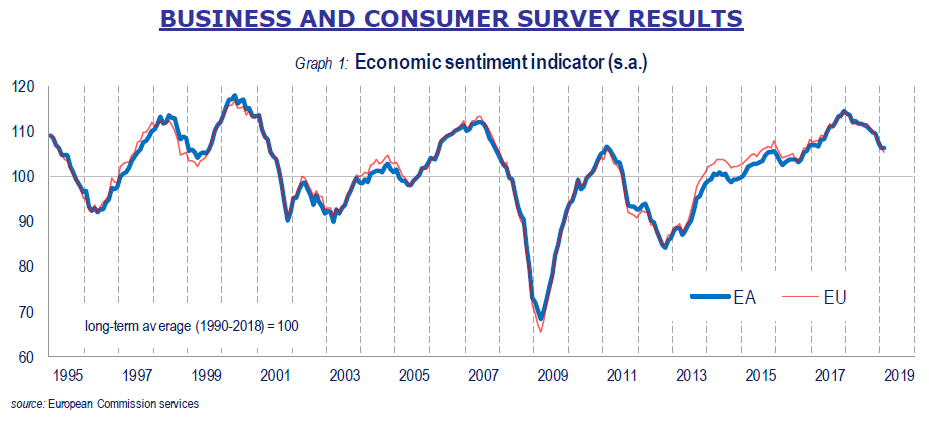
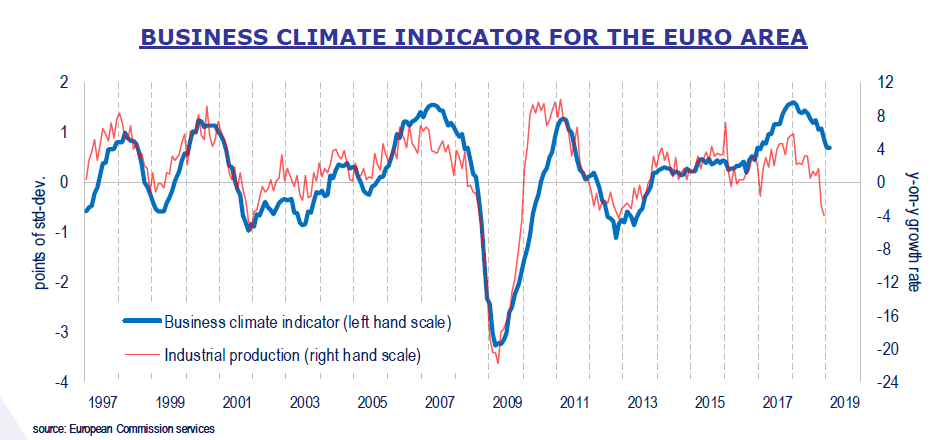
Eurozone economic sentiment dropped to -0.2, business climate unchanged at 0.69
Eurozone Economic Sentiment Indicator dropped -0.2 to 106.1 in February, slightly above expectation of 106.0. The broadly unchanged reading resulted from "weaker industry and construction confidence in combination with more upbeat signals from the services sector, as well as, to a lesser extent, retail trade and consumers". Meanwhile the ESI dropped in Franc (-0.9%) and Italy (-1.6), practically flat in Germany (-0.1) and Spain (0.0), but improved in the Netherlands (+3.0).
Eurozone Business Climate Indicator is flat at 0.69 in February, slightly above expectation of 0.67. Eurostats noted "Managers' production expectations, as well as their assessments of the stocks of finished products, overall- and export order books clouded over. Meanwhile, the appraisals of past production rebounded from last month's sharp drop."
AUD/USD Outlook: Bulls Stalled Again Under Strong 0.72 Resistance After Downbeat Australian Data
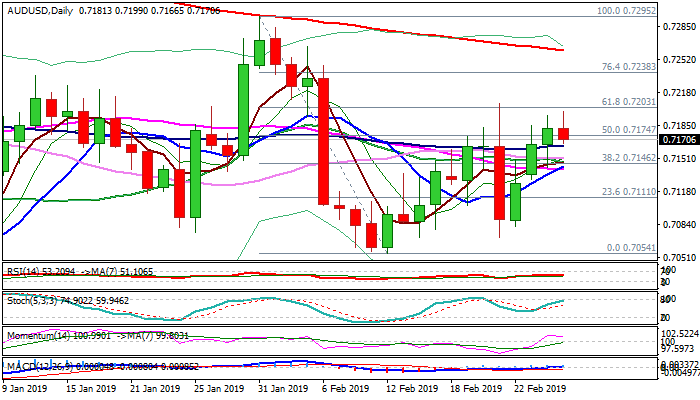
The Australian dollar holds in red on Wednesday as three-day rally faced again strong headwinds from pivotal 0.72 resistance zone (Fibo 61.8% of 0.7295/0.7054) where recovery already stalled last week.
Downbeat Australian construction data (Q4 -3.1% vs 0.6% f/c) add to negative near-term tone.
Bulls are losing momentum but hold for now above broken 100SMA (0.7163) that keeps positive near-term bias, also boosted by optimism on US/China trade talks.
Extended dips need to hold above a cluster of daily MA (0.7150/40 zone) to keep focus at the upside, as overall picture is positive and favors further advance.
Eventual break above 0.72 zone would expose Fibo barrier at 0.7238 (76.4% of 0.7295/0.7054) and more significant 200SMA (0.7260) and 2019 high (0.7295).
Only return and close below 0.7140 would sideline near-term bulls and risk further easing.
Res: 0.7203, 0.7238, 0.7260, 0.7295
Sup: 0.7163, 0.7142, 0.7111, 0.7082
EUR/USD Reaches 1.1400 Level
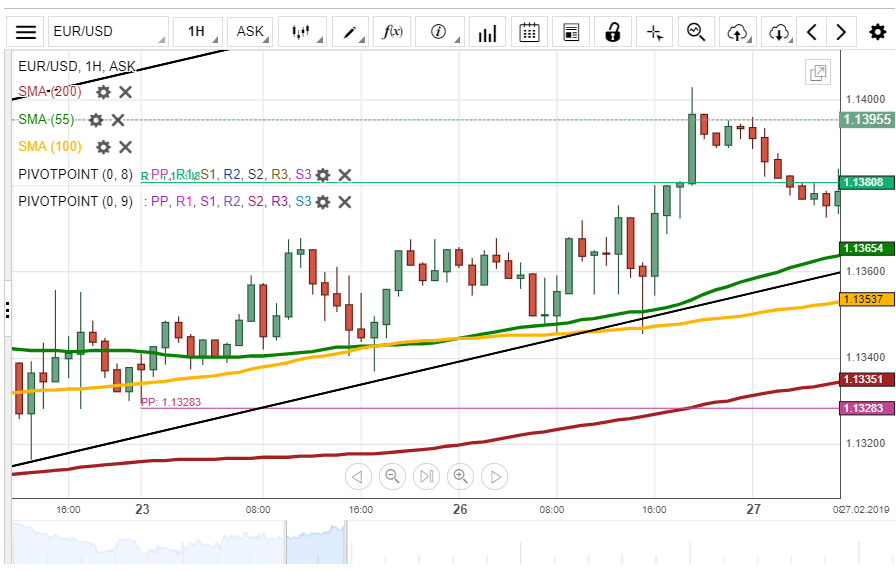
The EUR/USD reached the targeted 1.1380 soon after yesterday's publications. Moreover, three hours after reaching the weekly R1 at 1.1380 the pair continued to surge and reached the resistance levels of the daily chart at the 1.1400 level.
The 1.1400 level managed to hold the pair back from continuing to surge and forced it into a retracement downwards. Although, on Wednesday morning the pair was once more making an attempt to pass the level.
In general, watch the 1.1400 closely, if it gets clearly passed, the rate should head for the weekly R2 at the 1.1424 level. On the other hand, another retreat downwards wot the 1.1380 level might occur, if the 1.1400 holds.
GBP/USD Jumps On Brexit Announcement
As it was expected, the GBP/USD surged during the last 24-hours. However, the surge was a lot bigger than expected. The reason was another fundamental Brexit announcement.
Namely, Theresa May moved a motion in UK's parliament to delay the Brexit in an effort to delay a no-deal scenario.
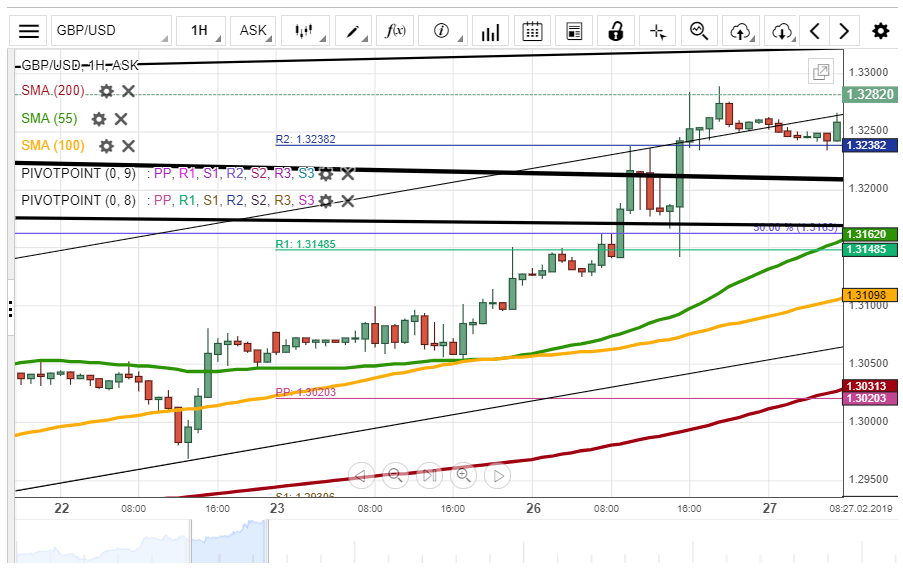
By the middle of Wednesday's trading from a technical perspective the pair had consolidated its previous gains and resumed a surge after finding support in the weekly R2 at the 1.3238 level. This surge could reach as high as 1.3325, where another trend line is located at.
Although, take into account that trend lines don't hold for long in the current environment