

Sample Category Title
The Analytical Overview Of The Main Currency Pairs
The EUR/USD currency pair
Technical indicators of the currency pair:
Prev Open: 1.13322
Open: 1.13583
% chg. over the last day: +0.19
Day's range: 1.13478 – 1.13674
52 wk range: 1.1214 – 1.2557
The demand on the risky assets grew due to hopes that the US/China trading conflict will end soon. Donald Trump officially postponed the increase of fees on the Chinese wares and plans to meet with Xi Jingping to sign the trade aggreement.
The technical picture at EUR/USD remains ambiguous. EUR keeps trading in a long flat. The local support and resistance levels are 1.13400 and 1.13650. The investors are waiting for the statements by the Head of the Federal Reserve Powell about the state of the economy and the US monetary policy. You should open positions from the key levels.
The Economic News Feed for 26.02.2019:
Real Estate Sales Report (US) – 15:30 (GMT+2:00);
Consumer Trust Index by CB (US) – 17:00 (GMT+2:00);
Statements by the Head of Federal Reserve (EU) – 17:00 (GMT+2:00);
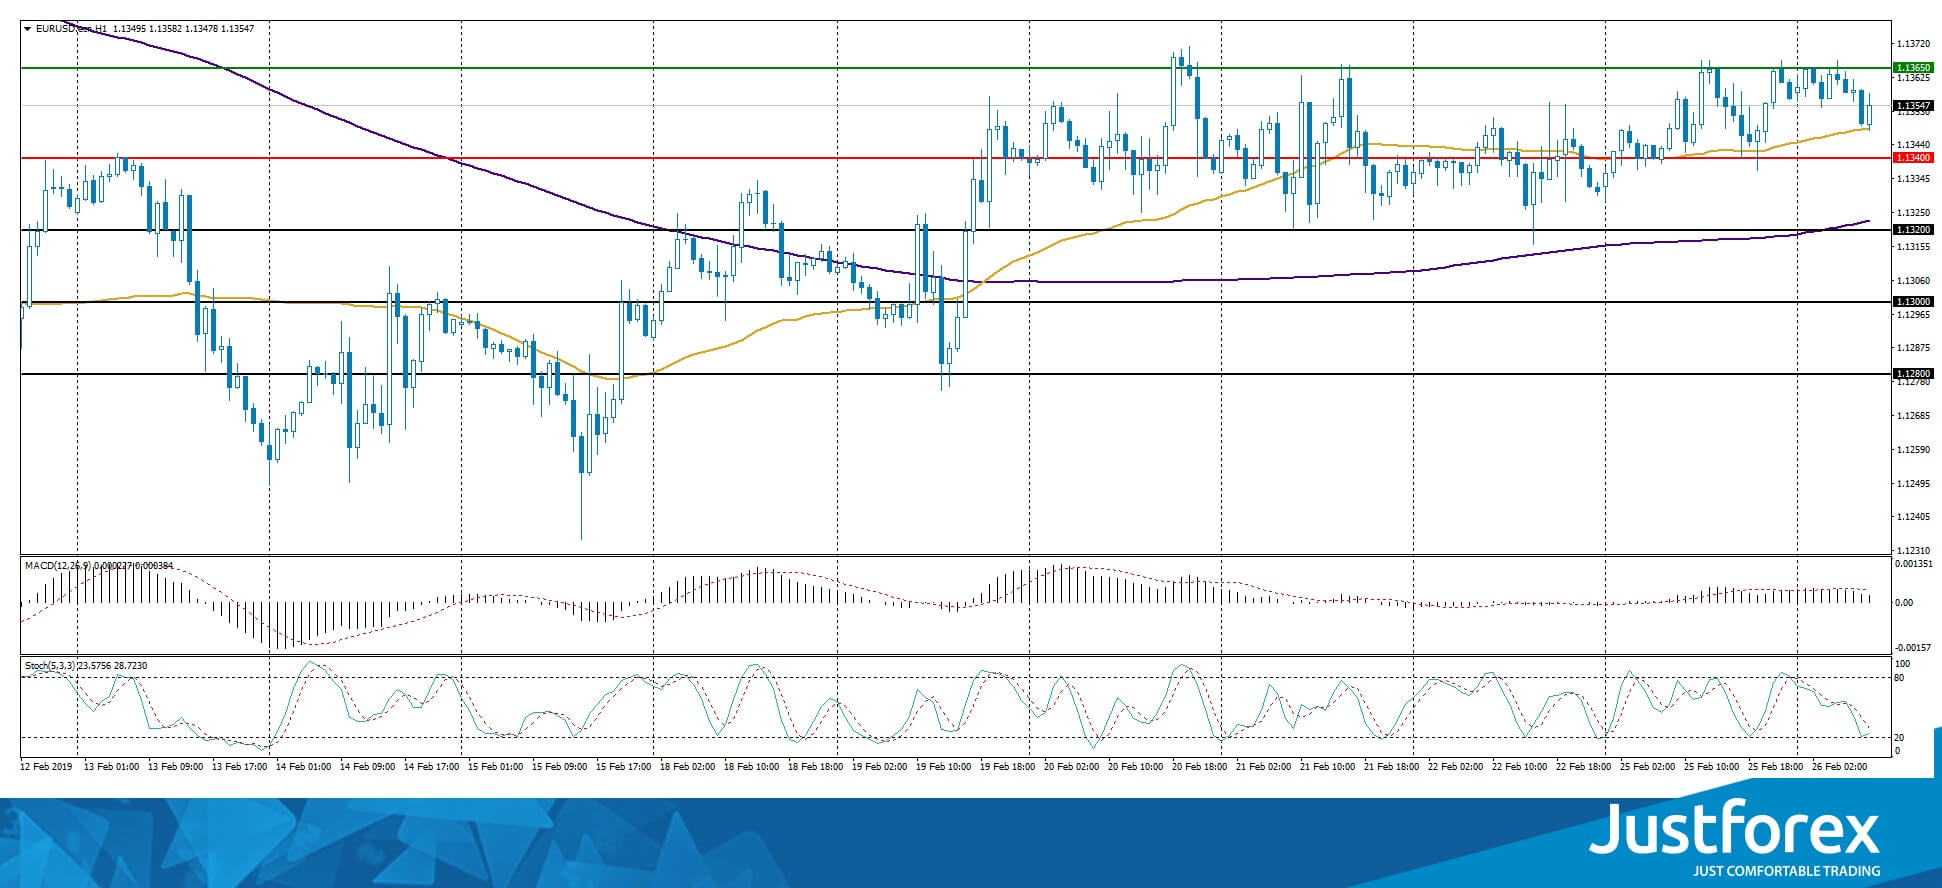
The indicators do not provide precise signals, the price is testing 50 MA which acts as a dynamic support.
The MACD histogram is in the positive zone but below the signal line, which gives a weak signal to buy EUR/USD.
The Stochastic Oscillator is in the neutral zone, the %K line is crossing the %D line. There are no signals at the moment.
Trading recommendations
Support levels: 1.13400, 1.13200, 1.13000
Resistance levels: 1.13650, 1.14000
If the price fixes above 1.13650, the currency pair will grow toward 1.14000-1.14200.
Alternatively, the quotes can fall toward 1.13200-1.13000.
The GBP/USD currency pair
Technical indicators of the currency pair:
Prev Open: 1.30704
Open: 1.31083
% chg. over the last day: +0.48
Day's range: 1.31083 – 1.31613
52 wk range: 1.2438 – 1.4378
GBP/USD finally started to grow after a long consolidation. During the last two days of trading, the pound strengthened against the USD by 80 points and almost reached the annual maximums. The demand on GBP is connected to the rumours about postponing Brexit, which is planned for March, 29. Right now GBP/USD is testing the local resistance at 1.31500 with 1.31000 acting as a mirror support. The trading instrument has prospects for further growth.
The Economic News Feed for 26.02.2019:
Hearings at Bank of England regarding inflation (GB) – 12:00 (GMT+2:00);
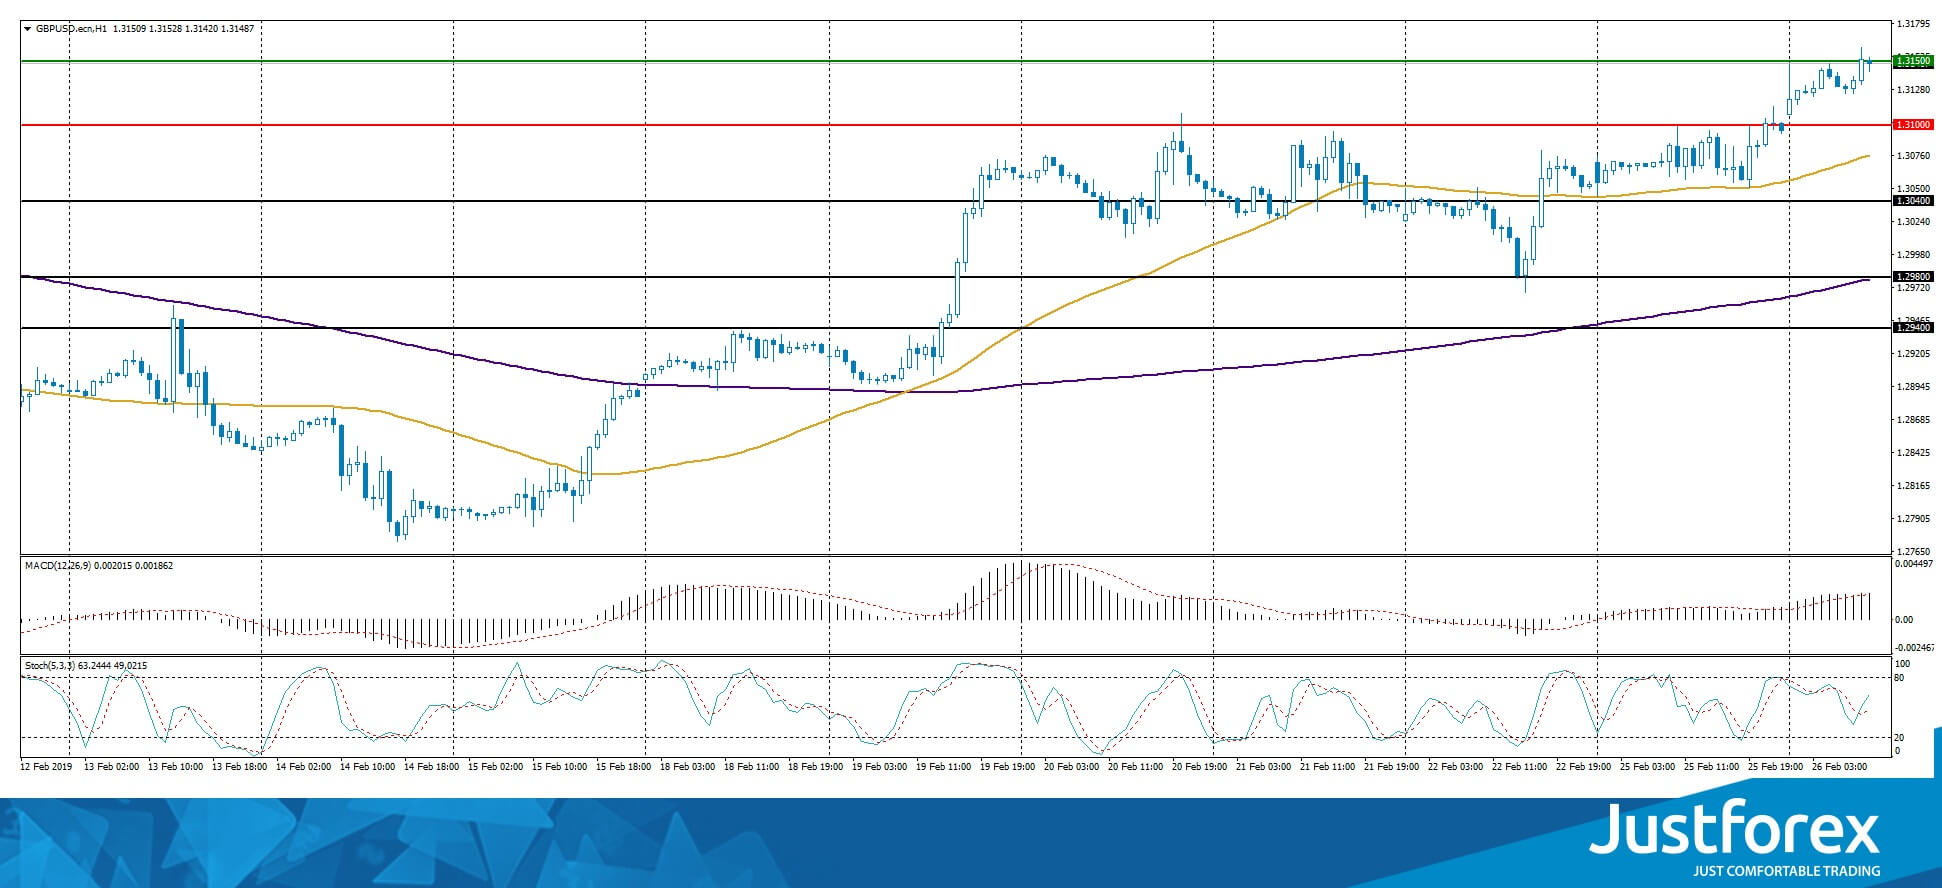
The indicators point to the power of the buyers, the price fixed above 50 MA and 200 MA.
The MACD histogram is in the positive zone and above the signal line, which gives a strong signal to buy EUR/USD.
The Stochastic Oscillator is in the neutral zone, the %K line is above the %D line which also points to the bullish mood.
Trading recommendations
Support levels: 1.31000, 1.30400, 1.29800
Resistance levels: 1.31500, 1.32000
Should the price fix above 1.31500, expect the quotes to grow toward the round 1.32000.
Alternatively, the quotes can fall toward 1.30700-1.30400.
The USD/CAD currency pair
Technical indicators of the currency pair:
Prev Open: 1.31342
Open: 1.31863
% chg. over the last day: +0.41
Day's range: 1.31771 – 1.32170
52 wk range: 1.2248 – 1.3664
USD/CAD retreated from the monthly minimums. The pressure on CAD is caused by the sudden drop in the oil quotes calua. Yesterday the WTI futures lost around 3% of their price. Right now the trading instrument is testing the local resistance at 1.32150 with 1.31850 acting as a near support. You should open positions from these levels but keep an eye on the reports from US, as well as the statements by the Head of the Federal Reserve.
The Economic News Feed for 26.02.2019 is calm.
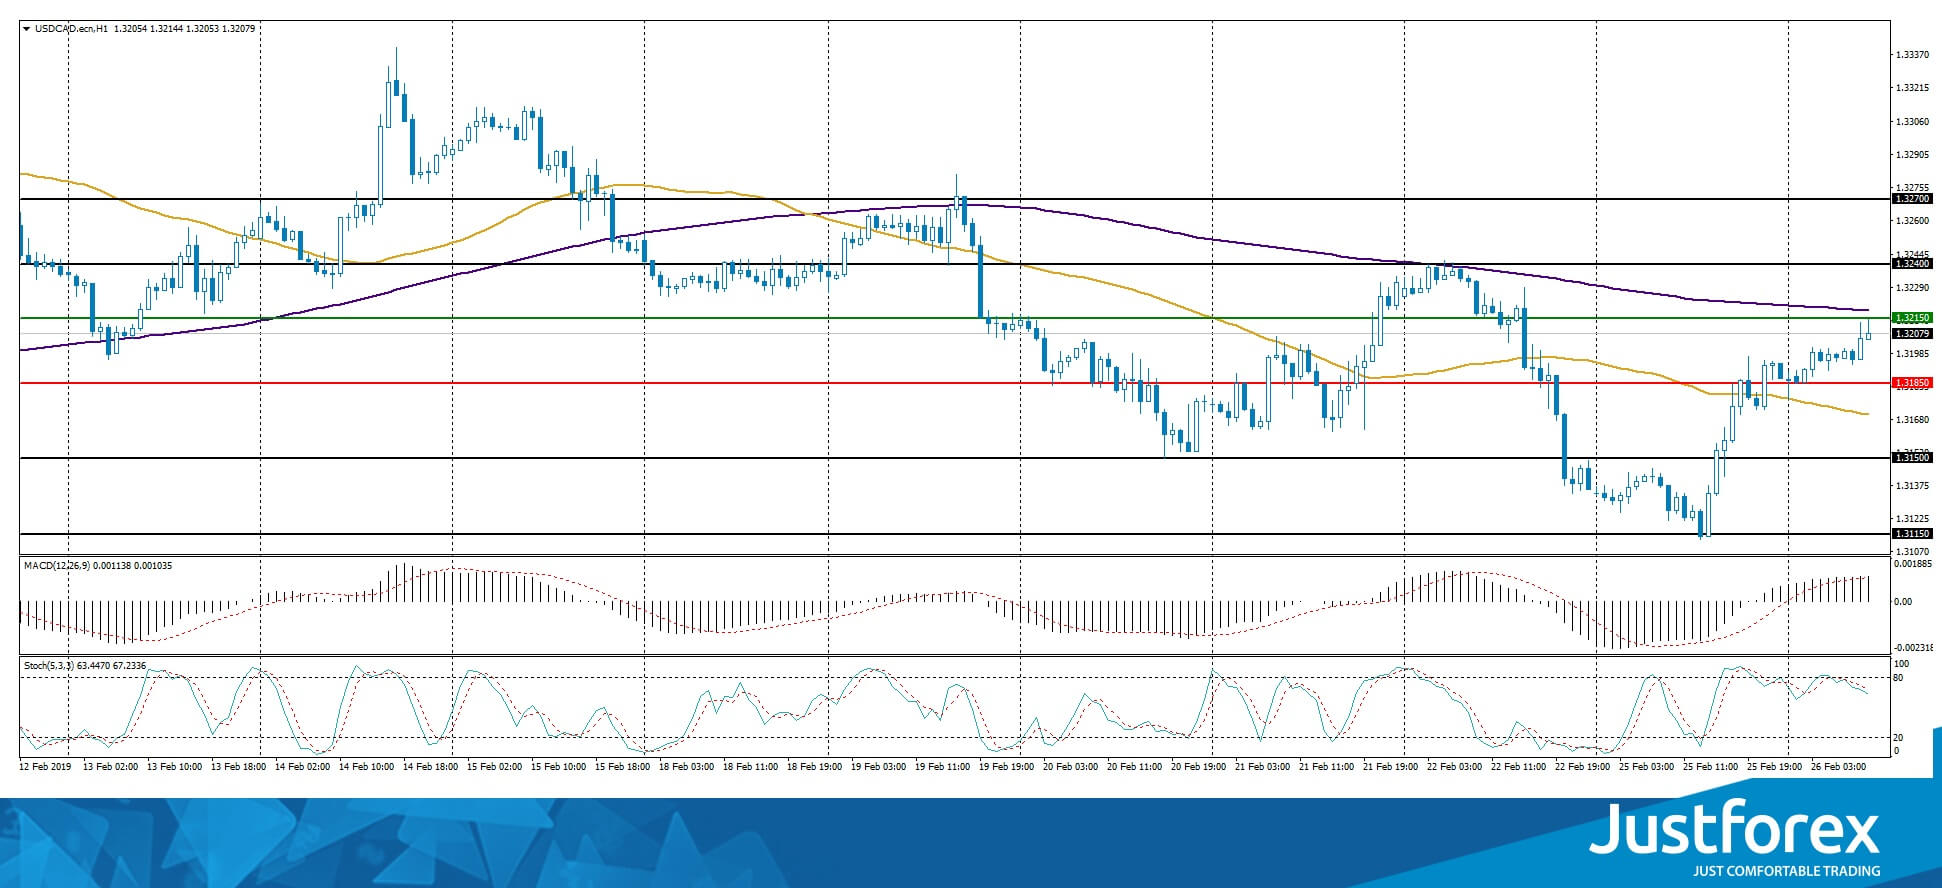
The indicators do not provide signals, the price fixed between 50 MA and 200 MA.
The MACD histogram is in the positive zone and keeps rising, which gives a strong signal to buy USD/CAD.
The Stochastic Oscillator is in the neutral zone, the %K line is below the %D line, which points to a bearish mood.
Trading recommendations
Support levels: 1.31850, 1.31500, 1.31150
Resistance levels: 1.32150, 1.32400, 1.32700
If the price fixes below 1.31850, you should look for market entry points to open short positions. TakeProfit is 1.31500-1.31300.
Alternatively, the quotes can grow further toward 1.32400-1.32700.
The USD/JPY currency pair
Technical indicators of the currency pair:
Prev Open: 110.650
Open: 111.029
% chg. over the last day: +0.24
Day's range: 110.753 – 111.075
52 wk range: 104.56 – 114.56
Since the beginning of the week, USD/JPY has been trading rather actively. There is no defined trend. Right now the safe haven currency is consolidating at 110.750-110.900 with an ambiguous technical picture. The financial market participants are waiting for the statements by the Head of the Federal Reserve. Keep and eye on the US Treasury bonds yield and open positions from the key levels.
The Economic News Feed for 26.02.2019 is calm.
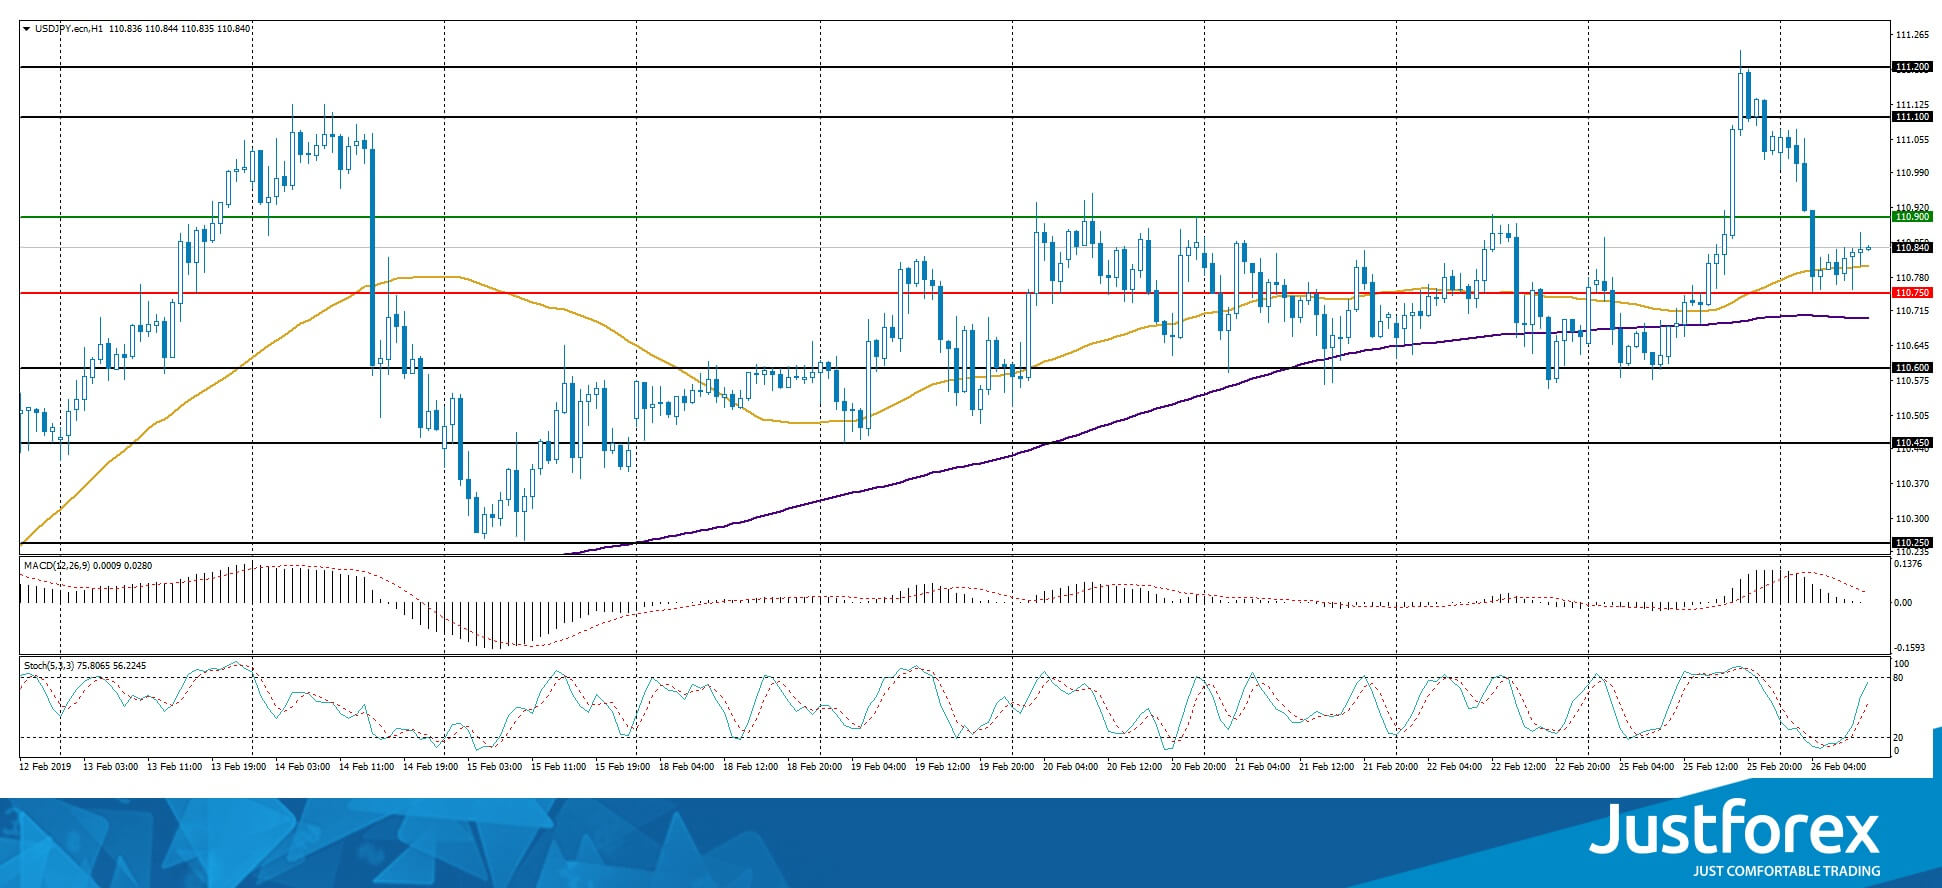
The indicators do not provide precise signals, the price crossed 50 MA.
The MACD histogram is close to 0.
The Stochastic Oscillator is in the neutral zone, the %K line is above the %D line, which points to a bullish mood.
Trading recommendations
Support levels: 110.750, 110.600, 110.450
Resistance levels: 110.900, 111.100, 111.200
If the price fixes below 110.750, expect the quotes to fall toward 110.500-110.300.
Alternatively, the quotes can grow toward 111.200-111.400.
Trade Rally Eases As Caution Sets In, Powell Testimony Eyed
- Risk rally eases amid some caution on prospect of US-China trade deal
- Immediate focus to shift to Fed Chairman Jerome Powell’s congressional testimony
- Pound jumps as May considers taking no-deal Brexit off the table
- Oil slumps after Trump tells OPEC to “take it easy” on high oil prices
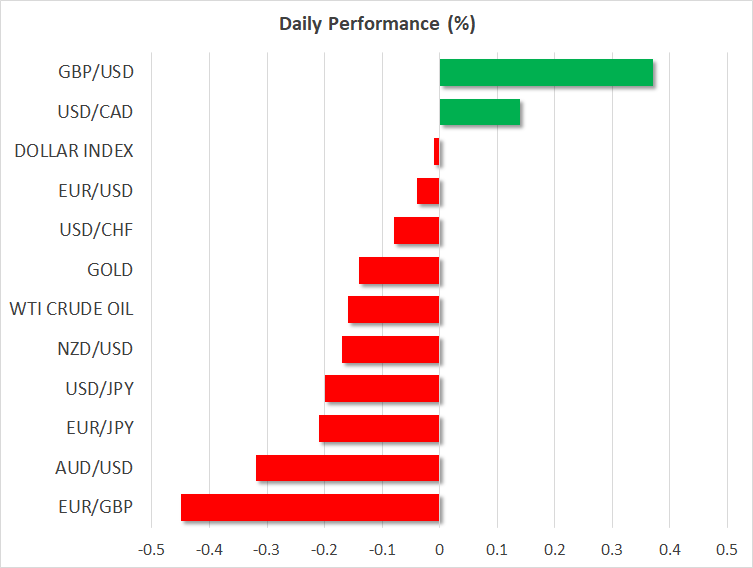
Stocks pare gains; yen firms as trade rally fades
Equities were on the backfoot on Tuesday and the safe-haven yen turned higher as some of the optimism around the expectations of a US-China trade deal being announced soon subsided. While the US President, Donald Trump, was upbeat about holding another summit with China’s President Xi, saying “we’re going to have a signing summit”, he also appeared to play down the chances of a deal, adding that it “could happen fairly soon, or it might not happen at all”. Still, all the indications are that progress is being made in the negotiations, with the leaders of both countries eager to end the months-long trade dispute.
The dollar retreated from two-month highs of 111.23 yen scaled yesterday when the Japanese currency came under pressure from the risk-on sentiment. The dollar index was steady around 96.40, while the euro was flat at $1.1355.
The yen could gain further traction over the next couple of days if scheduled talks between President Trump and the North Korean leader, Kim Jong Un, don’t end well. Trump and Kim are due to hold a second round of denuclearisation talks in Vietnam on Wednesday but it’s unclear what outcome the meeting will produce. The US wants North Korea to give up its nuclear program, but Kim is insisting on sanctions against his country being lifted first.
The safe-haven gold could also see some volatility if there are any surprise outcomes from the summit. At the moment though, the precious metal was subdued at $1325 an ounce.
Pound surges as no-deal Brexit risks recede
The pound was outperforming all other majors on Tuesday on signs that British prime minister, Theresa May, is easing her stance on keeping no-deal Brexit on the table in order to appease the Remainers within her government. Newspaper reports suggest May is considering offering MPs a vote on whether or not to rule out a no-deal Brexit if her revised Brexit deal, which is still being renegotiated with the EU, is rejected when put to the vote by March 12.
Other reports say May will allow her cabinet to discuss the possibility of extending Article 50 on Tuesday and their decision will be revealed to Parliament later in the day. In another important development over the last 24 hours, the opposition Labour party said it will back holding a second referendum on the UK’s membership of the European Union.
With time fast running out for May to get her deal through Parliament and the EU not budging on its refusal to make changes to the Irish backstop, an extension of Article 50 is looking inevitable. Sterling rallied to a near 4-week high against the dollar on Tuesday, touching $1.3161 as investors saw reduced odds of the UK crashing out of the EU.
Oil price slump weighs on commodity currencies
Commodity-linked currencies slid into losses on Tuesday as risk appetite ebbed slightly and oil prices slumped. Crude oil tumbled on Monday after Trump once again complained of excessive oil prices. Trump tweeted “Oil prices getting too high. OPEC, please relax and take it easy”, catching markets by surprise and triggering a sell-off. WTI and Brent crude fell by between 3-3.5% and were still struggling today. WTI was last down at $55.35 a barrel but Brent moved marginally higher at $64.81 a barrel.
The Canadian dollar extended yesterday’s losses against the greenback, with dollar/loonie rising to 1.3215 at the European open. The Australian dollar was down 0.3% at 0.7141 as investors eyed fourth quarter construction data due out of Australia later today.
Powell testimony to reinforce Fed patience
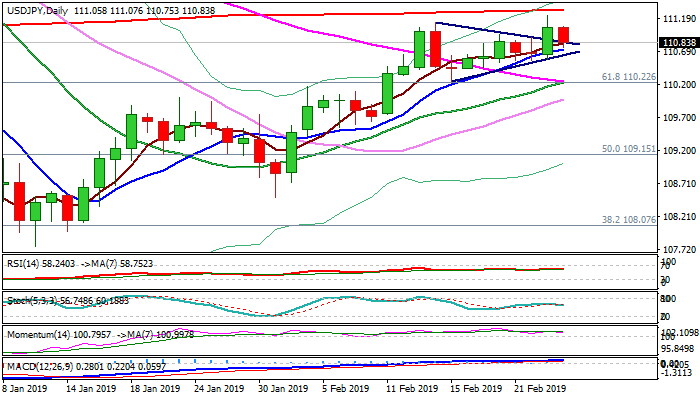
Fed chief, Jerome Powell will be the markets’ focus later on Tuesday when he testifies before the Senate Banking Committee in Congress at 15:00 GMT. Powell is unlikely to reveal anything new but may provide more clarity on the Fed’s plans to end its balance sheet unwinding later in the year.
Bank of England Governor, Mark Carney, will also be speaking before lawmakers at a hearing on the Bank’s latest inflation report at 10:00 GMT.
GBPJPY Pierces Above 200-Day MA, Bullish But Overbought
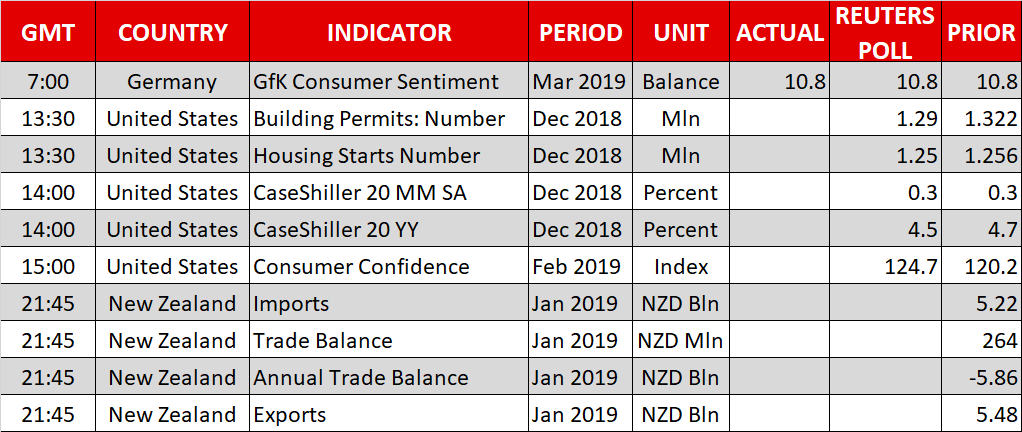
GBPJPY unlocked a fresh three-month high of 145.93 early on Tuesday after a rally above its 200-day moving average on Monday. The bullish momentum in the MACD points to further improvement in the short-term. Yet with the RSI approaching its 70 overbought mark and the stochastic oscillator fluctuating above its own 80 overbought level, the bears could soon take over.
Additional gains could send the price above today’s peak of 145.93 – where the 78.6% Fibonacci of the downleg from 149.70 to 132.49 is standing – and towards the previous key support area of 147.20. Another leg higher could touch the 148 psychological mark before a more meaningful battle starts around 149.70-150.
On the flipside, if the recent rally proves overdone, the pair could shift down to meet the 200-day MA at 144.70. Heading lower, support could next be found in the crossroads of the 61.8% Fibonacci and the 20-day MA at 143.12, while under the 50% Fibonacci of 141.10 and more importantly below the 139.80 level, questions over the sustainability of the latest upward pattern would arise.
In the medium-term picture, GBPJPY has switched to neutral thanks to the rebound off the 50% Fibonacci. The little improvement in the 50-day MA raises hopes that a bull market could soon come back into play.
USD/JPY Outlook: Bulls Face Strong Headwinds From 200SMA And Keep Risk Of Stall Despite Improved Sentiment
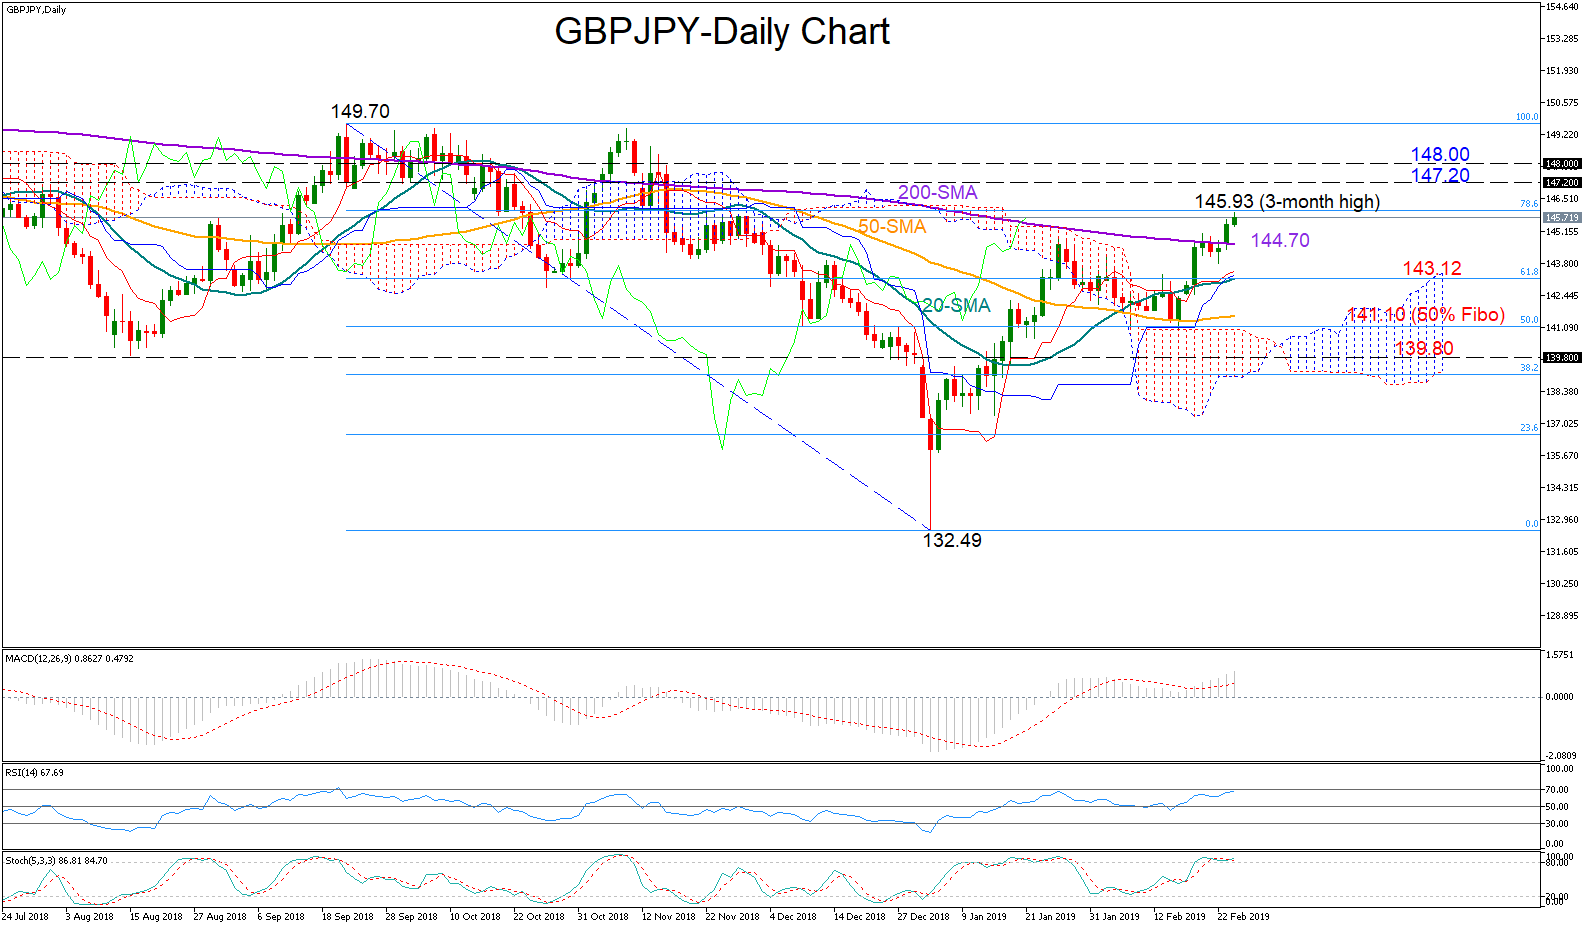
The pair trades near 2019 high at 111.23 following Monday’s rally which generated bullish signal on close above triangle resistance (110.86) and fresh probes above 111 barrier.
Fresh risk appetite on optimistic tones from US/China trade talks boosted the greenback, however, lack of momentum may prevent bulls from final attack at key 200SMA barrier (111.30).
Daily stochastic and momentum are pointing lower and could add to fears of increased hesitation on approach to 200SMA.
Repeated close above triangle’s upper boundary would be positive signal, while bearish close and potential violation of pivotal supports at 110.72/60 (10SMA / triangle support line) would weaken near-term structure and increase risk of pullback.
Res: 111.07, 111.23, 111.30, 111.55
Sup: 110.72, 110.60, 110.24, 109.97
USD/PLN Elliott Wave Forecast: Identifying Blue Box Area
In this video blog, we take a look at Elliott Wave structure of USDPLN forex pair since 1/31/2019 low and our main goal is to identify the blue box area within the pull back and what we could expect to happen from the blue box area. In our previous article about USDPLN we explained that pair is showing 5 swings up from 9/26/2018 low which makes it a bullish sequence against 1/31/2019 low and hence it should find buyers in the pull back after 3, 7 or 11 swings.
USDPLN 1 Hour Elliott Wave Analysis with Blue Box
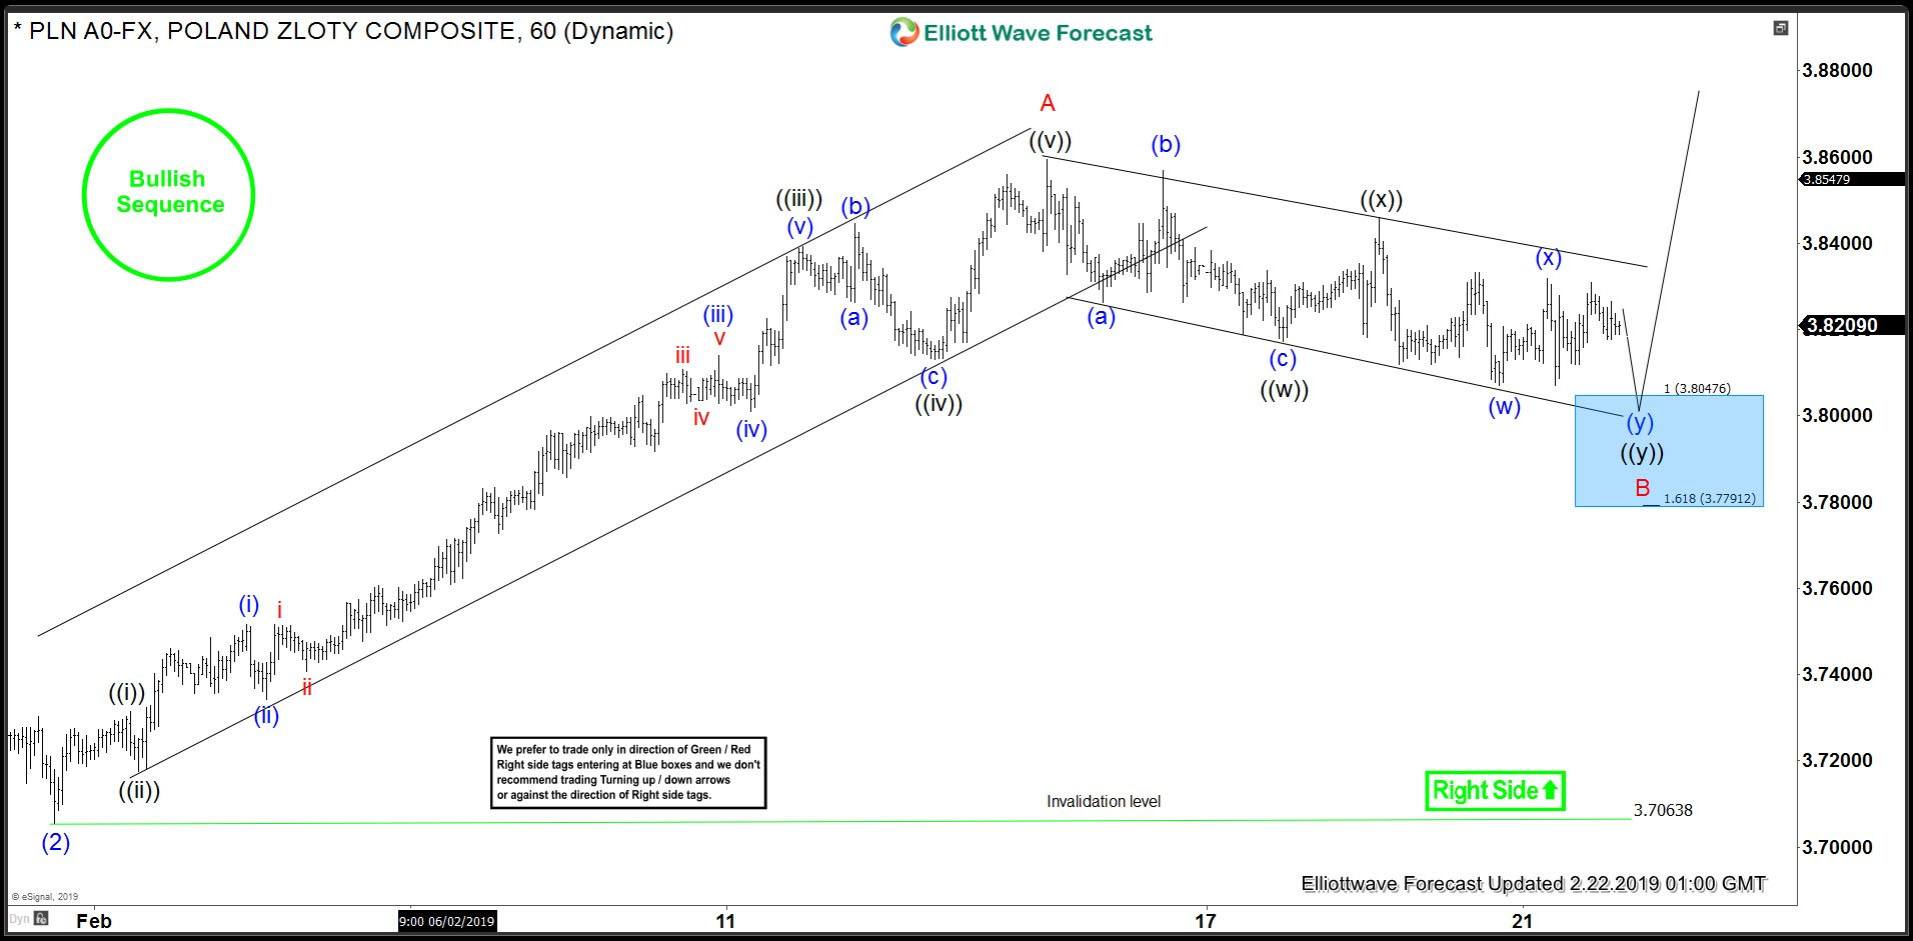
Below is a 1 hour chart of USDPLN forex pair which shows the rally from 1/31/2019 (3.7063) low to be have unfolded as an Elliott Wave Impulse within which wave ((i)) completed at 3.7315, wave ((ii)) completed at 3.717, extended wave ((iii)) completed at 3.8392, wave ((iv)) completed at 3.8131 and wave ((v)) at 3.8594. We have labelled this as wave A and currently we are within wave B pull back to correct the 5 waves move up from 3.7063 low.
Wave B is proposed to be unfolding as a double three Elliott Wave Structure when wave ((w)) ended at 3.818, wave ((x)) ended at 3.8459, pair has already made a new low below wave ((w)) so there are enough number of swings in place to call wave ((y)) and B completed at 3.8071. However, pair failed to reach the blue box so far so while below the descending trend line, there is still scope for the pair to reach the blue box between 3.8047 – 3.7791 area to complete a double three Elliott wave structure down from 3.8594. As the right side is up and there is a bullish sequence, so we don’t like selling the pair and expect buyers to appear in the blue box. Pair could either resume the rally in wave C from the blue box or bounce in 3 waves at least to allow longs to eliminate risk on the trade.
If the bounce from blue box fails and pair drops to new lows again, then we should be doing larger 7 swings structure within wave B pull back and pair should still see buyers at the next blue box area. If pair breaks above the descending trend line (currently at 3.8357), that would suggest cycle from 3.8594 high ended already at 3.8071 which could be wave B or just the first leg of wave B pull back. In either case, 3.7063 low remains to be key for the bulls and as far as we stay above this level, we should see more upside in the pair.
AUD/CAD Elliott Wave View: Forecasting The Decline
In this technical blog, we are going to take a look at the past performance of AUDCAD Elliott Wave 1-Hour Charts that we presented to our members. In which, the bounce to 1/31/2019 peak (0.9581) ended wave X bounce. Down from there, wave (w) ended in a lesser degree zigzag structure where wave (a) ended at 0.9450, wave (b) bounce ended at 0.9523 high. Wave (c) ended at 0.9375 low and finally completed wave (w) at 0.9375 low. Up from there, the pair corrected the decline from 0.9581 peak in wave (x) bounce. We will explain the structure of that bounce & forecast below.
AUDCAD Elliott Wave 1 Hour Chart From 2/20/2019
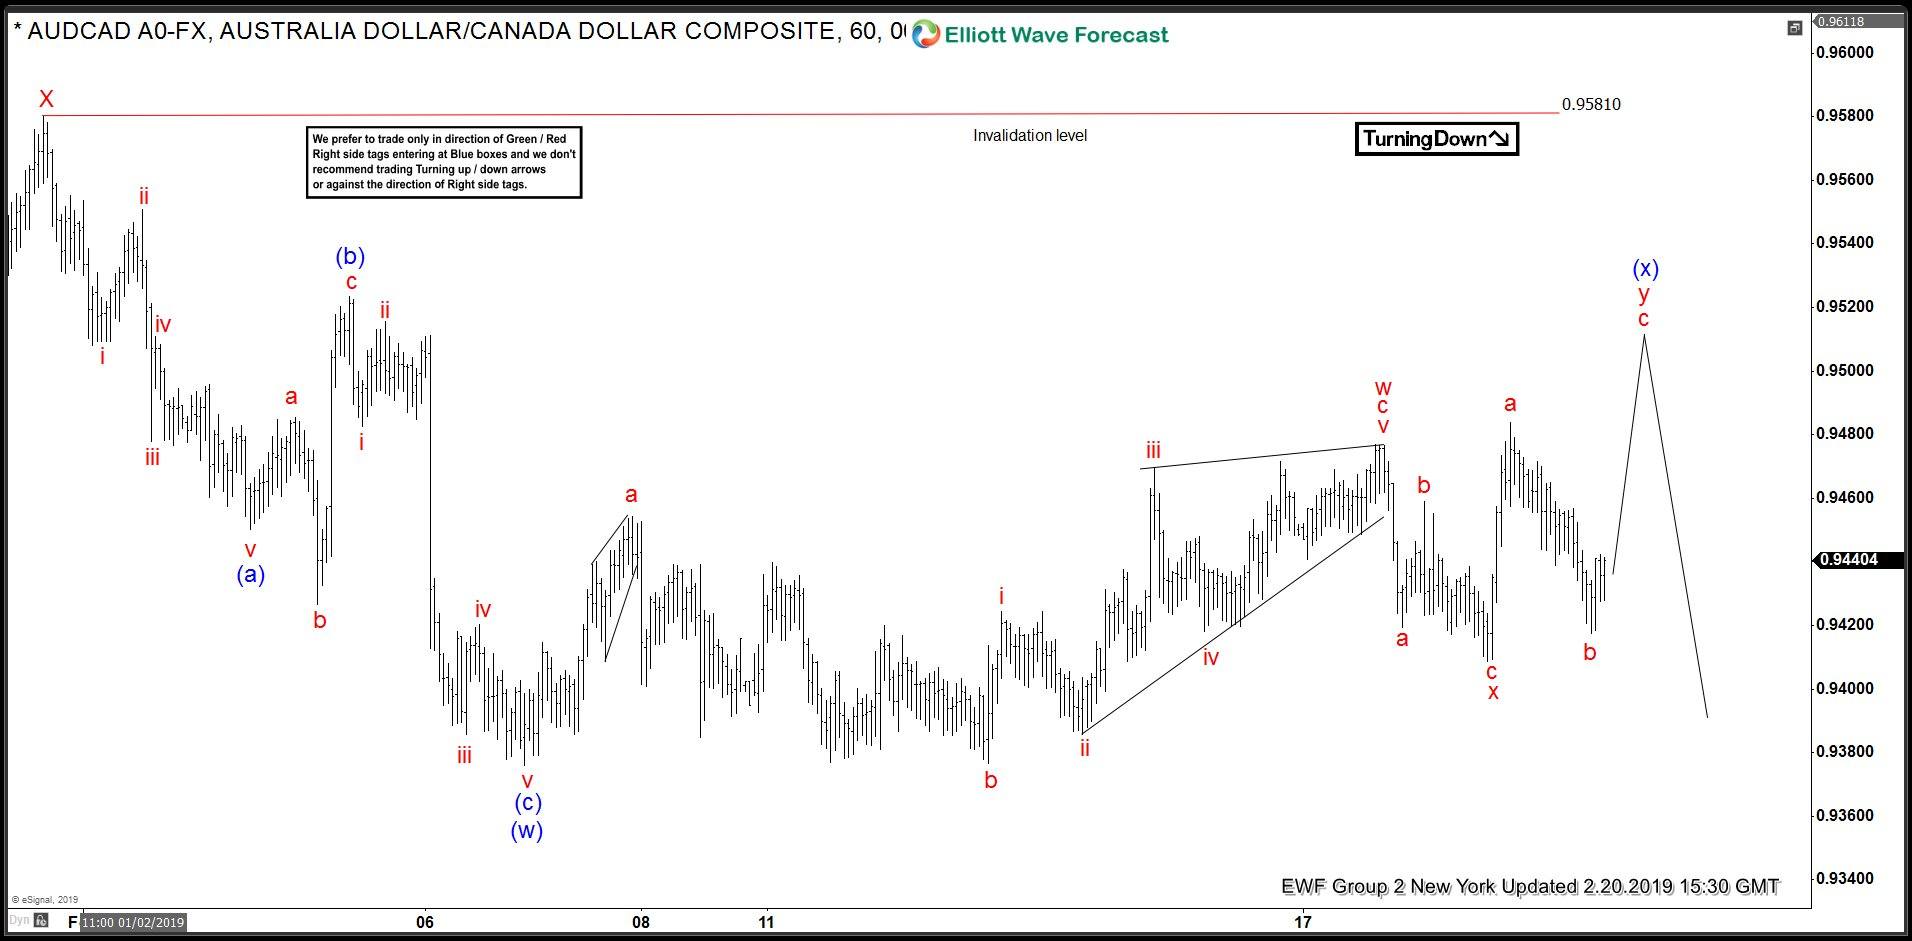
Above is the 1-hour Chart from 2/20/2019 New York update, in which the pair is correcting the short-term cycle from 1/31/2019 peak (0.9581) in wave (x) bounce. The internal of that bounce unfolded as Elliott wave double three structure. Also known as 7 swings structure where lesser degree wave w ended in 3 swings as a Flat correction at 0.9476 high. Down from there, wave x ended in lesser degree zigzag structure at 0.9408 low. Above from there, wave y of (x) higher was expected to take place as Elliott wave zigzag structure before downside resume.
AUDCAD Elliott Wave 1 Hour Chart from 2/21/2019
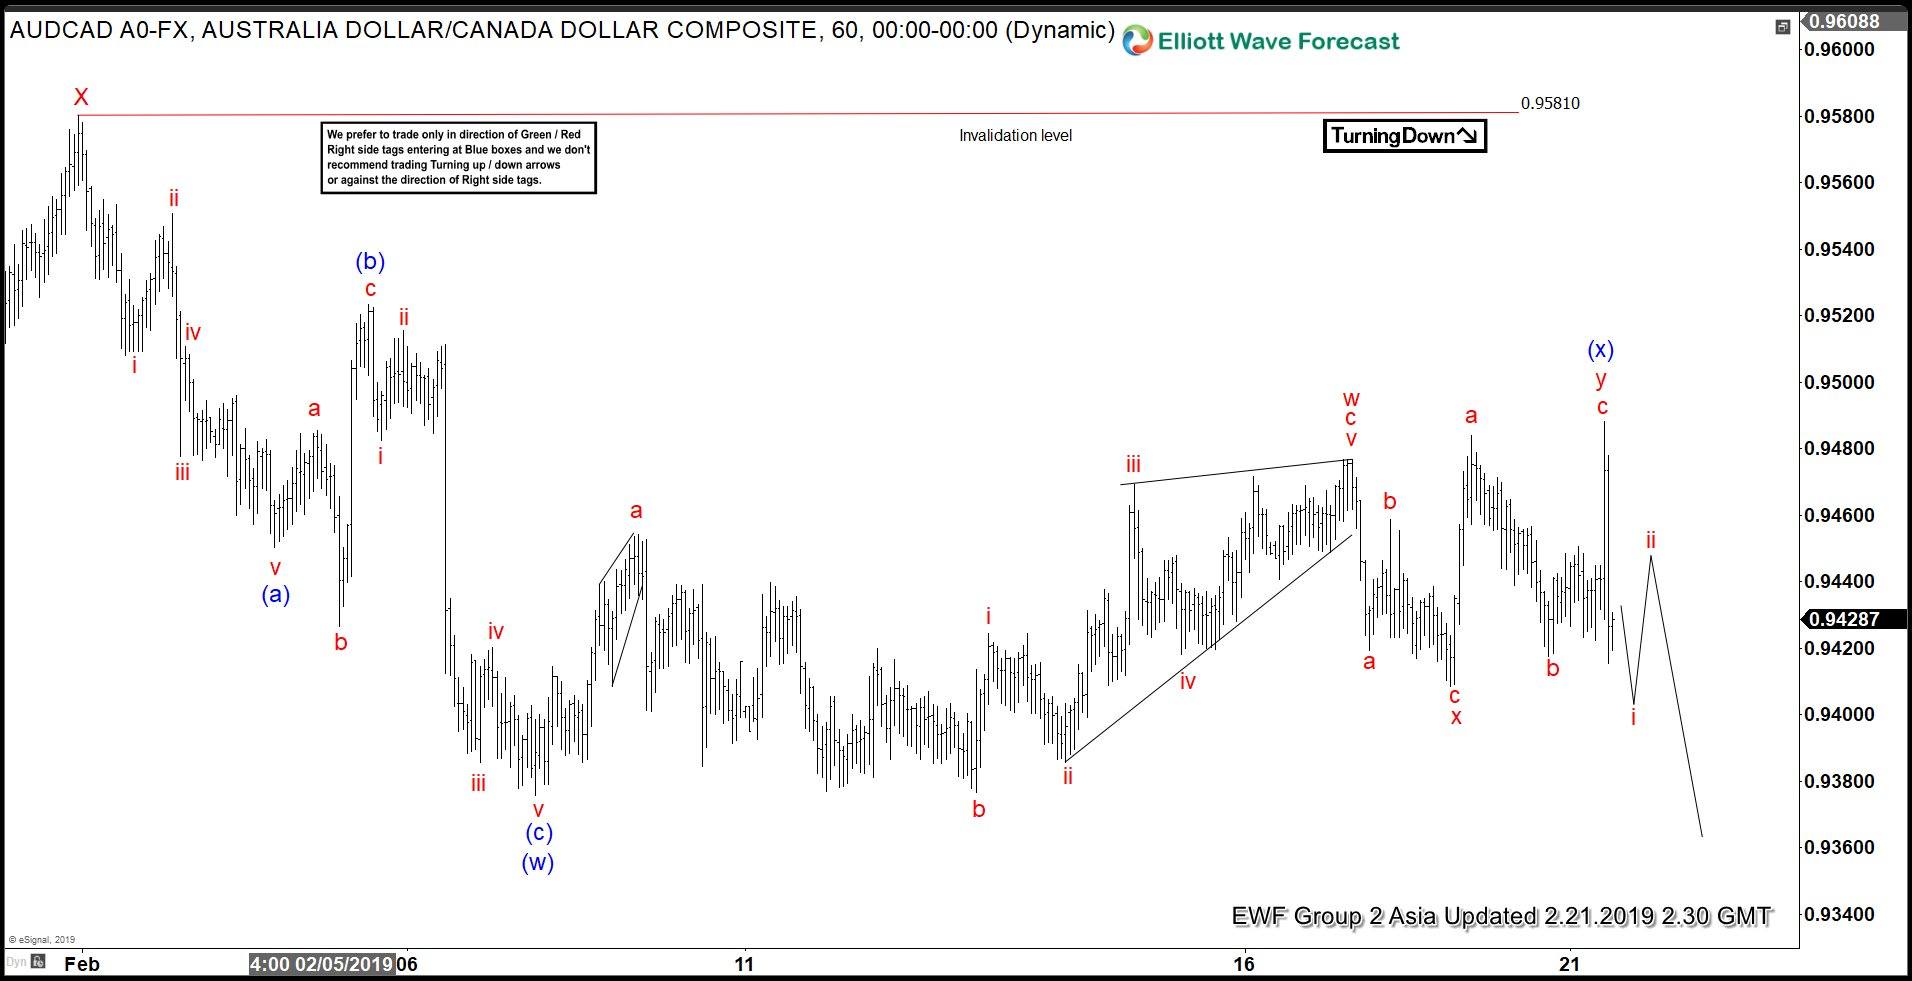
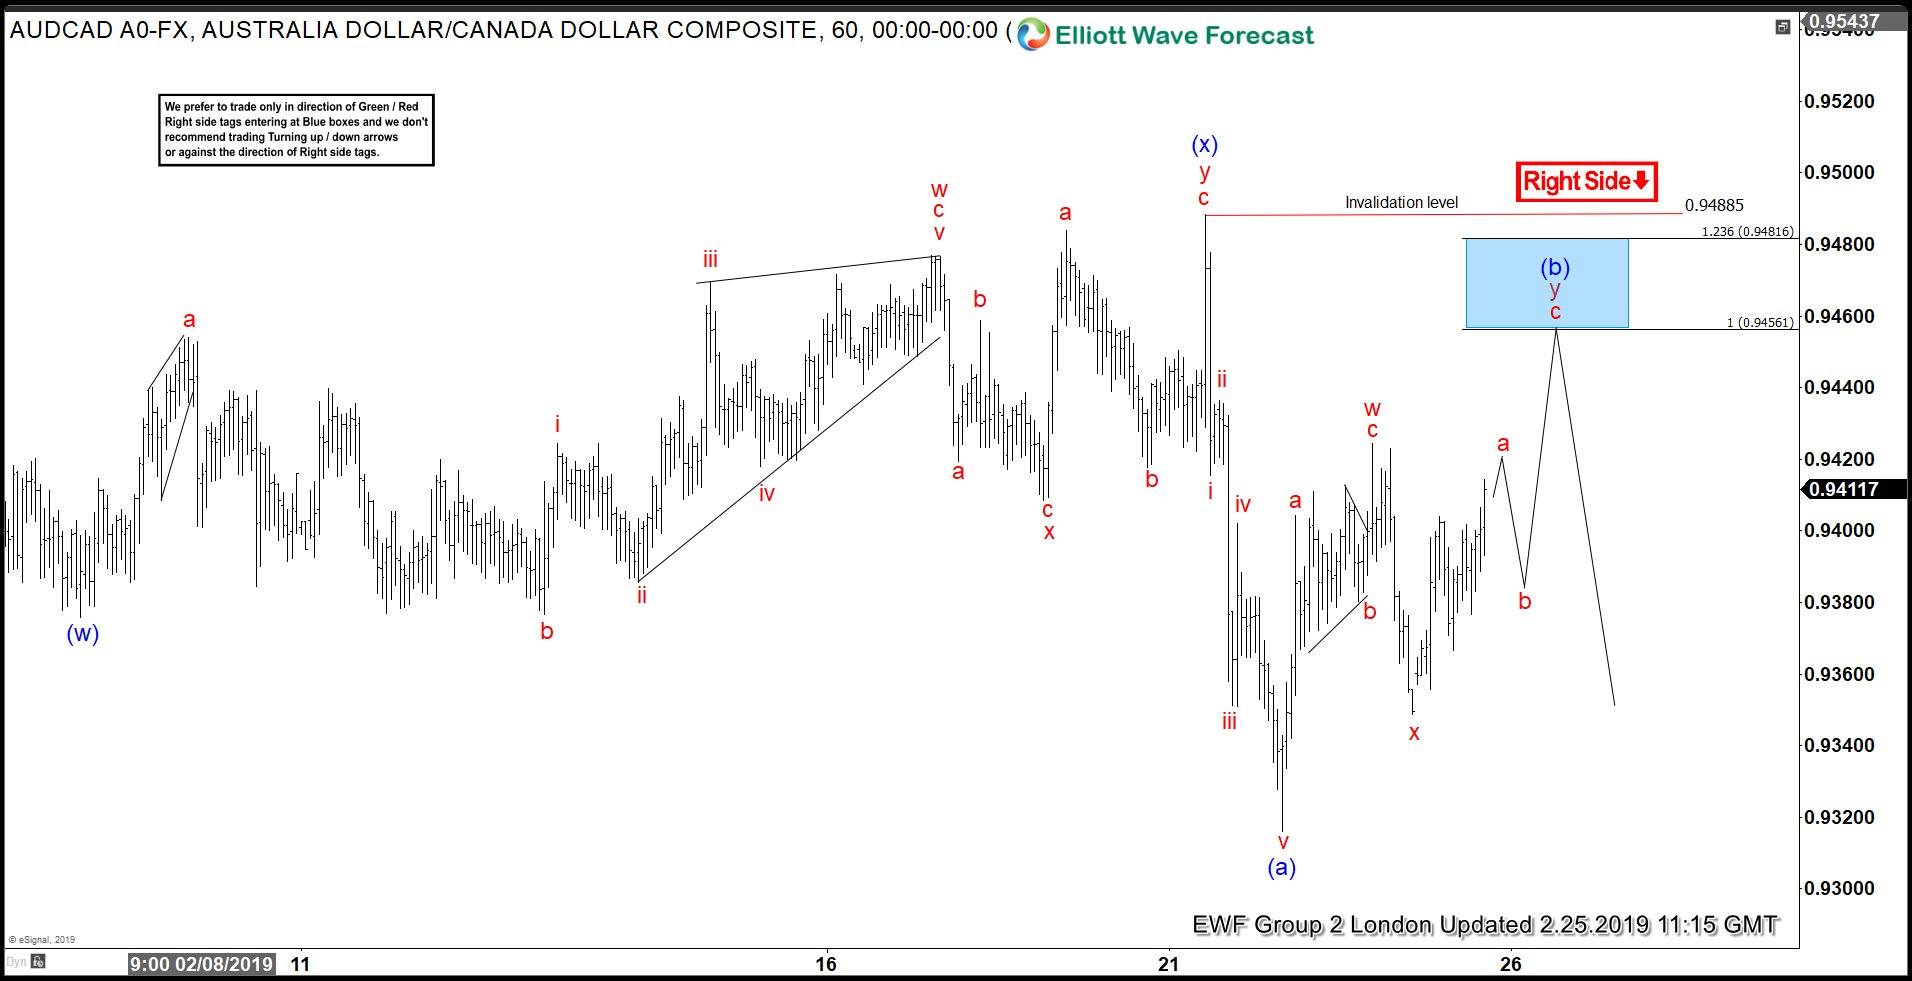
AUDCAD 1 Hour Elliott wave Chart from 2/21/2019 Asia update, in which the pair made the last push higher as expected and ended wave y of (x) at 0.9488 high. Down from there, the pair has made a new low below 0.9375 low confirming the next move lower in wave (y) towards 0.9280-0.9153 100%-161.8% Fibonacci extension area of (w)-(x) before a 3 wave bounce takes place. Near-term, as far as bounces fail below 0.9488 high expect pair to extend lower.
AUDCAD Elliott Wave Latest 1 Hour Chart From 2/25/2019
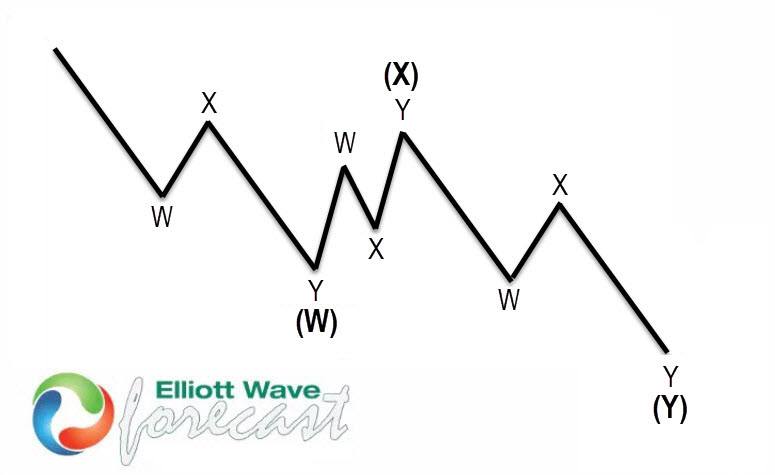
Double three is most common patterns in New Elliott Wave theory is 7 swings structure (double three). We spot it in the market every day in many instruments. It’s a very reliable structure by which we can make a good analysis and what is most important it’s giving us good trading entries with clearly defined invalidation levels and target areas. The picture below presents what Elliott Wave Double Three pattern looks like. It has (W),(X),(Y) labeling and 3,3,3 inner structure, which means all of these 3 legs are corrective sequences. Each (W) and (Y) are made of 3 swings, they’re having W,X,Y structure in a lower degree.
Progress In Brexit Negotiation Supports Pound Sterling
British Pound Sterling is the best performing major currency last week. The Pound Sterling shows strength as the market senses progress towards a Brexit deal. This follows news pointing to progress in Brexit negotiations. Last week UK Prime Minister Theresa May and EU President Jean-Claude Juncker met in Brussels to secure a deal. Both have suggested that progress was taking place. The Euro-to-Pound (EURGBP) exchange rate dropped to 0.869 while Pound-to-Dollar (GBPUSD) rallied to 1.3109.
Below is a tweet after the meeting from Ms. May suggesting they are making progress.
Negotiations revolve around securing a legal guarantee to ensure that Irish backstop in the Brexit agreement is not indefinite. This should help the deal to gain approval in UK parliament and satisfy those ministers who voted down the Brexit deal. Reuters reports that Chancellor of Exchequer Phillip Hammond says there can be a meaningful vote on the Brexit deal as early as this week as talks have been good and constructive. This suggests we could have a new agreement between the EU and UK over coming days. The UK is set to leave the EU at March 29 and the two sides will try to avoid causing damages to each other until then.
EURGBP 4 Hour Elliott Wave chart
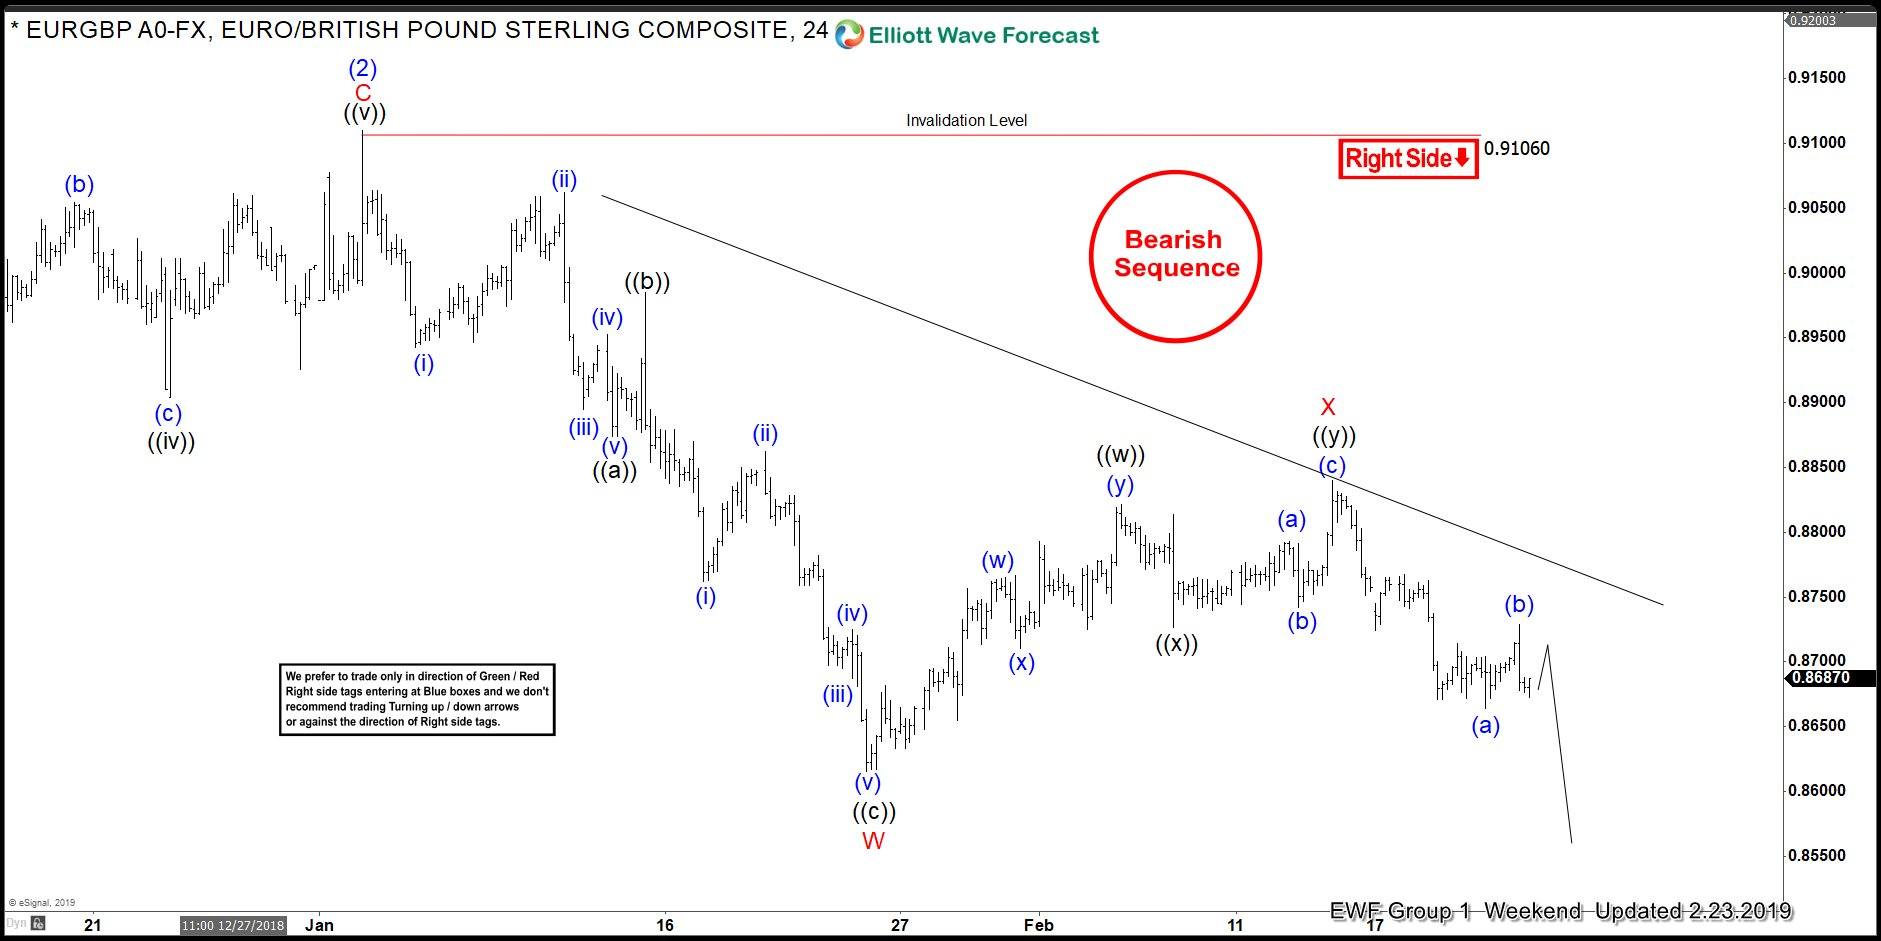
EURGBP cycle from August 29, 2017 high shows a bearish sequence favoring further downside. As the chart above shows, we label the bounce to 0.9106 as wave (2). Decline from there is unfolding as a double three Elliott Wave structure. Down from 0.9106, wave W ended at 0.8615 and wave X ended at 0.884. Pair still needs to break below wave W at 0.8615 to validate this view. Until then, a double correction in wave X still can not be ruled out. Either way, as far as pair stays below 0.9106, expect pair to extend lower.
GBP/USD Outlook: Pound Extends Advance On Brexit Delay News
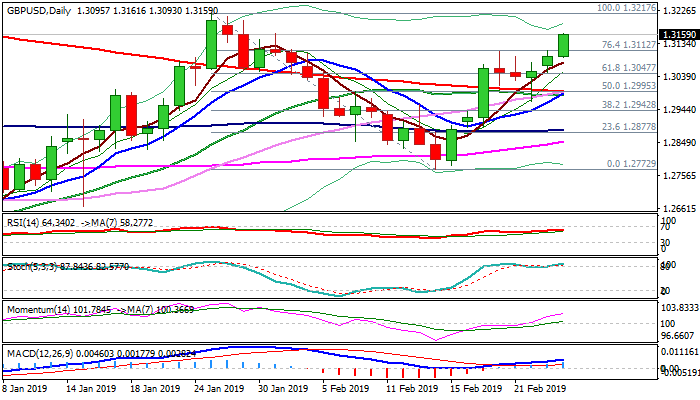
Cable accelerated higher and hit new 3 ½ week high at 1.3161 in Asian session on Tuesday, boosted by reports that UK PM May was considering delaying the deadline for UK's exit from the European Union.
Fresh rally surged through 1.3112 Fibo barrier (76.4% of 1.3217/1.2772), the last obstacle en-route to 1.3217 target (2019 high), which kept the upside limited in past few sessions.
Increasing daily momentum and MA's in bullish setup (converged 10,20,30 SMA are on track to form multiple bull-cross with 200SMA at 1.30 zone) support scenario for final push towards 1.3217 (25 Jan high).
Bulls may run out of steam on approach to 1.3217 as daily stochastic is overbought and barrier reinforced by converging 100/55WMA's (1.3201/1.3223), with additional pressure coming from falling and thickening weekly cloud (cloud base lays at 1.3265).
Broken Fibo barrier at 1.3112 now acts as initial support, with rising 5SMA (1.3077) expected to keep the downside protected to maintain bullish stance.
Res: 1.3161, 1.3217, 1.3265, 1.3297
Sup: 1.3112, 1.3077, 1.3047, 1.3000
Pound Clings Onto Brexit Delay Hopes
Pound bulls were injected with a renewed sense of confidence this morning following reports that UK Prime Minister Theresa May could delay Brexit beyond 29 March.
This development will certainly remove some element of uncertainty over Brexit whilst soothing fears over the UK crashing out of the EU without a deal in place next month. However, a major risk accompanied by extending Article 50 is that Britain will find itself trapped in a Brexit limbo. While the Pound has scope to extend gains on Brexit delay expectations, the medium to longer term outlook remains blurredby a thick cloudof uncertainty. With the odds of a second referendum also rising after Labour leader Jeremy Corbyn made a U-turn to back the move, another question floating in the air is whether there will even be a Brexit.
With just over one month left until the UK is scheduled to leave the European Union, we expect the Pound to display extreme levels of sensitivity and volatility to Brexit headlines. Although some attention will be directed towards the inflation report hearings later today, this will likely be overshadowed by a crucial cabinet meeting where the Brexit deadline will be discussed.
Focusing on the technical picture, the GBPUSD is pushing higher on the daily charts with prices trading around 1.3130 as of writing. The combination of Brexit delay expectations and Dollar weakness has the potential to push the GBPUSD towards 1.3200 in the near term.
Dollar waits for Jerome Powell
The Dollar has lost its mojo in recent days, slipping closer to the 96 psychological level due to a number ofdomestic and external factors.
A string of soft economic data from the United States, coupled with growing speculation over the Fed taking a break on monetary tightening this year, has brought nothing but bad news for the Dollar. The risk-on flows have also pulled investors away from safe-haven assets and currencies, which will inevitably pressure the Dollar further. Although Dollar bulls were initially supported by the economic divergence between the US and everyone else, this theme could be coming to an end.
Much attention will be directed towards Fed Chair Jerome Powell’s congressional testimony later in the day. Powell’s testimony could offer investors some additional insight into the Federal Reserve’s monetary policy stance for 2019. The central bank head is expected to reiterate that the Federal Reserve will remain “patient” on future hikes. We see the Dollar weakening against a basket of major currencies if Powell adopts adovish tone during his testimony.
Commodity spotlight – Gold
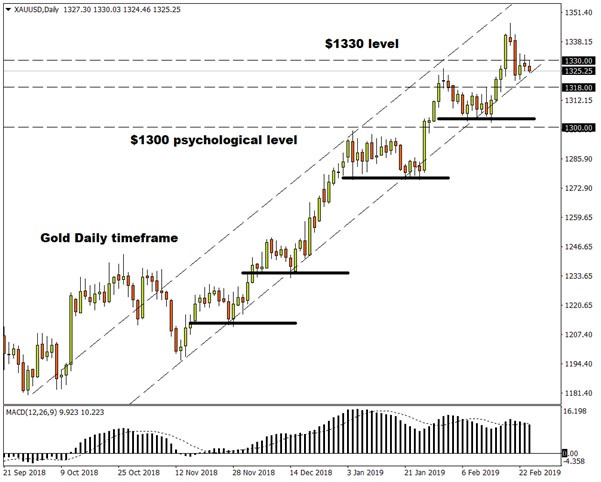
Gold weakened towards $1,326 this morning, as US-China trade optimism sent investors sprinting to riskier assets.
Although the precious metal is at riskof depreciating further in the short term amid the risk-on sentiment, the medium to longer term outlook swings in favour of Gold bulls. For as long as geopolitical risks, concerns over plateauing global growth and speculation over the Fed taking a pause on rate hikes remain key themes, Gold is insulated from extreme downside shocks.
In regards to the technical picture, sustained weakness below $1,330 is likely to encourage a decline towards $1,318. However, bulls still remain in control above the $1,303 higher low.
Mayday! Mayday! Mayday! Theresa May Faces A Difficult Choice
There may be very few days when Theresa May didn’t hear the Mayday! Mayday! call during her time as a prime minister. This call has become even more intense today, the prime minister faces another difficult choice. She is facing a threat of mass resignations from the pro-EU ministers in her team if she doesn’t take the option of no deal off the table. Time is of the essence because, in just over a month, the UK will be crashing out of the EU with a deal or without any deal; unless the divorce is delayed. The prime minister has made numerous failed attempts to strike a deal with the EU and consistently delivered one message: she is not in favour of delaying the Brexit divorce process. Her unpopular deal has no support from the lawmakers in the parliament and she has faced several landside rejections many times.
The choice in front of her is arduous, if she delays the Brexit, the potential outcome could be even more disarray in her cabinet. This could even trigger a threat of bringing her government down by Torie rebellions who want the UK to leave the EU. On the other hand, if she sticks to her guns, and refuses to back the process of delaying the divorce, a mass resignation by MPs from her party is a done deal. This is all due to her own stubbornness because the deal she secured was never liked by anyone and she remained consistent with the idea that she is willing to make the gamble of leaving the EU with or without any deal.
Perhaps, the only imaginable choice for her is to agree that she will ponder extending the divorce process and balance the effects of this by saying: she will leave no stone unturned in an effort to secure a deal.
Brexit isn’t that simple, it was a wrong choice and the EU is determined to take every opportunity to remind the UK of this. This is because when it comes to the extension element, the EU has backed the idea by labelling it as the only rational choice but at the same time, they have also added that the extension should be until 2021; the short term extension will not yield any outcome.
An extension which can take the Brexit uncertainty until 2021 would be highly unpopular in the UK and it will only bring the threats of another referendum. May could always use this threat to her advantage in order to attract support. However, this comes at a time when the opposition party leader, Jeremy Corbyn, has already backed the idea of the second referendum.
In this political bust, uncertainty in the business environment is at its peak. Sterling-dollar pair moved higher yesterday on the back of the hopes that the prime minister may be willing to support the Brexit delay process. This pushed the currency towards 1.3146 level, the high of the day is 1.3162 and the low is 1.3075. If later today, at 12:30 UK time, backs the idea of delaying the Brexit, we could see the momentum taking off once again which could push the currency above 1.32 mark against the dollar.