Sample Category Title
USD/JPY Breaks Resistance At 110.00
The US Dollar broke a significant level of resistance against the Japanese Yen. Namely, the resistance of a medium descending pattern that captured the week long sideways trading below the 110.00 level was broken. The event signals the end of sideways trading.
As the pair continues to surge upwards, it will face the weekly R1 at 110.14. After breaking the weekly R1, the pair is set to reach for the next resistance level at the 110.50 mark.
On the other hand, at any moment the pair might begin to consolidate its gains by trading sideways and waiting for the support of the 55 and 100-hour simple moving averages to approach the rate and initiate a continuation of the surge.

Gold Declines On Monday
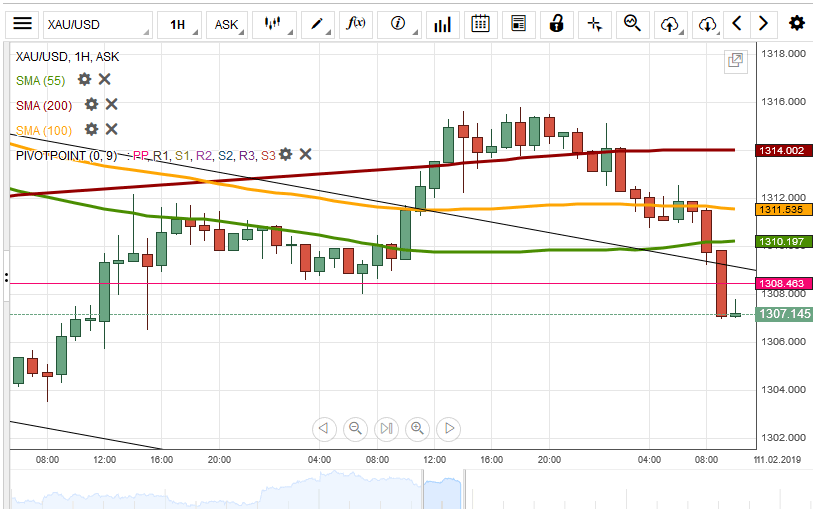
The yellow metal's price managed to break the resistance of simple moving hourly averages on Friday. However, on Monday the metal's price ignored the support of these levels and declined down to 1,310.00.
Making forecasts for the commodity price at the moment is rather complicated. In general, watch the price action near each of the simple moving averages and the pivot point level at 1,308.45.
If the PP gets passed, a decline should occur. On the other hand a step by step passing of the SMAs might result in a surge up to the 1,320.00 level.
EUR/USD Tests Dominant Support
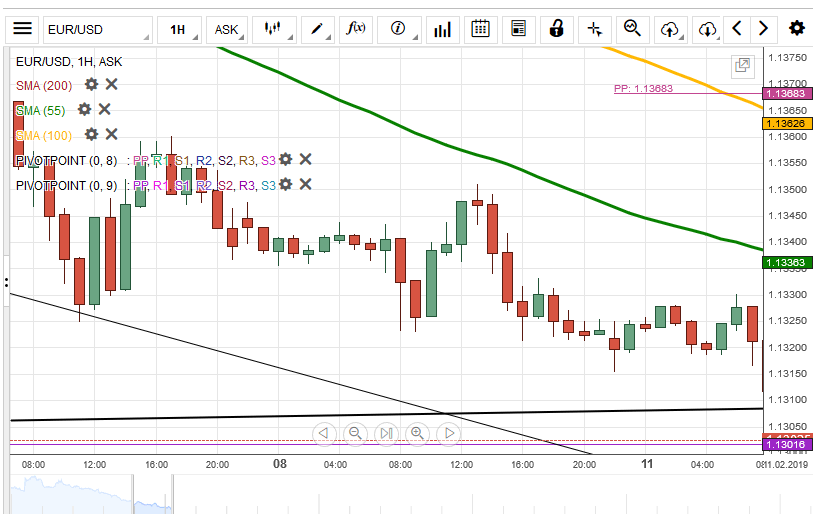
On Monday morning the EUR/USD was testing the support of a medium scale ascending pattern. The forecasts surround this level.
Namely, in the first and main scenario the rate is expected to bounce off from the support line and surge up to the resistance of the 55-hour simple moving average. By the middle of Monday's trading the SMA was moving lower near the 1.1340 mark.
On the other hand, the pair might break the support of the pattern. Afterwards, it would face the support of a monthly pivot point at 1.1300.
EUR/JPY Breaches 50-Hour SMA
The 50-hour simple moving average pulled down the Eurozone single currency against the Japanese Yen on Friday. The pair depreciated about 0.42% during Friday's trading session.
The currency pair started Monday's trading session with an upside movement. By the middle of the day, the EUR/JPY pair has breached a resistance level at 124.94.
As for the near future, it is likely that bullish traders push the currency exchange rate towards a resistance cluster formed by the weekly PP and the 100-hour SMA at 124.80.
However, technical indicators suggest that the pair will continue its southern movement today.
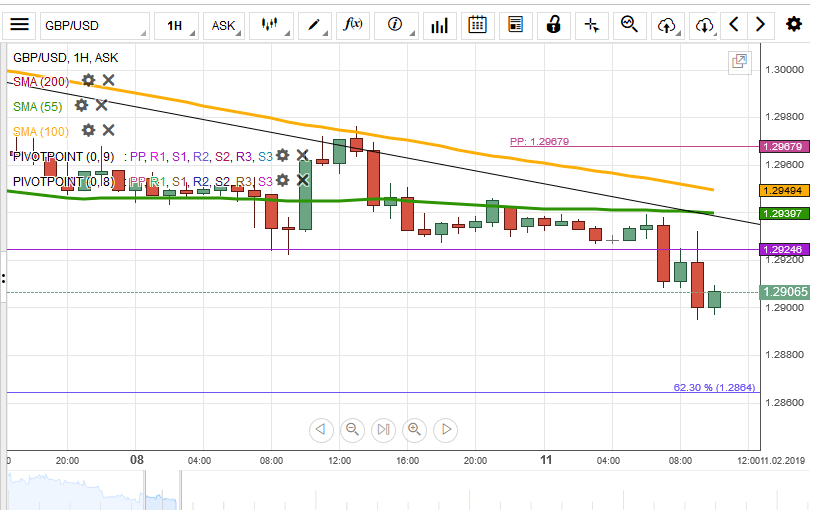
GBP/USD Has No Technical Support As Low As 1.2860
The GBP/USD pair is bouncing off resistance levels, which create a resistance cluster from the 1.2940 to 1.2950 levels. Meanwhile, the pair had no technical support as low as the 1.2860 mark.
In general, from a technical perspective the rate is expected to continue its decline in the borders of a descending channel pattern. Namely, it should reach for the 62.30% Fibonacci retracement level at 1.2864.
On the other hand another fundamental announcement about the Brexit talks might immediately change the situation by causing another bounce upwards or sudden drop down.
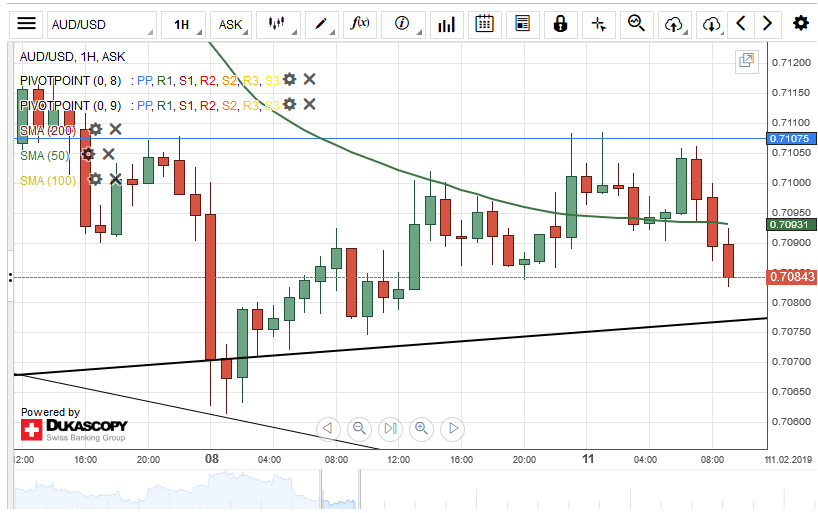
AUD/USD Faces Strong Resistance Level
A resistance level formed by a traditional monthly pivot point at 0.7105 restricted the Australian Dollar from making an upward movement against the US Dollar on Friday.
If the exchange rate passes the monthly PP as mentioned above, the next target for bullish traders will be near a resistance cluster formed by the 100-hour simple moving average and the weekly pivot point at the 0.7139 area.
However, if the monthly PPP continues to hold, a breakout through the lower boundary of a medium-term ascending channel pattern could be expected during the following trading session.
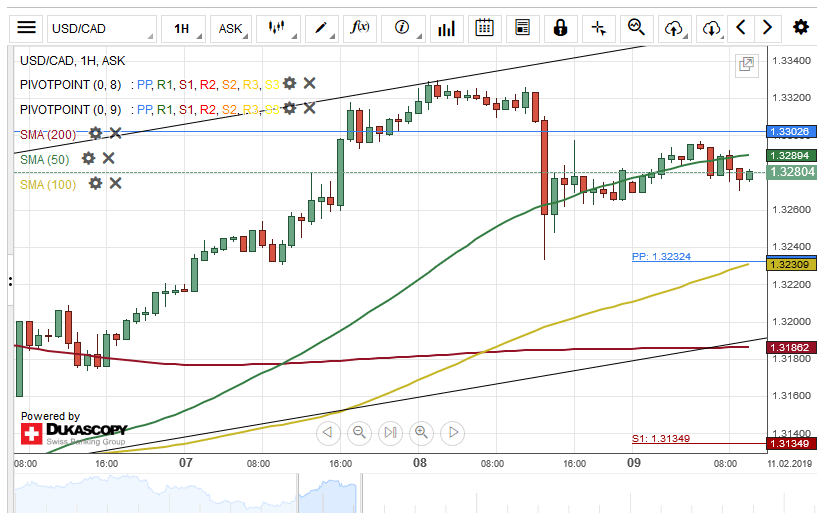
USD/CAD Target At 1.3186
The Greenback depreciated by 91 base points against the Canadian Dollar on Friday. The exchange rate breached the 50-hour simple moving average at 1.3263 during Friday's trading session.
As for the near future, it is likely that the currency pair will continue to fall in the short-term. The possible downside target will be near the lower boundary of a junior ascending channel pattern at 1.3186.
However, it is important to note that a support cluster set by the 100-hour simple moving average and the weekly pivot point at 1.3232 could hinder such movement to occur today.
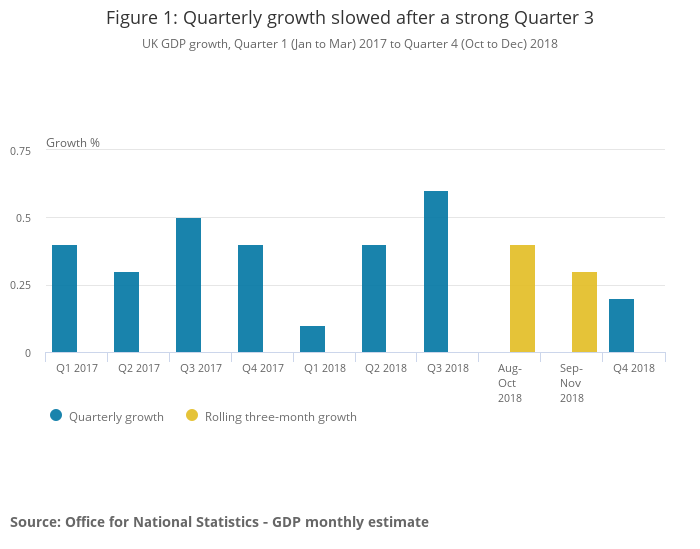
UK GDP contracted -0.4% in Dec, Q4 growth slowed to 0.2%
The batch of economic data from UK is all the way poor. GDP grew only 0.2% qoq in Q4, below expectation of 0.3% qoq, and a sharp slowdown from Q3's 0.6% qoq. In December, GDP contracted -0.4% mom , much worse than expectation of 0.0% mom. Annually, GDP growth slowed to 1.4%, lowest since 2012.
ONS Head of GDP Rob Kent-Smith said in the release that " manufacturing of cars and steel products seeing steep falls and construction also declining." Also, "declines were seen across the economy in December, but single month data can be volatile meaning quarterly figures often give a better indication of the health of the economy." Full release here.
Also from UK,
- Industrial production dropped -0.5% mom, -0.9% yoy in December versus expectation of 0.1% mom, -0.5% yoy.
- Manufacturing production dropped -0.7% mom, -2.1% yoy in December versus expectation of 0.2% mom, -1.1% yoy.
- Construction output dropped -2.8% in December versus expectation of 0.1% mom.
- Trade deficit narrowed to GBP -12.1B in December versus expectation of -12.0B.
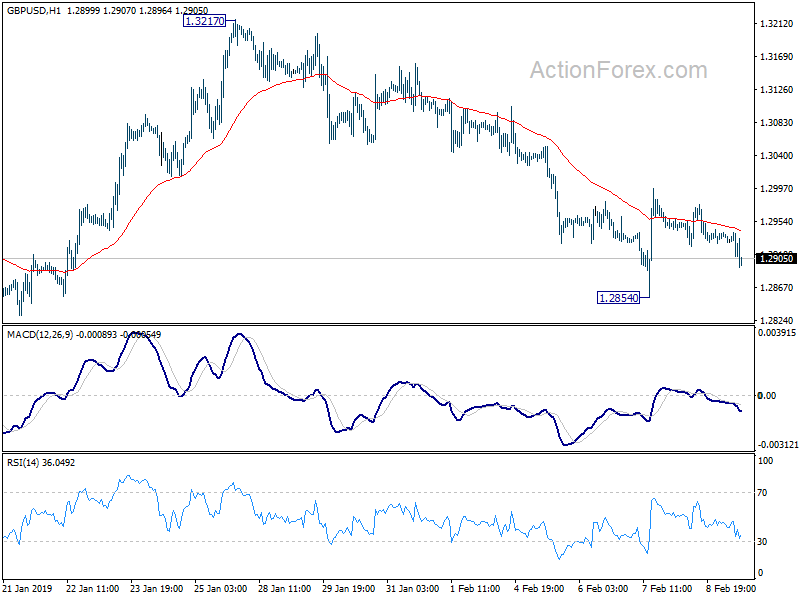
Pound's reaction to the data is mild though. Despite a dip, GBP/USD is currently kept well above 1.2854 temporary low.
USD/JPY Outlook: Fresh Bulls Crack Key Barriers At 110.00/22 Zone, Sustained Break To Signal Bullish Continuation
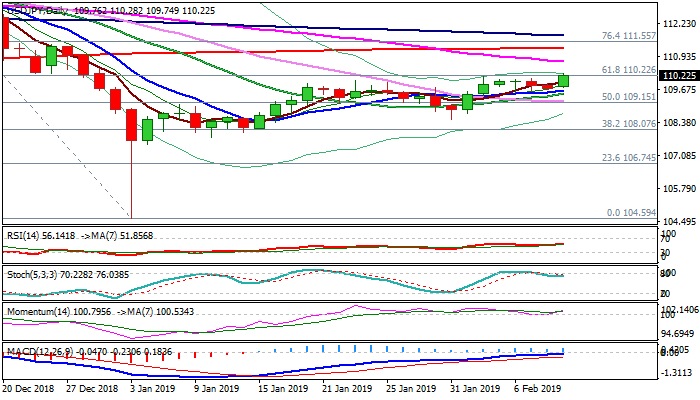
Fresh bulls, underpinned by rally in JPY crosses probe again through key barriers at 110.00/22 zone (psychological/weekly cloud top/previous upside rejections/Fibo 61.8% of 113.70/104.59) on Monday.
Stronger dollar across the board adds to pair's bullish stance in early Monday's trading, with the action being supported by strengthening daily momentum and underpinned by north-heading 10/20SMA (109.62/109.50).
Eventual close above 110.22 Fibo barrier would generate signal for continuation of bull-leg from 104.54 (3 Jan spike low) towards barriers at 110.75 (55SMA) and more significant 200SMA (111.25).
Conversely, another failure to break higher would signal prolonged directionless mode, but bullish bias would remain while the price holds above 10/20SMA's.
Res: 110.28, 110.75, 111.25, 111.55
Sup: 109.93, 109.62, 109.50, 109.18
Forex Technical Analysis: EUR/USD, USD/JPY, GBP/USD
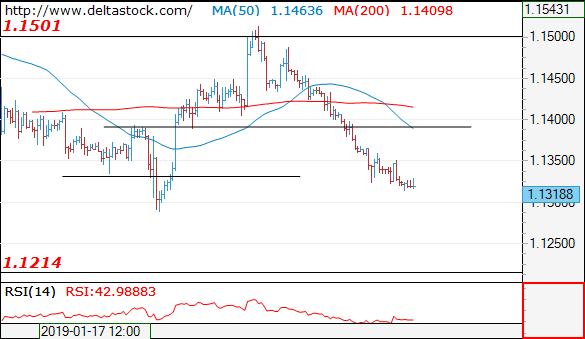
EUR/USD
Current level - 1.1318
My outlook remains counter-trend against 1.1290, for an upswing towards 1.1440.
| Resistance | Support | ||
| intraday | intraweek | intraday | intraweek |
| 1.1390 | 1.1630 | 1.1290 | 1.1214 |
| 1.1440 | 1.1820 | 1.1290 | 1.1100 |
USD/JPY
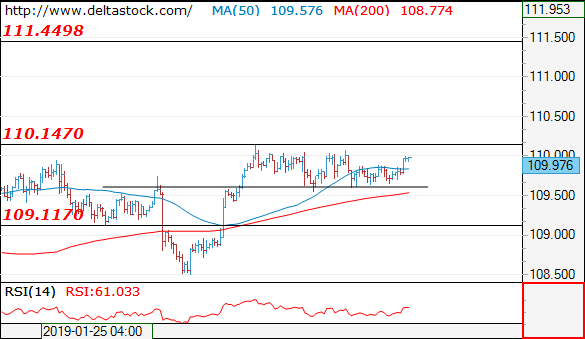
Current level - 109.97
The consolidation below 110.20 is still on track, but I favor a break on the upside to initiate a rise towards 111.45.
| Resistance | Support | ||
| intraday | intraweek | intraday | intraweek |
| 110.20 | 111.45 | 109.60 | 106.70 |
| 111.45 | 112.20 | 109.10 | 104.60 |
GBP/USD
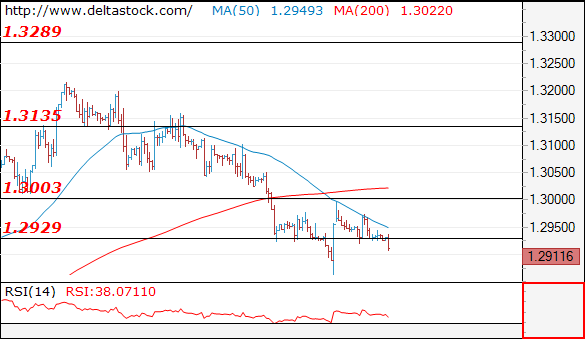
Current level - 1.2911
The slide below 1.3000 should be considered corrective, preceding a break towards 1.3135. Trigger on the upside is 1.2970.
| Resistance | Support | ||
| intraday | intraweek | intraday | intraweek |
| 1.2970 | 1.3290 | 1.2900 | 1.2800 |
| 1.3135 | 1.3480 | 1.2800 | 1.2610 |