Sample Category Title
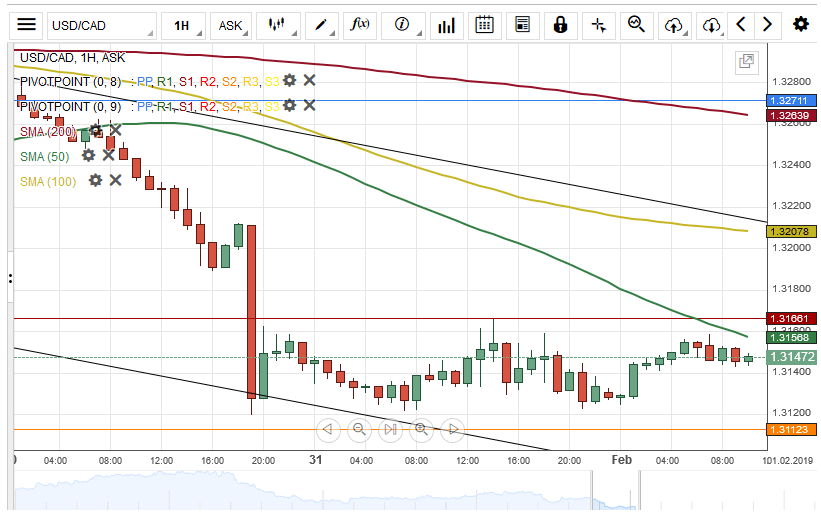
USD/CAD Moving Sideways
The US Dollar has been trading in a one-week descending channel pattern the Canadian Dollar. The exchange rate reversed from the lower boundary of the channel pattern at 1.3112 and started moving sideways.
By the middle of Friday's trading session, the 50-hour simple moving average and the monthly pivot point was providing resistance for the USD/CAD currency pair at 1.3161.
In case bears continue to show their presence in the market today, the currency exchange rate could break the one-week descending channel during the following trading session.
NZD/USD Targets At 0.6866
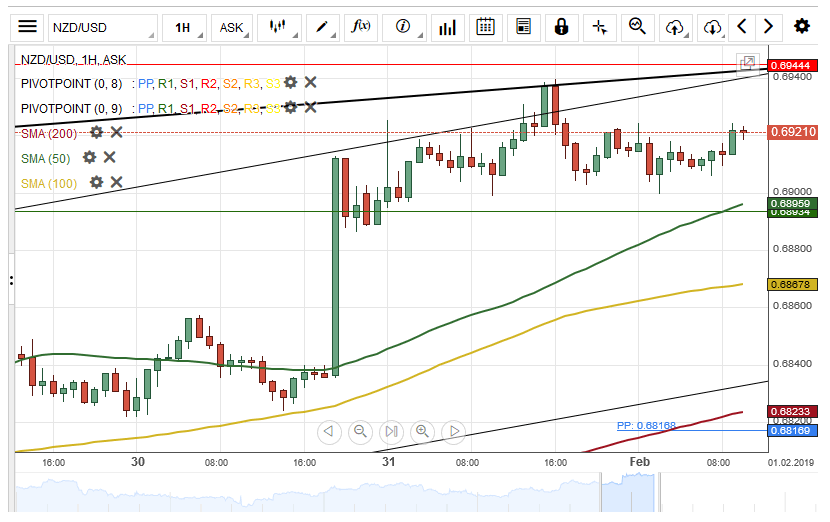
As expected, a resistance level formed by the upper boundary of an ascending channel pattern hindered the New Zealand Dollar to gain further strength against the US Dollar on Thursday.
Technical indicators demonstrate that the currency exchange rate will continue to edge higher during the following trading session.
However, it is likely that the NZD/USD exchange rate move towards a support level near the 100-hour simple moving average at the 0.6866 area within this trading session.
NZDUSD Advances To Fresh 7-Week Highs, Bullish But Almost Overbought
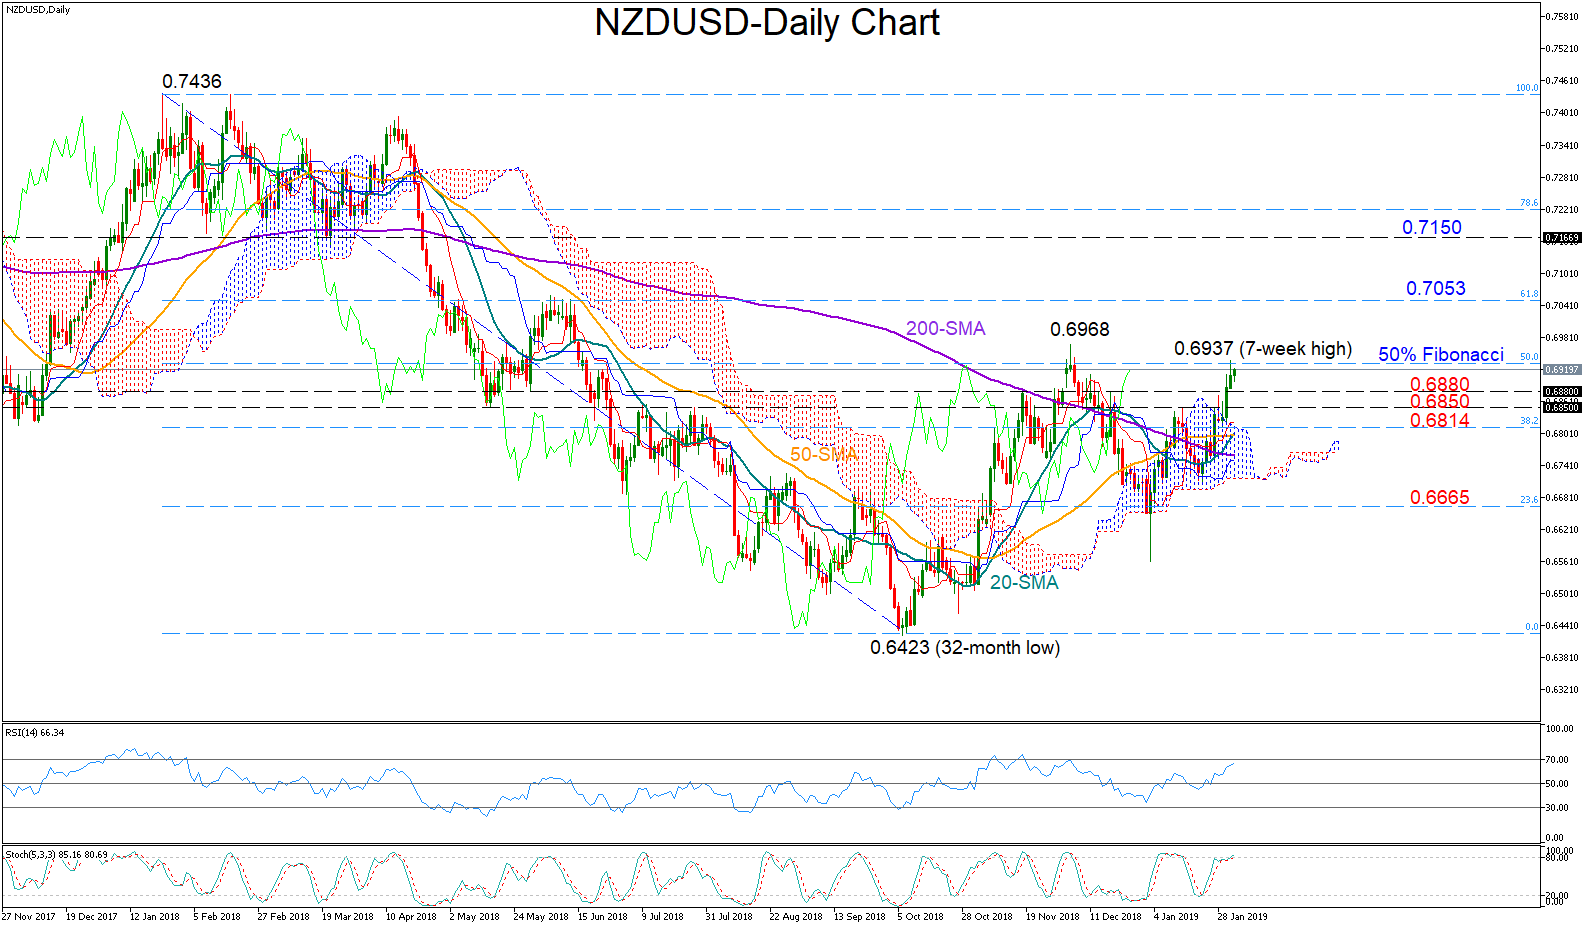
NZDUSD recorded three green days in row to reach a seven-week high of 0.6937 on Thursday. On Friday, the pair is trading slightly weaker, with the RSI indicating that room for improvement is limited as the indicator seems to be slowing down above 50 and slightly below the 70 overbought threshold. Stochastics are also set to enter the overbought territory above 80 but they have yet to register a clear bearish crossover, while the red Tenkan-sen line seems to be flattening above the blue Kijun-sen line.
On the upside, the bulls may retest yesterday’s peak of 0.6937 which overlaps with the 50% Fibonacci of the long downleg from 0.7436 to 0.6423. Breaching that level, the spotlight would turn to the 0.6968 top on December 4, where any decisive close higher could increase buying confidence, with the price probably flying up to the 61.8% Fibonacci of 0.7053.
On the flipside, a move southwards could pause somewhere between 0.6880-0.6850 before the 38.2% Fibonacci of 0.6814 comes into view. Further below, the 200-day simple moving average (MA) currently at 0.6758 would gather special attention as any step under that line could trigger steeper declines, shifting the focus towards the 23.6% Fibonacci of 0.6665. Another leg lower would possibly signal the sideways move has ended and therefore a downtrend is in progress.
In the medium-term picture, NZDUSD is in a neutral phase, trading within the 0.6968-0.6560 range. While the golden cross between the 50- and the 200-day MAs has increased optimism that a bull market could soon come back into play, investors would likely wait more improvement from the 50-day MA before increasing their buying orders.
The Analytical Overview Of The Main Currency Pairs
The EUR/USD currency pair
Technical indicators of the currency pair:
Prev Open: 1.14782
Open: 1.14461
% chg. over the last day: -0.29
Day's range: 1.14344 – 1.14510
52 wk range: 1.1214 – 1.2557
USD partically recovered from the Wednesday`s collapse but remains under pressure. Yesterday Federal Reserve decided not to increase the interest rates this year. The quotes are consolidating in the narrow range 1.14350-1.14500. The investors are waiting for the January labour market report in the US and expect worsened indicators. Keep an eye on the difference between the factual and the forecasted values of the indicators. You should open positions from the key levels.
The Economic News Feed for 01.02.2019:
Industrial PMI Report (GER) – 10:55 (GMT+2:00);
Preliminary Inflation Report (EU) – 12:00 (GMT+2:00);
Labour Market Report (US) – 15:30 (GMT+2:00);
ISM`s Industrial PMI Report (US) – 17:00 (GMT+2:00).
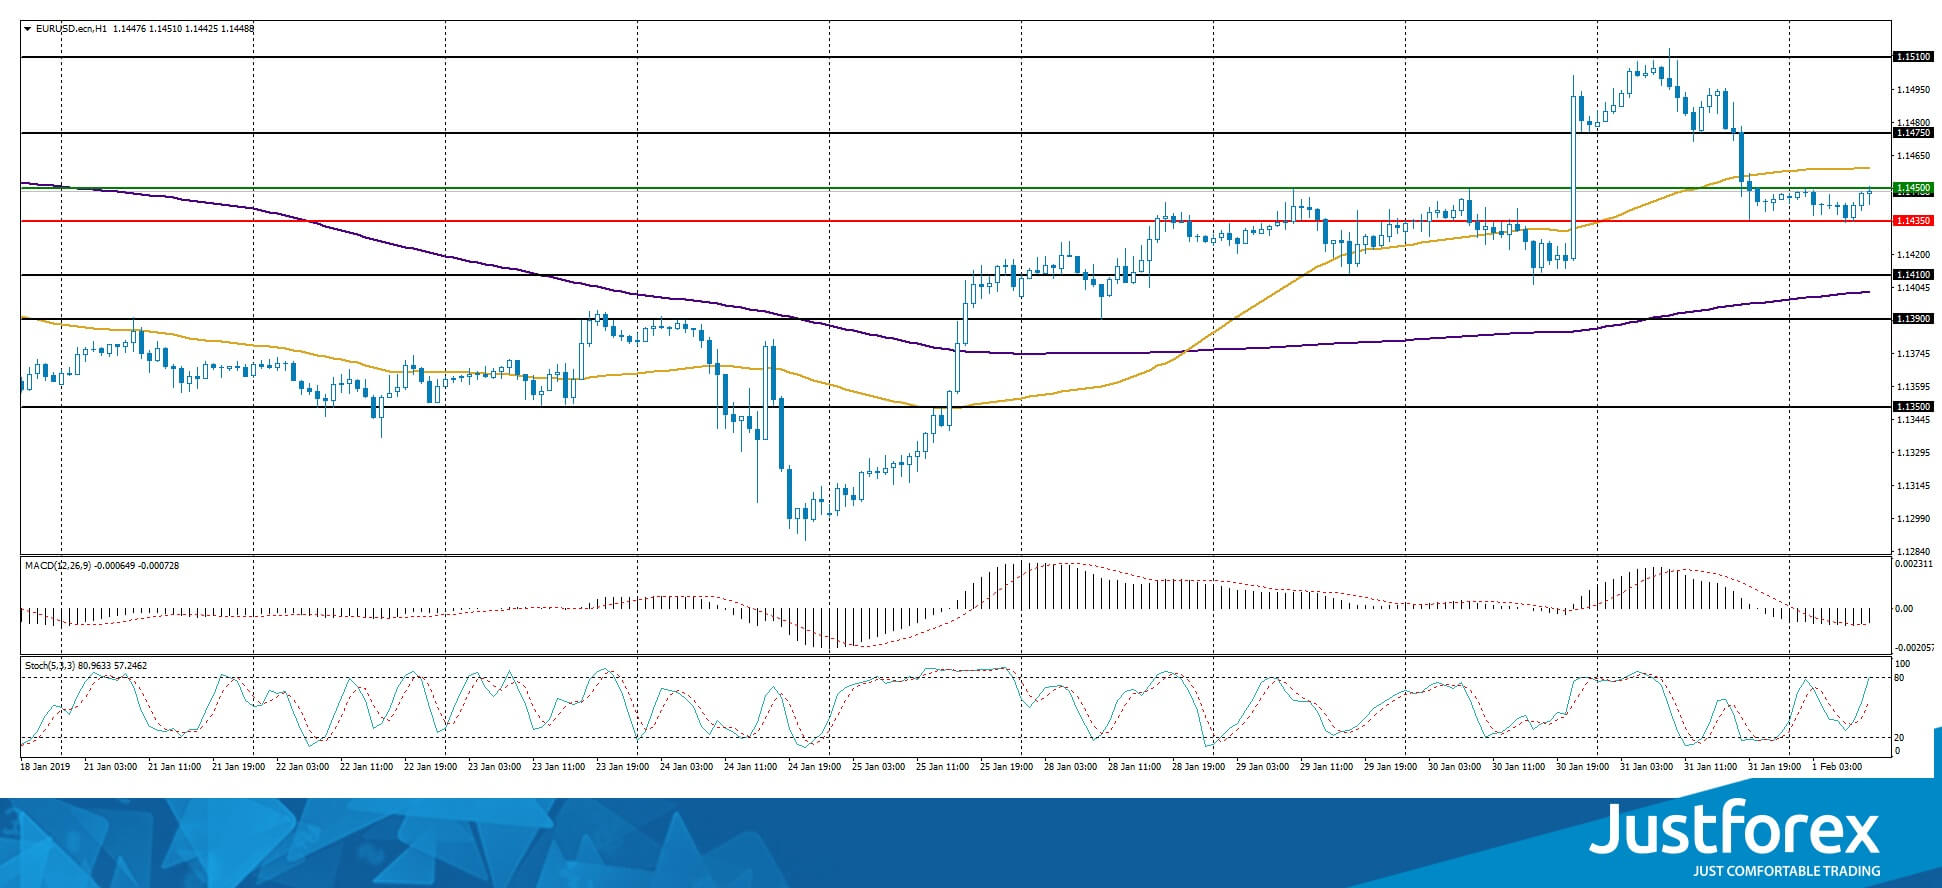
The indicators don't provide precise signals, the price fixed between 50 MA and 200 MA.
The MACD histogram is in the negative zone but above the signal line which gives a weak signal to sell EUR/USD.
The Stochastic Oscillator is in the neutral zone, the %K line is above the %D line which points to the growth of the EUR/USD quotes.
Trading recommendations
Support levels: 1.14350, 1.14100, 1.13900
Resistance levels: 1.14500, 1.14750, 1.15100
If the price fixes below 1.14350 expect the quotes to fall further toward 1.14000-1.13600.
Alternatively, expect them to rise toward 1.15000.
The GBP/USD currency pair
Technical indicators of the currency pair:
Prev Open: 1.31067
Open: 1.31010
% chg. over the last day: -0.05
Day's range: 1.30770 – 1.31148
52 wk range: 1.2438 – 1.4378
The pound remains in the long flat, the technical picture is ambiguous. The local support and resistance levels are 1.30900 and 1.31350. The Brexit conundrum is still in the spotlight. The financial market participants are going to review the US labour market report today, which is bound to affect GBP/USD. You should open positions from the key levels.
At 11:30 (GMT+2) the Great Britain will publish the PMI indexes.
Economic Event (GB) – 00:00 (GMT+2:00);
Economic Event (GB) – 00:00 (GMT+2:00);
Economic Event (GB) – 00:00 (GMT+2:00);
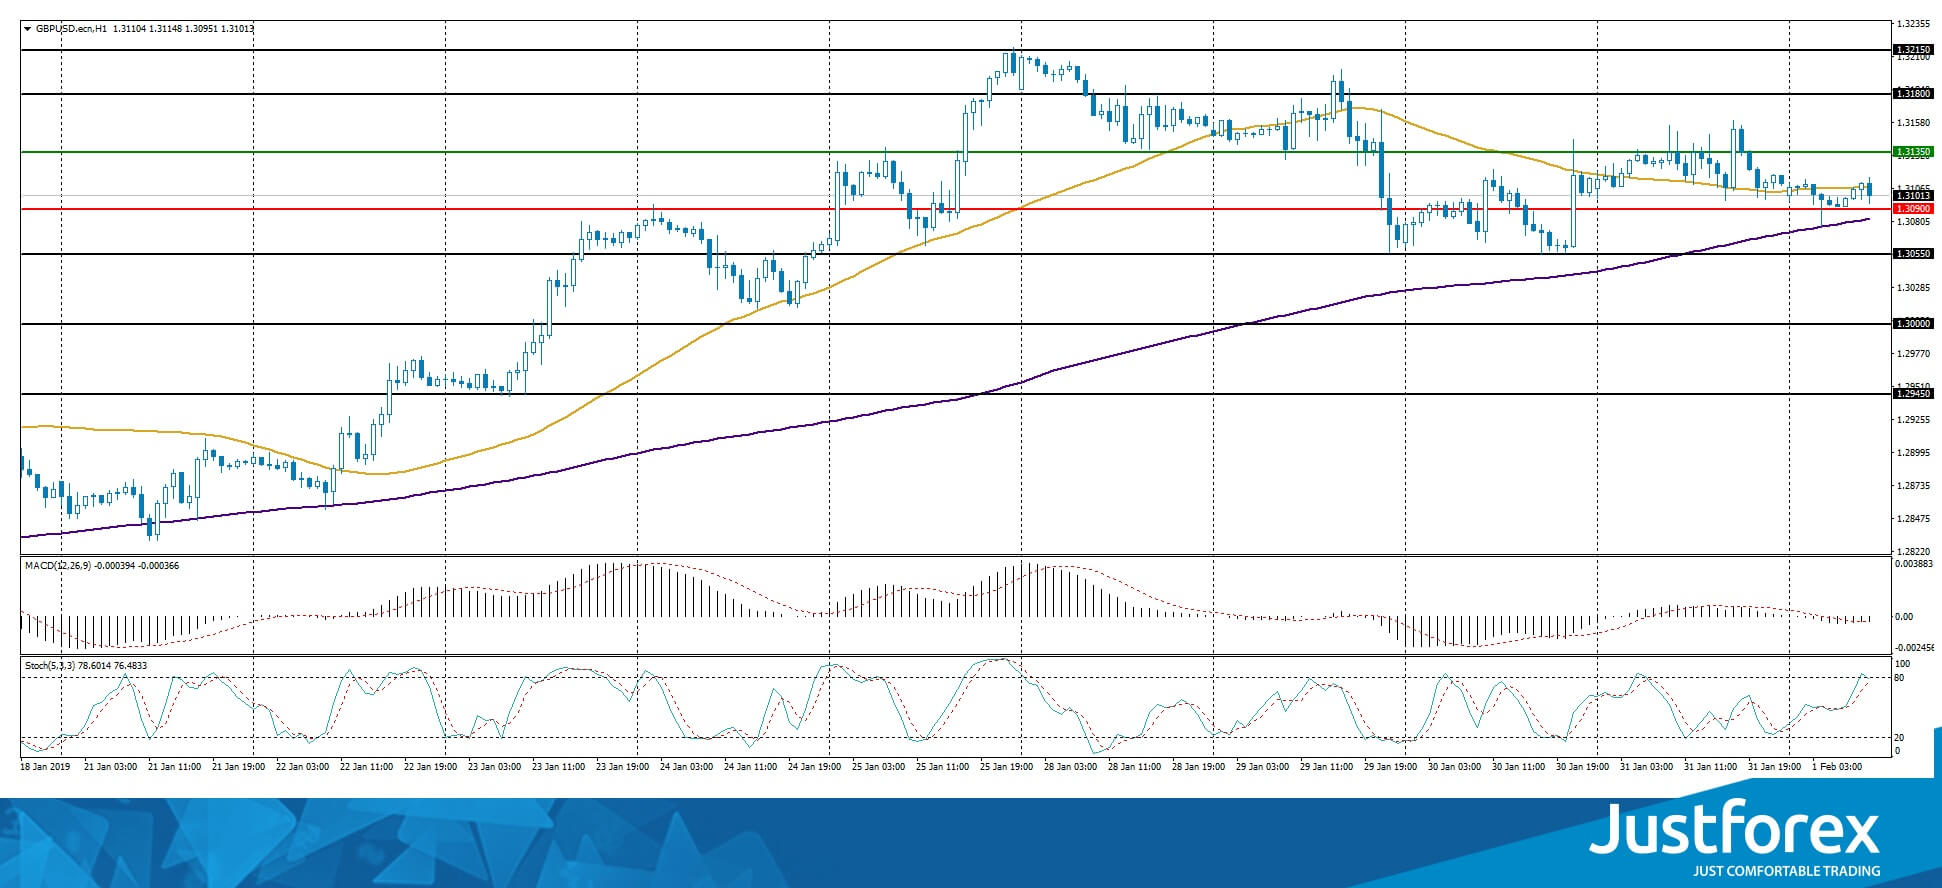
The indicators do not provide precise signals, the price has crossed 50 MA and 200 MA.
The MACD histogram is close to 0.
The Stochastic Oscillator is near the overbought zone, the %K line is crossing the %D line. There are no signals at the moment.
Trading recommendations
Support levels: 1.30900, 1.30550, 1.30000
Resistance levels: 1.31350, 1.31800, 1.32150
If the price fixes below 1.30900 consider selling GBP/USD. The movement will tend toward 1.30300-1.30000.
Alternatively the quotes can recover toward 1.31750-1.32000.
The USD/CAD currency pair
Technical indicators of the currency pair:
Prev Open: 1.31473
Open: 1.31213
% chg. over the last day: -0.19
Day's range: 1.31204 – 1.31573
52 wk range: 1.2248 – 1.3664
Right now the CAD is consolidating after a long fall. The USD/CAD quotes are testing the 1.31200-1.31550 key range and can descend further. The US Labour Market report is in the spotlight. Keep an eye on the oil quotes dynamics and open positions from the key levels.
The Economic News Feed for 01.02.2019 is calm.
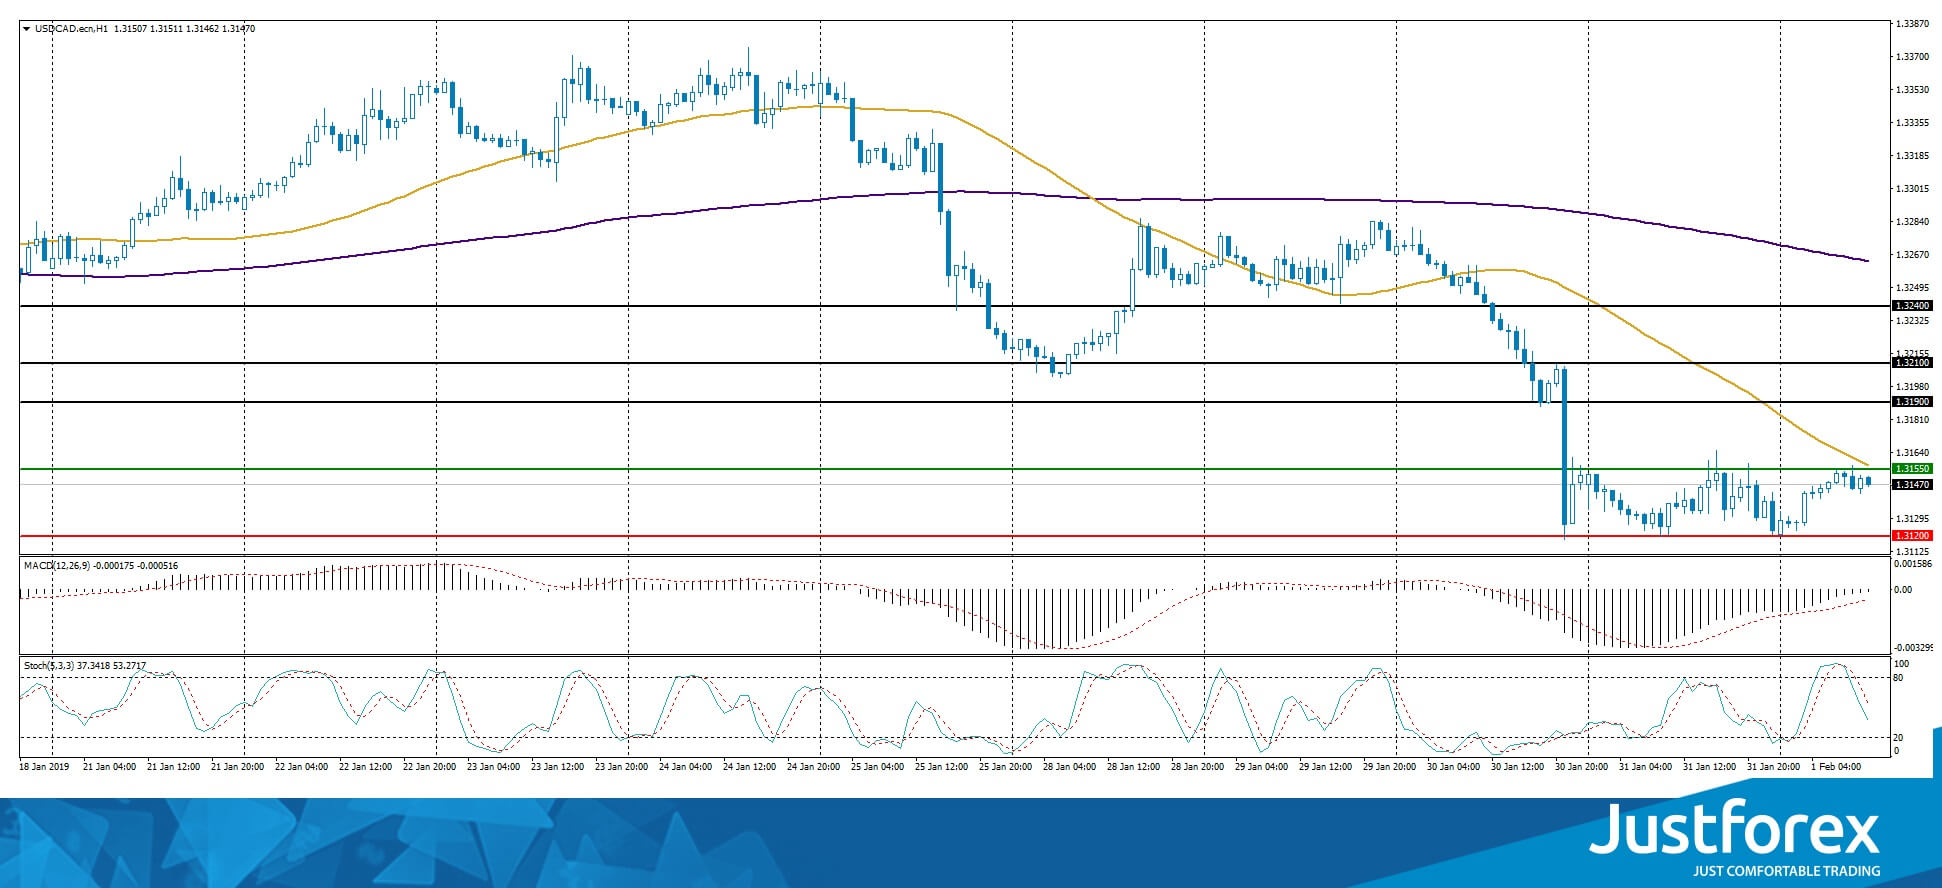
The indicators do not provide precise signals, the price is close the 50 MA which acts as a strong dynamic resistance.
The MACD histogram is close to 0.
The Stochastic Oscillator is in the neutral zone, the %K line is below the %D line which points to the further descend of the USD/CAD quotes.
Trading recommendations
Support levels: 1.31200, 1.30750
Resistance levels: 1.31550, 1.31900, 1.32100
If the price fixes below 1.31200, expect the quotes to fall further toward 1.30700-1.30500.
Alternatively. the quotes can correct toward 1.13800-1.32000.
The USD/JPY currency pair
Technical indicators of the currency pair:
Prev Open: 109.035
Open: 108.859
% chg. over the last day: -0.17
Day's range: 108.725 – 108.969
52 wk range: 104.56 – 114.56
USD/JPY is stabilizing after a long fall. Right now the yen is consolidating. The quotes are testing the local support and resistance levels of 108.750 and 109.000. We expect reports from the US. Open positions from the key levels.
The Economic News Feed for 01.02.2019 is calm.
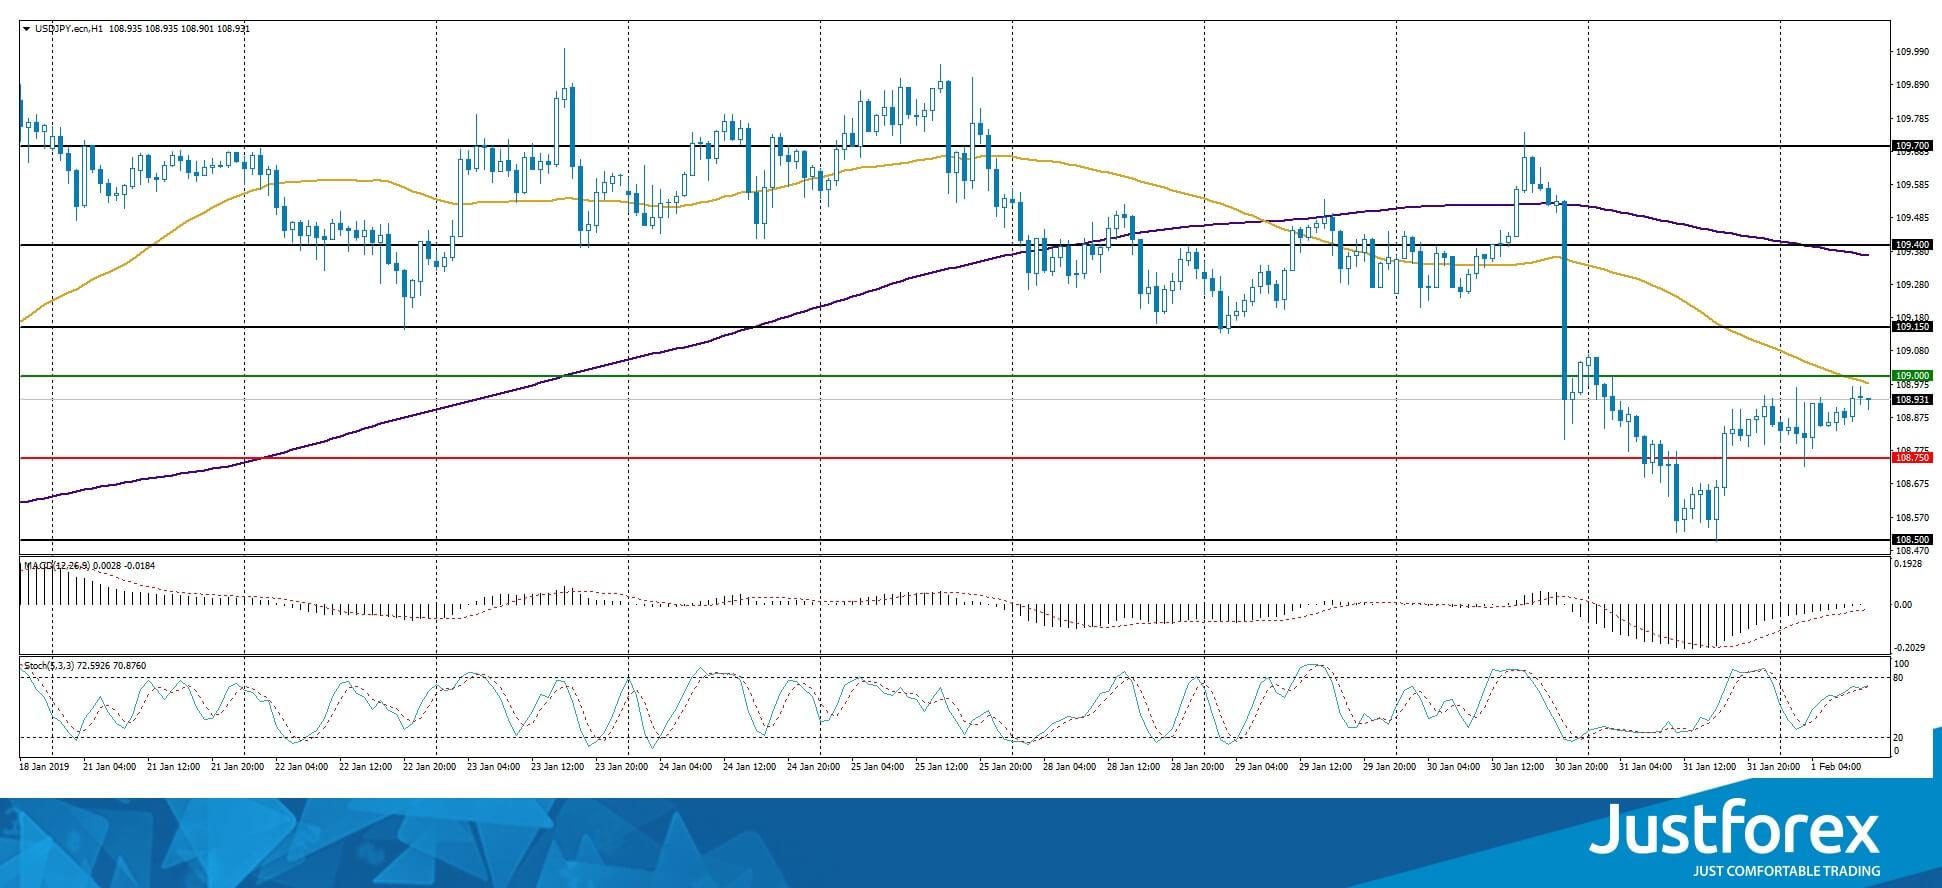
The indicators do not provide signals, the price is testing 50 MA.
The MACD histogram is close to 0.
The Stochastic Oscillator is in the neutral zone, the %K line is crossing the %D line. There are no signals at the moment.
Trading recommendations
Support levels: 108.750, 108.500
Resistance levels: 109.000, 109.150, 109.400
If the price fixes below 108.750 expect the quotes to fall further toward 108.400-108.200.
Alternatively, the quotes can grow toward 109.300-109.500.
Market Focus On US Employment Report
Market focus today is expected to be on the release of the US employment report for January, with its NFP figure. Should the unemployment rate (3.9%) and the average earning s growth rate (+3.2% yoy) remain unchanged as forecasted, the spotlights will be on the NFP figure which is expected to drop to 165k, if compared to December’s 312k. As December’s figure is one of the highest in the past three years, it leaves the January NFP figure with little room for any advancement. Should the actual NFP figure indicate a higher reading in jobs created than the one expected, the market could perceive the readings as bullish for the USD as it could support the notion of the US labor market remaining tight. Should the NFP figure suffer a wider drop than expected though, due for example to the negative effect of the US shutdown, we could see the USD weakening. As analysed in yesterday’s report, EUR/USD dropped heavily yesterday, breaking the 1.1495 (R2) and the 1.1460 (R1) support lines (now turned to resistance). We see the case to continue to trade in a bearish market, as weak European financial data are expected to continue to reel in. However we expect the release of the US employment report for January to be a make or break point for the pair as under certain circumstances it could reverse the pair’s bearish direction. Should the pair continue to be under the market’s selling interest, we could see it breaking the 1.1425 (S1) support line and aim for the 1.1385 (S2). Should on the other hand the pair find extensive buying orders along its path, we could see it breaking the 1.1460 (R1) resistance line and aim for the 1.1495 (R2) resistance barrier.
Aussie weakens against USD on poor Chinese data
The Aussie weakened during today’s Asian session against the USD, after the Caixin Mfg PMI dropped to one of its lowest readings for three years. The contraction marked, have caused worries about a global slowdown to re-emerge, which could have also wider implications to other currencies. Never the less the broader risk sentiment remained rather stable, as per analysts, as US president Trump said on Thursday that he would meet with Chinese President Xi Jinping soon to try a seal a deal. Analysts point out that should a US-Sino trade deal be struck, we could see the risk sentiment getting a boost, causing the USD to weaken, at least temporarily. AUD/USD dropped during today’s Asian session, reversing the bullish direction of the past two days, testing the 0.7230 (S1) support line. We maintain a bearish outlook for the pair, yet the pair’s direction could be reversed from any positive headlines about the US-Sino trade relationships and the US employment report. Should the bears continue to dictate the pair’s direction, we could see the pair breaking the 0.7230 (S1) support line and aim for the 0.7150 (S2) support barrier. Should on the other hand the pair come under the bull’s influence, we could see it breaking the 0.7330 (R1) resistance line, aiming for higher grounds.
Today’s other economic highlights
In today’s European session, we get Germany’s final Mfg PMI for January, UK’s Mfg PMI for January and Eurozone’s preliminary CPI rate for January. In the American session (13:30,GMT) we get the US employment report for January as mentioned above and the US ISM Mfg PMI as well as final reading of the Michigan consumer sentiment, both for January. Last but not least in the Americans session, we get the Baker Hughes active oil rig count figure.
AUD/USD H4
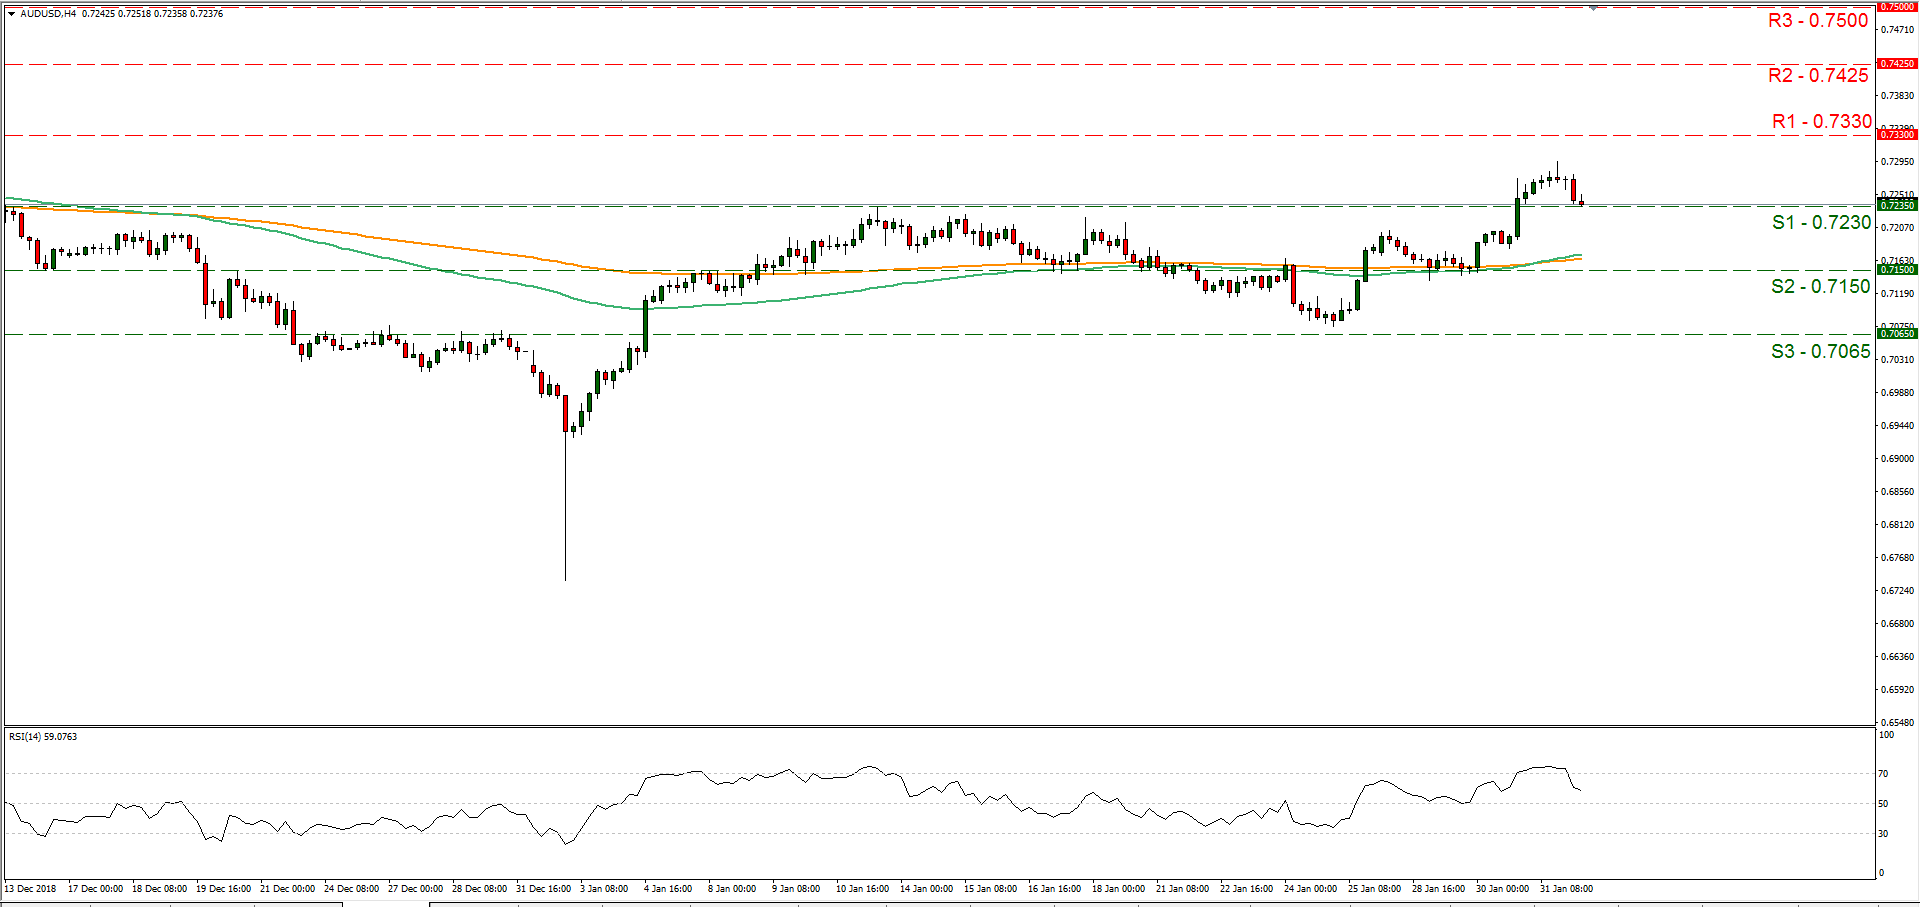
Support: 0.7230 (S1), 0.7150 (S2), 0.7065 (S3)
Resistance: 0.7330 (R1), 0.7425 (R2), 0.7500 (R3)
EUR/USD H4
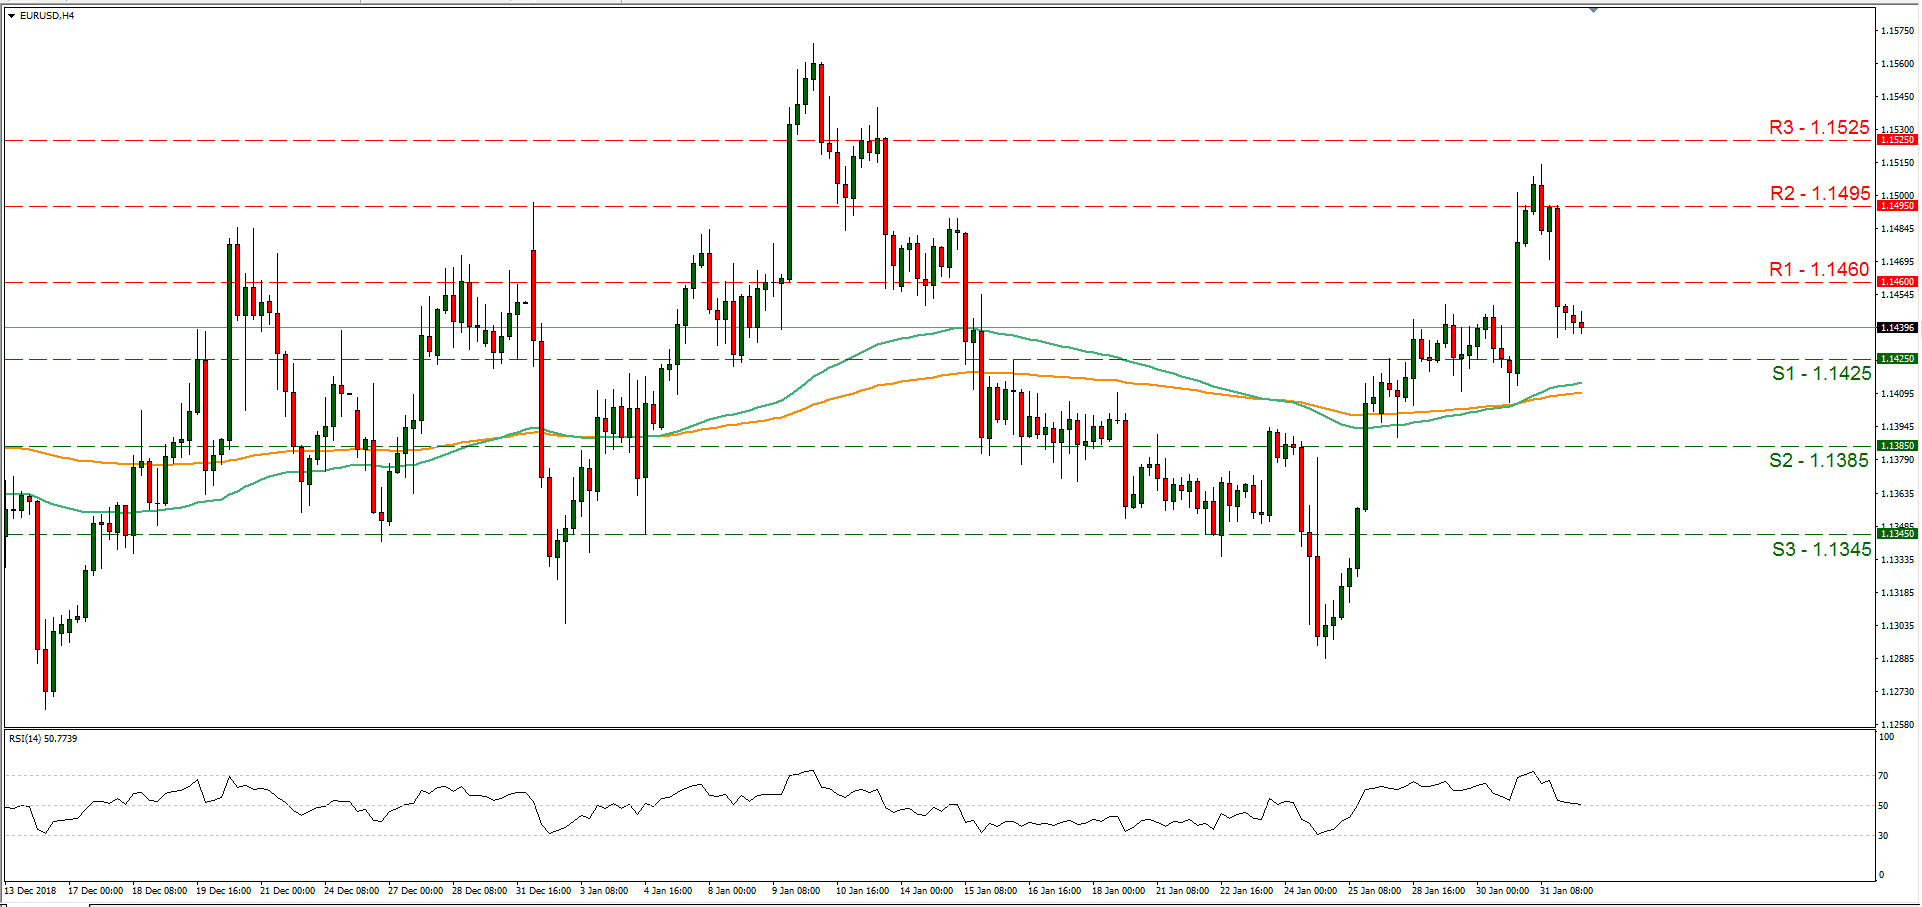
Support: 1.1425 (S1), 1.1385 (S2), 1.1345 (S3)
Resistance: 1.1460 (R1), 1.1495 (R2), 1.1525 (R3)
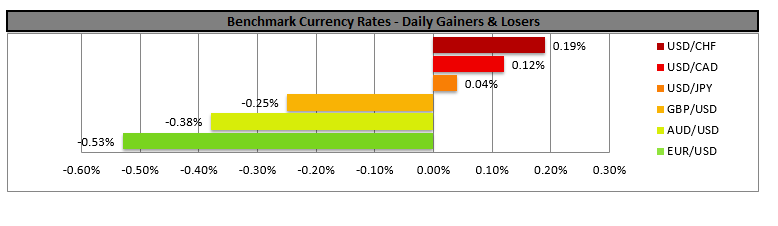
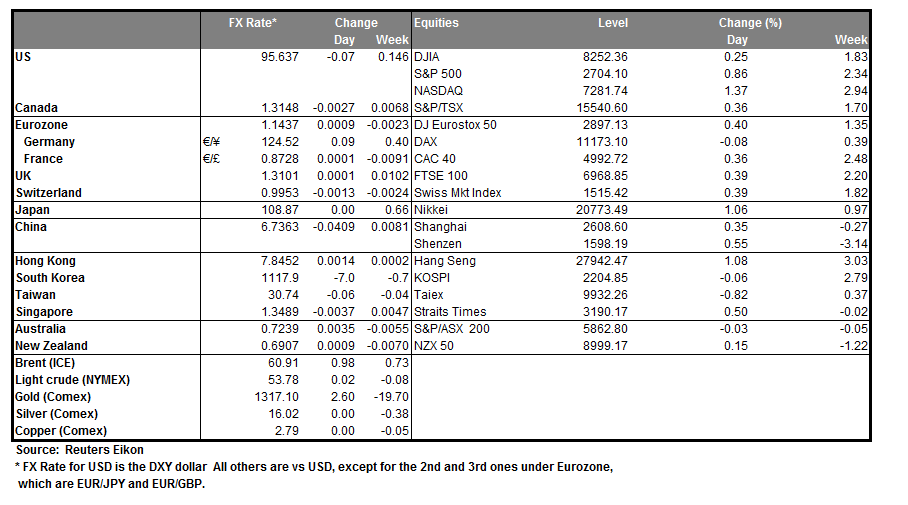
EUR/USD Outlook: Narrow Consolidation After Thursday’s Fall Looks For Fresh Signal From US Jobs Data
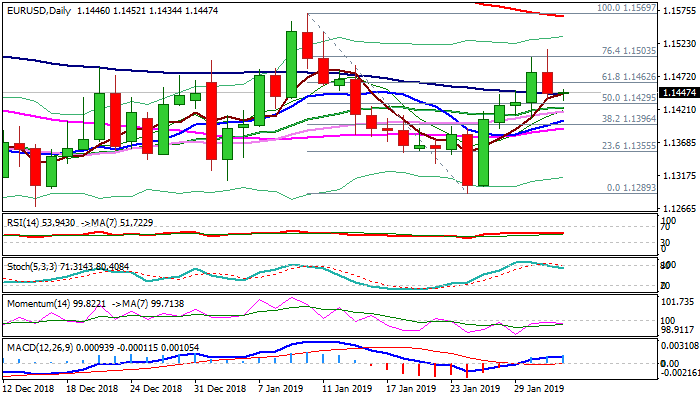
The Euro is consolidating above broken former strong resistance, now support at 1.1429 (daily Kijun-sen / broken Fibo 50% of 1.1569/1.1289 / Fibo 38.2% of 1.1289/1.1514) in early Friday's trading after strong five-day rally was strongly rejected at 1.15 zone and Thursday's action ended in bearish daily candle with long upper shadow, signaling that bulls might be running out of steam.
Slow stochastic emerged from overbought territory and momentum remains weak, adding to negative signals for further easing.
Daily cloud is thinning and twists next week and could also attract fresh near-term bears.
Breach of 1.1429 pivot would risk extension towards key supports at 1.1384 (cloud twist) and 1.1375 (Fibo 61.8% of 1.1289/1.1514), loss of which would confirm reversal.
Ability to hold above 1.1429 would keep in play hopes for fresh upside, with eventual weekly close above 20WMA (1.1436) which capped weekly actions since mid-Sep, needed to reinforce positive signal.
Also, US jobs data, due later today, are expected to generate fresh signals.
Non-farm payrolls are forecasted to dip significantly in Jan (165K f/c vs 312K in Dec), impacted by partial US government shutdown in Jan.
Disappointing US labor data would increase pressure on the greenback, which was already hit by dovish stance from Fed and could boost the single currency to emerge from dangerous territory.
Res: 1.1436, 1.1461, 1.1514, 1.1540
Sup: 1.1429, 1.1400, 1.1384, 1.1375
UK PMI manufacturing dropped to 52.8, stocks up on Brexit preparations
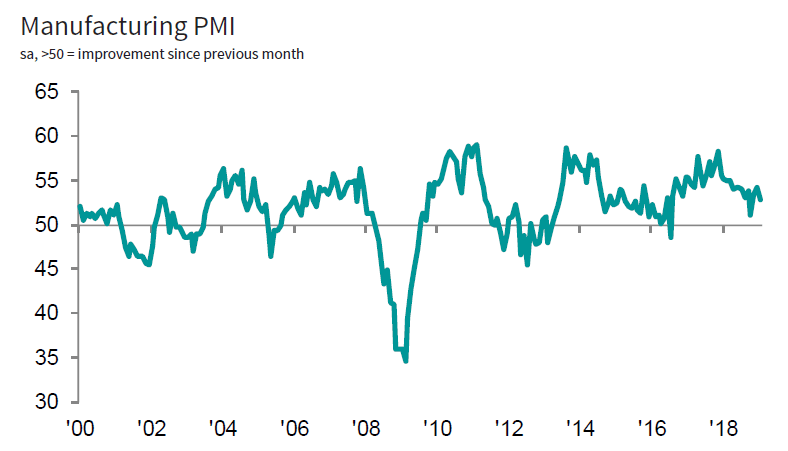
UK PMI manufacturing dropped to 52.8 in January, down from 54.2 and missed expectation of 53.5. That's also a 3-month low. Markit noted that "stocks of purchases rise at survey-record rate". And, "employment falls for only the second time in past 30 months".
Rob Dobson, Director at IHS Markit, which compiles the survey:
"The start of 2019 saw UK manufacturers continue their preparations for Brexit. Stocks of inputs increased at the sharpest pace in the 27-year history, as buying activity was stepped up to mitigate against potential supply-chain disruptions in coming months. There were also signs that inventories of finished goods were being bolstered to ensure warehouses are well stocked to meet ongoing contractual obligations.
"Despite the temporary boost provided by clients' prepurchases and efforts to build-up stocks, the underlying trends in output and new orders remained lacklustre at best. Growth of new order inflows slowed sharply, and new export orders were near-stagnant, contributing to the weakest trend in output since the month following the EU referendum (July 2016). Based on its historical relationship against official data, the January survey is consistent with a further solid contraction of production volumes, meaning manufacturing will likely act as a drag on the economy in the first quarter.
"January also saw manufacturing jobs being cut for only the second time since mid-2016 as confidence about the outlook slipped to a 30-month low, often reflecting ongoing concerns about Brexit and signs of a European economic slowdown. With neither of these headwinds likely to abate in the near-term, there is a clear risk of manufacturing sliding into recession."
Ireland: UK needs a purpose for Article 50 extension
Ireland's Europe Minister Helen McEntee said today that UK's Article 50 extension, if sought, will need to have a purpose. She said "If they were to ask for an extension I think it would be approved ... but there is no point in looking for an extension if we end up back to the same place as we are now in three months' time".
Austrian Foreign Minister Karin Kneissl now said "there are lots of signs that indicate a hard Brexit." And, she added "that is my estimation".
Eurozone PMI manufacturing finalized at 50.5, adds to likelihood of recession
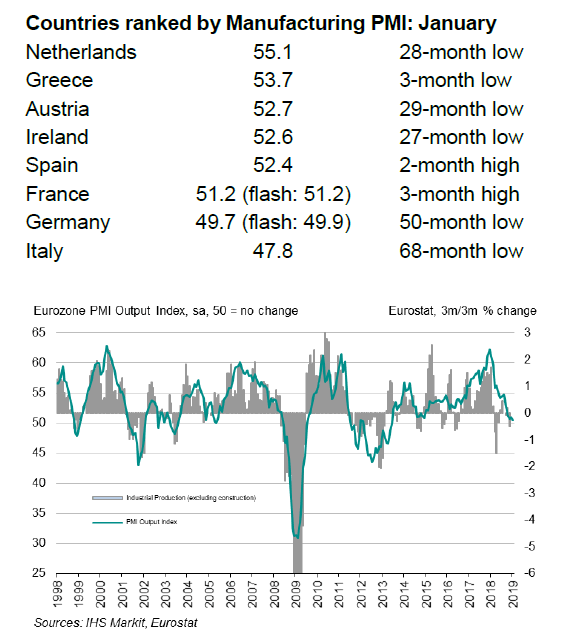
Eurozone PMI manufacturing was finalized at 50.5 in January, unrevised, down from December's 51.4. It's the six consecutive months of decline and the lowest level since November 2014. Markit noted that "output up marginally, but sharpest fall in new work recorded since April 2013". Also, "growth sustained via reduction in backlogs and fastest accumulation of stocks in survey history".
Among the countries, Italy PMI manufacturing hit 47.8, a 68-month low. Germany reading was also in contraction at 49.7, a 50-month low. Franc reading recovered mildly to 3-month high of 51.2. But Ireland reading hit 27-month low, Austria reading hit 29-month low and the Netherlands reading hit 28-month low.
Commenting on the final Manufacturing PMI data, Chris Williamson, Chief Business Economist at IHS Markit said:
"The January PMI adds to the likelihood that the manufacturing sector is in recession and will act as a drag on the economy in the first quarter.
"Some temporary factors remain evident, including an auto sector that is struggling to regain momentum after new emissions regulation and some signs of 'yellow vest' disturbances dampening demand in France. However, there appears to be a more deep-rooted malaise setting in, which reflects widespread concerns about the destabilising effect of political uncertainty and the damage to exports from rising trade protectionism.
"Worryingly, weaker than anticipated sales mean warehouses are filling up with unsold stock at a rate not previously recorded over the two decades of prior survey history, suggesting firms will need to cut operating capacity in coming months unless demand revives, boding ill for future production growth.
"While there is some evidence that firms are hoarding labour in the hope of sales picking up again, and business optimism did perk up from December's six-year low, jobs growth is starting to deteriorate as increasing numbers of firms seek to cut costs and raise productivity. Any such downturn in the labour market will in turn potentially drive consumer sentiment lower, and adds further to the risk that economic growth will continue to slow in coming months."
Forex Technical Analysis: EUR/USD, USD/JPY, GBP/USD
EUR/USD
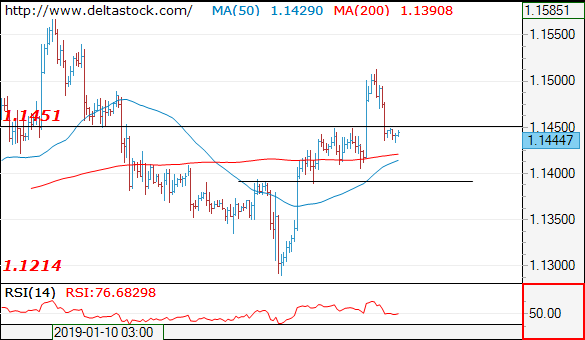
Current level - 1.1447
Intraday, I expect 1.1470 minor resistance to initiate a slide for 1.1390 support.
| Resistance | Support | ||
| intraday | intraweek | intraday | intraweek |
| 1.1570 | 1.1630 | 1.1450 | 1.1214 |
| 1.1630 | 1.1820 | 1.1390 | 1.1100 |
USD/JPY
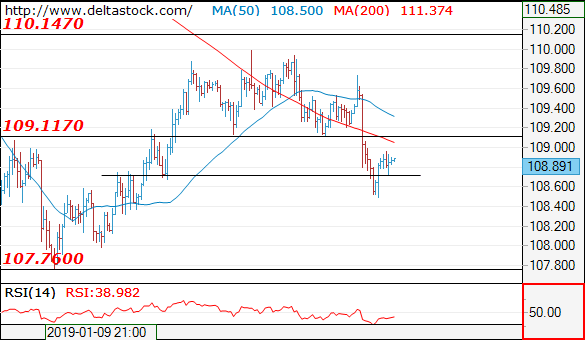
Current level - 108.89
The resistance at 109.10 should cap the upside, for the next leg downwards, to 107.70. Crucial on the upside is 109.75 high.
| Resistance | Support | ||
| intraday | intraweek | intraday | intraweek |
| 109.10 | 111.45 | 108.70 | 106.70 |
| 110.20 | 112.20 | 107.70 | 104.60 |
GBP/USD
Current level - 1.3099
I still favor a dip to 1.3000 area and while the whole pattern below 1.3210 remains corrective, the outlook on the senior frames will be positive, for a rise towards 1.3290.
| Resistance | Support | ||
| intraday | intraweek | intraday | intraweek |
| 1.3135 | 1.3290 | 1.3000 | 1.3000 |
| 1.3290 | 1.3480 | 1.2930 | 1.2800 |