Sample Category Title
AUD/USD Outlook: Aussie Eases As Weak Chinese Data Hurt The Sentiment, NFP In Focus For Fresh Signals
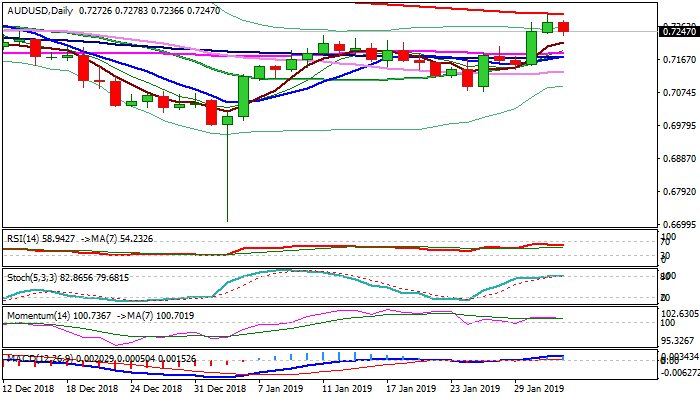
The Aussie dollar stands at the back foot in early Friday's trading and eases from two-month high at 0.7295, posted after strong bullish acceleration on Wed/Thu on dovish Fed. Weaker than expected China's Manufacturing PMI (Jan 48.3 vs 49.5 f/c) added to negative near-term tone after bulls were capped by 200SMA on Thursday. Deeper pullback cannot be ruled out as daily RSI and momentum turn south and slow stochastic is overbought, but overall picture remains bullish and suggests limited correction for now. A cluster of converged MA's (10/20/55/100) at 0.7183/77 zone marks solid support which is expected to contain extended dips and keep bulls in play. Focus turns towards key event today, US jobs data (Jan NFP 165K f/c vs 312K previous month/AHE Jan 0.3% f/c vs 0.4$ Dec) which are expected to generate fresh signals.
Res: 0.7278, 0.7295, 0.7355, 0.7393
Sup: 0.7231, 0.7205, 0.7177, 0.7133
GBP/JPY Daily Outlook
Daily Pivots: (S1) 142.24; (P) 142.72; (R1) 143.20; More...
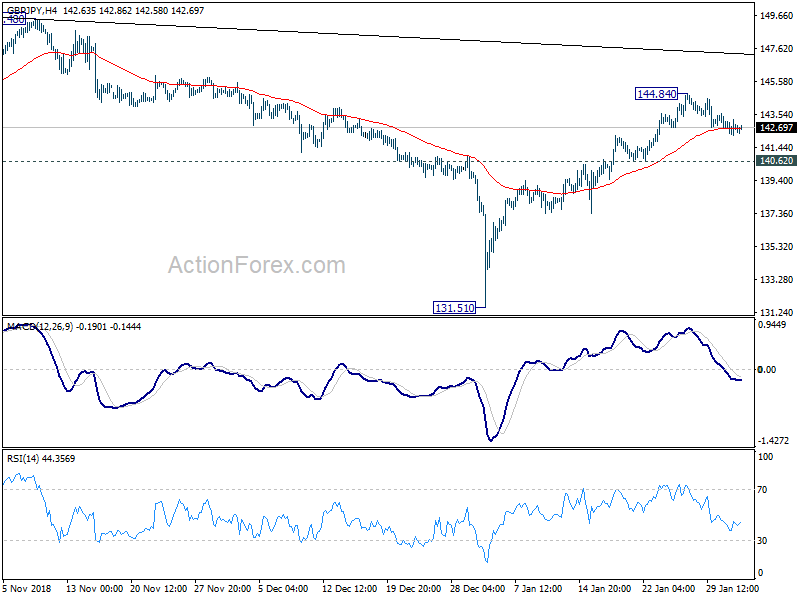
GBP/JPY is staying in consolidation from 144.84 temporary top and intraday bias remains neutral first. Further rise is still expected as long as 140.62 support holds. Above 144.84 will extend the rebound from 131.51 to trendline resistance at around 147.35. We'd expect strong resistance from there to limit upside at first attempt. On the downside, firm break of 140.62 will suggest completion of the rebound and turn bias to the downside.
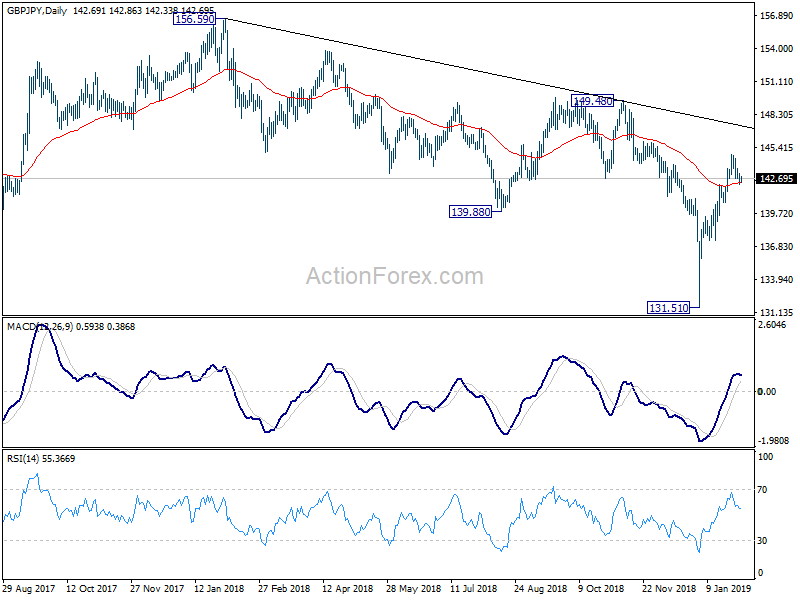
In the bigger picture, the strong rebound from 131.51 suggests that medium term fall from 156.59 (2018 high) has completed already. The corrective structure of such decline is turn argues that it's the second leg of the corrective pattern from 122.36 (2016 low). And this pattern is starting the third leg. On the upside, decisive break of 149.38 will pave the way to 156.59 resistance and above.
US NFP Is Here, Are You Ready?
The Strongest Index
There is no doubt that the global equity markets have a stellar start of the year. No matter where you look, you see solid gains. Just to put things in perspective, the S&P500 index has had the January since 1989. It is up whopping 7.87% year-to-date. Similarly, the NASDAQ index is up 9.74% and the Dow Jones index is up nearly 7.17%. But the index which is up the most among all of them is Istanbul index, up over 14% mainly due to the stable political landscape after years of instability. The sectors which have performed the best are communication services, consumer discretionary, energy and financials.
US NFP Day Is Here
Today is the day when everyone will be looking at the most important piece of economic data: the US Non-Farm-Payroll number. Without any doubt, it is the most important economic number of the month and it sets the tone for trading for the rest of the month. The forecast for the headline number, the Non-Farm employment change is 165K while the previous reading was at 312K. The average hourly earnings number is expected to soften a little. The forecast for this is 0.3% versus the previous reading of 0.4%. The US ADP number usually sets the tone for the US NFP number and the reading for January shows that the labour market is still immensely robust in the midst of the US government shutdown. If today’s number confirms the same statement, I think it is likely that market will see that as a positive sign, but at the same time, it will be balanced by the fact, the good news is actually not good, because the Fed could change its stance towards the monetary policy.
Bulls Will Come Back With Vengence, But Not Yet
If anyone is happy by the current Fed stance, it is the dollar index bear group, they have been beaten down badly since June 2018 and it is only now they the price dollar index price has broken out of the upward channel for the first time. I think the trend for the next two quarters is going to be the very same because the Fed is no rush in changing their stance, and every single month, they are going to continue their same mantra. Of course, the word which matters the most for markets or for the bulls is “Patient” and the moment this word disappears from the Fed comments, I think the bulls would come back with vengeance.

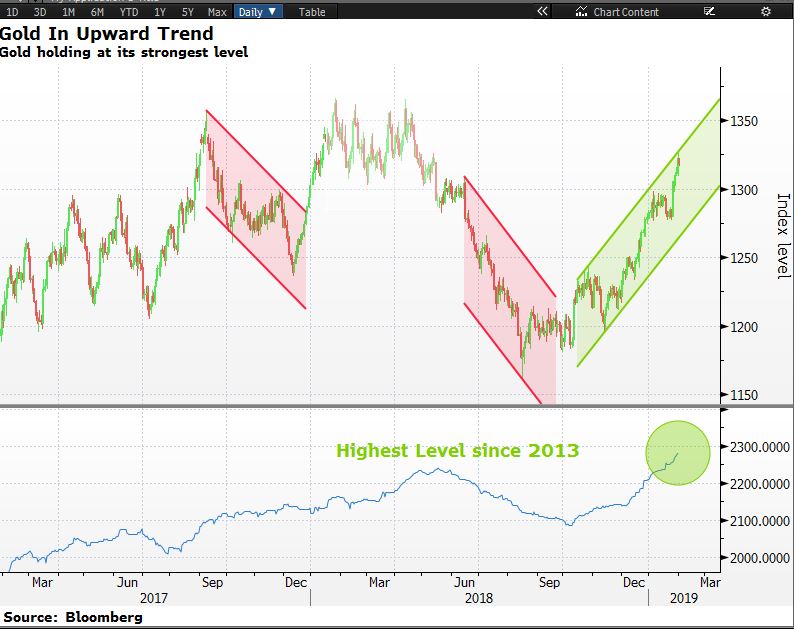
Gold Holdings At Highest Level Since 2013
Ostensibly, any weakness in the dollar index is good news for the gold bulls. Having said this, the dollar and the gold index are not strongly correlated as one can see it by comparing the two charts. But, the fact is that there is a correlation between the two and the gold price is literally on the tear because of the strong momentum behind it. Even if one looks at the gold holdings, shown in the lower panel of the chart below, they have surged to the highest level since 2013. This confirms that this moemtum is here to stay and it is backed by acutal demand.
EUR/JPY Daily Outlook
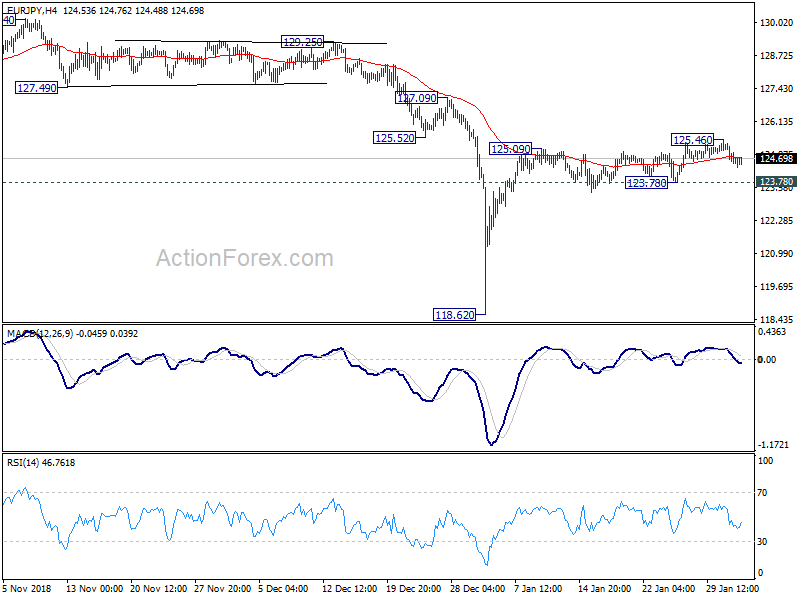
Daily Pivots: (S1) 124.30; (P) 124.80; (R1) 125.12; More....
Intraday bias in EUR/JPY is turned neutral with the current retreat. At this point, further rise is still expected with 123.78 support intact. Break of 125.46 will target 55 day EMA (now at 126.20). Though, break of 123.78 will indicate completion of the rebound and turn bias back to the downside.
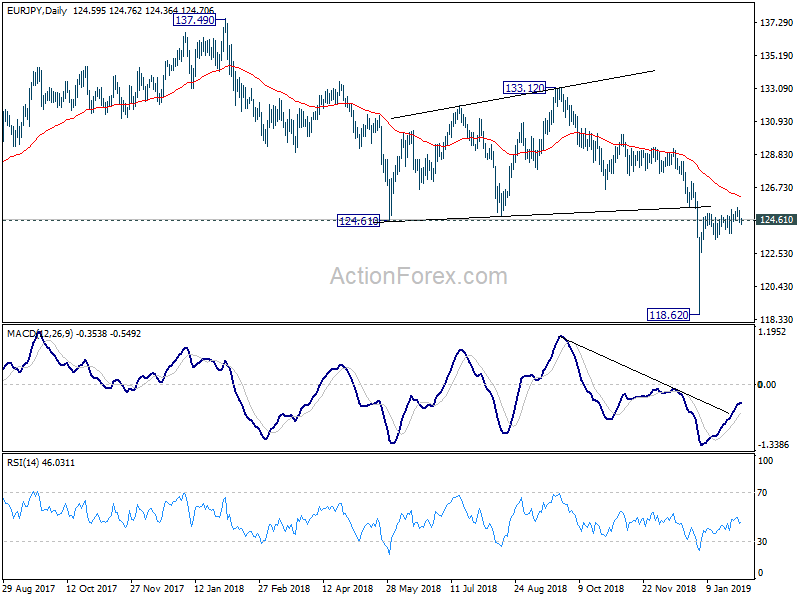
In the bigger picture, medium term rebound from 109.03 (2016 low) has completed at 137.49 already, with corrective structure. Fall from 137.39 is possibly just the second leg of the corrective pattern from 109.03. Break of 133.12 resistance should start the third leg to 137.49 and above. Nevertheless, break of 118.62 will resume the decline from 137.49 for 109.03/114.84 support zone instead.
Dollar Looks To Payrolls, Euro Halted In Its Tracks
- The US employment report takes center stage today; dollar may be at risk
- Euro turns lower as Italy enters recession, Weidmann strikes dovish tone
- US stocks advance amid “progress” in trade talks
Dollar rebounds, turns its sights to US employment data
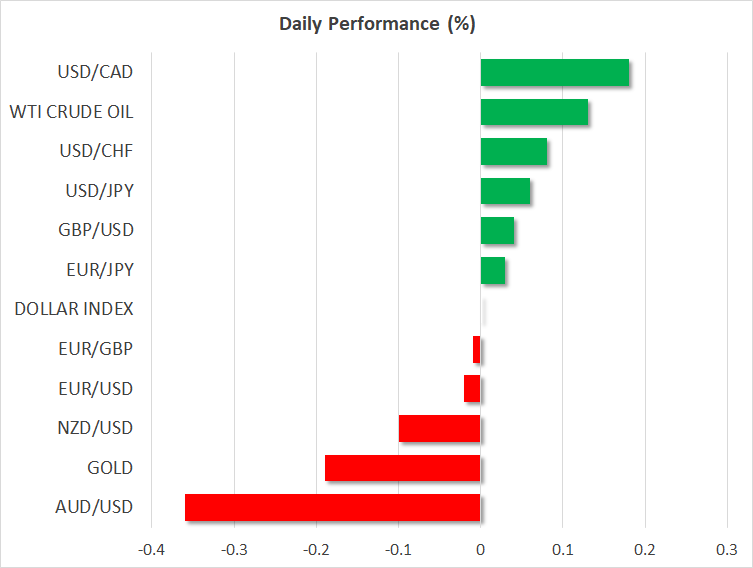
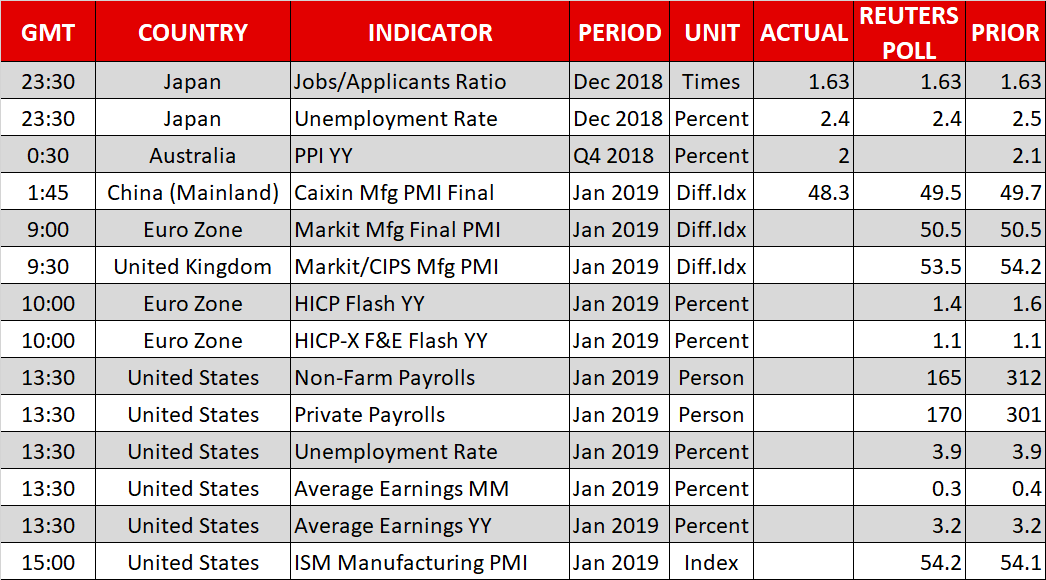
The dollar shaked off some of its post-FOMC weakness against a basket of six major currencies, mainly because the euro retreated (see below). There was little in terms of US catalysts, but that changes today, as the all-important jobs report for January will hit the markets. Nonfarm payrolls are forecast to have risen by 165k, less than the extraordinary 312k in December, but still a solid number overall. The unemployment rate is expected to have held steady at 3.9%, while wages are anticipated to have risen at the same pace as previously, by 3.2% in yearly terms.
This was the month the government was partially shut, so there may be some “noise” in these data. For instance, it wouldn’t be surprising to see an uptick in the unemployment rate, as those workers were reportedly counted as temporarily unemployed. In any case, attention will likely fall mainly on wages, as the FOMC made it clear that a material pickup in price pressures is required for further hikes. Traders, meanwhile, view the next move by the Fed as most likely to be a rate cut, with money markets pointing to a 20% probability for such an action by December. As for the dollar, risks seem asymmetrically tilted to the downside, as any weakness in this report would serve to augment rate-cut expectations, whereas it’s doubtful that even a strong positive surprise would be enough to turn this dovish sentiment around.
The ISM manufacturing PMI for January is also due out.
Italy enters recession as ECB hawks turn cautious, euro reels
Italy’s economy shrank for a second consecutive quarter at the close of 2018, marking a technical recession for the Eurozone’s third largest economy. This was, at least partially, the outcome of tanking business confidence amid the government’s standoff with the EU over budget rules. The news took the winds out of the euro’s sails, causing the single currency – which until that moment was enjoying gains against the bleeding dollar – to reverse course and close the day lower.
Some cautious remarks by the influential President of the German central bank, Jens Weidmann, contributed too. Breaking from his traditionally-confident tone, he highlighted that growth in the bloc’s powerhouse will be notably weaker than potential, and appeared in no hurry to normalize policy. When hawks like Weidmann start to backpedal on their usual rhetoric, it’s a strong sign that other ‘centrist’ policymakers are probably more worried than they are letting on. Today, we’ll get the bloc’s flash inflation data for January, and in light of these concerns, any surprises will dictate the euro’s path.
Signs of tentative progress in trade talks lift stocks
American and Chinese negotiators heralded substantial progress in the trade negotiations that concluded yesterday, though without providing too many details on what remains to be settled. Trump noted that President Xi and himself would meet soon to iron out the “more difficult points”. Secretary Mnuchin and chief negotiator Lighthizer said they’ll travel to China soon to hold another round of talks. Markets interpreted these as signals that the process is moving forward and that both sides remain keen to strike a deal, with the likes of the S&P 500 (+0.88%) posting decent gains.
Other highlights: UK manufacturing PMI, earnings, and Fed-speak
Besides the US employment report and Eurozone’s latest inflation figures, the other highlight on the calendar today will be the UK manufacturing PMI for January.
In equities, notable names releasing their earnings results include energy giants Exxon Mobil and Chevron.
There’s only one speaker on the agenda: Dallas Fed President Robert Kaplan (14:45 GMT).
EUR/GBP Daily Outlook
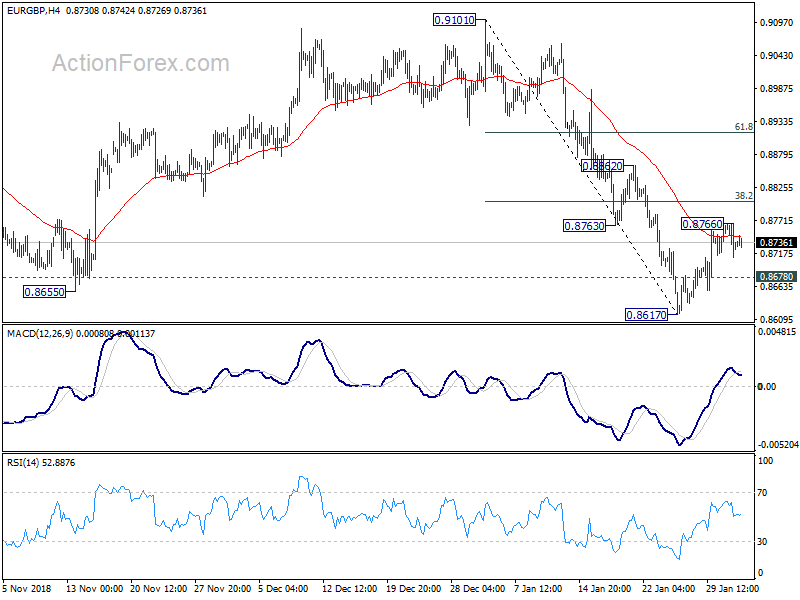
Daily Pivots: (S1) 0.8705; (P) 0.8738; (R1) 0.8765; More...
EUR/GBP formed a temporary top at 0.8766 and retreated. Intraday bias is turned neutral first. Another rise is mildly in favor with 0.8678 minor support intact. On the upside, break of 0.8766 will target 38.2% retracement of 0.9101 to 0.8617 at 0.8802. Break will target 61.8% retracement at 0.8916. On the downside, however, break of 0.8678 minor support will turn bias back to the downside for 0.8620 key support. Decisive break of 0.8620 will resume larger decline from 0.9305 and target 100% projection of 0.9305 to 0.8620 from 0.9101 at 0.8416.
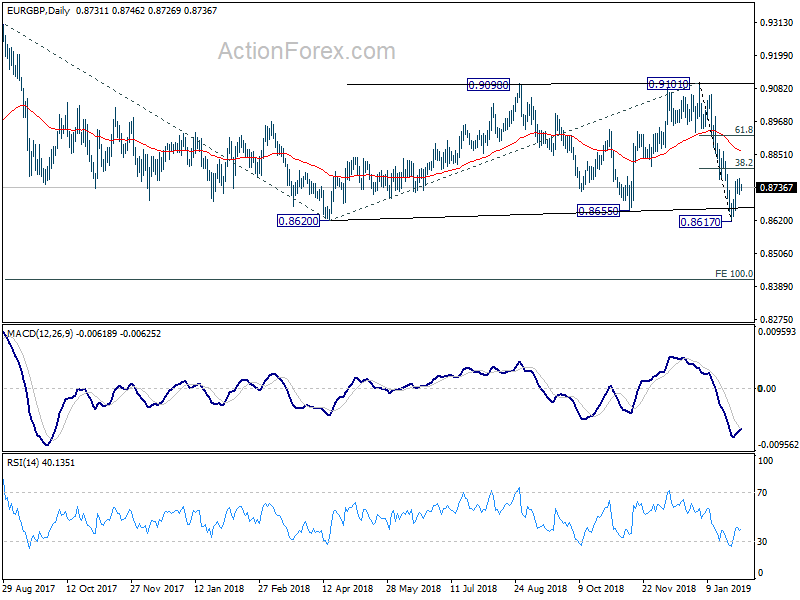
In the bigger picture, EUR/GBP is seen as staying in long term range pattern started at 0.9304 (2016 high). The medium term range is set between 0.8620 and 0.9101. Downside breakout of 0.8620 will pave the way back to 0.8312 support . Break of 0.9101 will bring retest of 0.9304/5 resistance.
GBPAUD Rebounds On 20-Day SMA, Erases Bearish Rally In Near Term
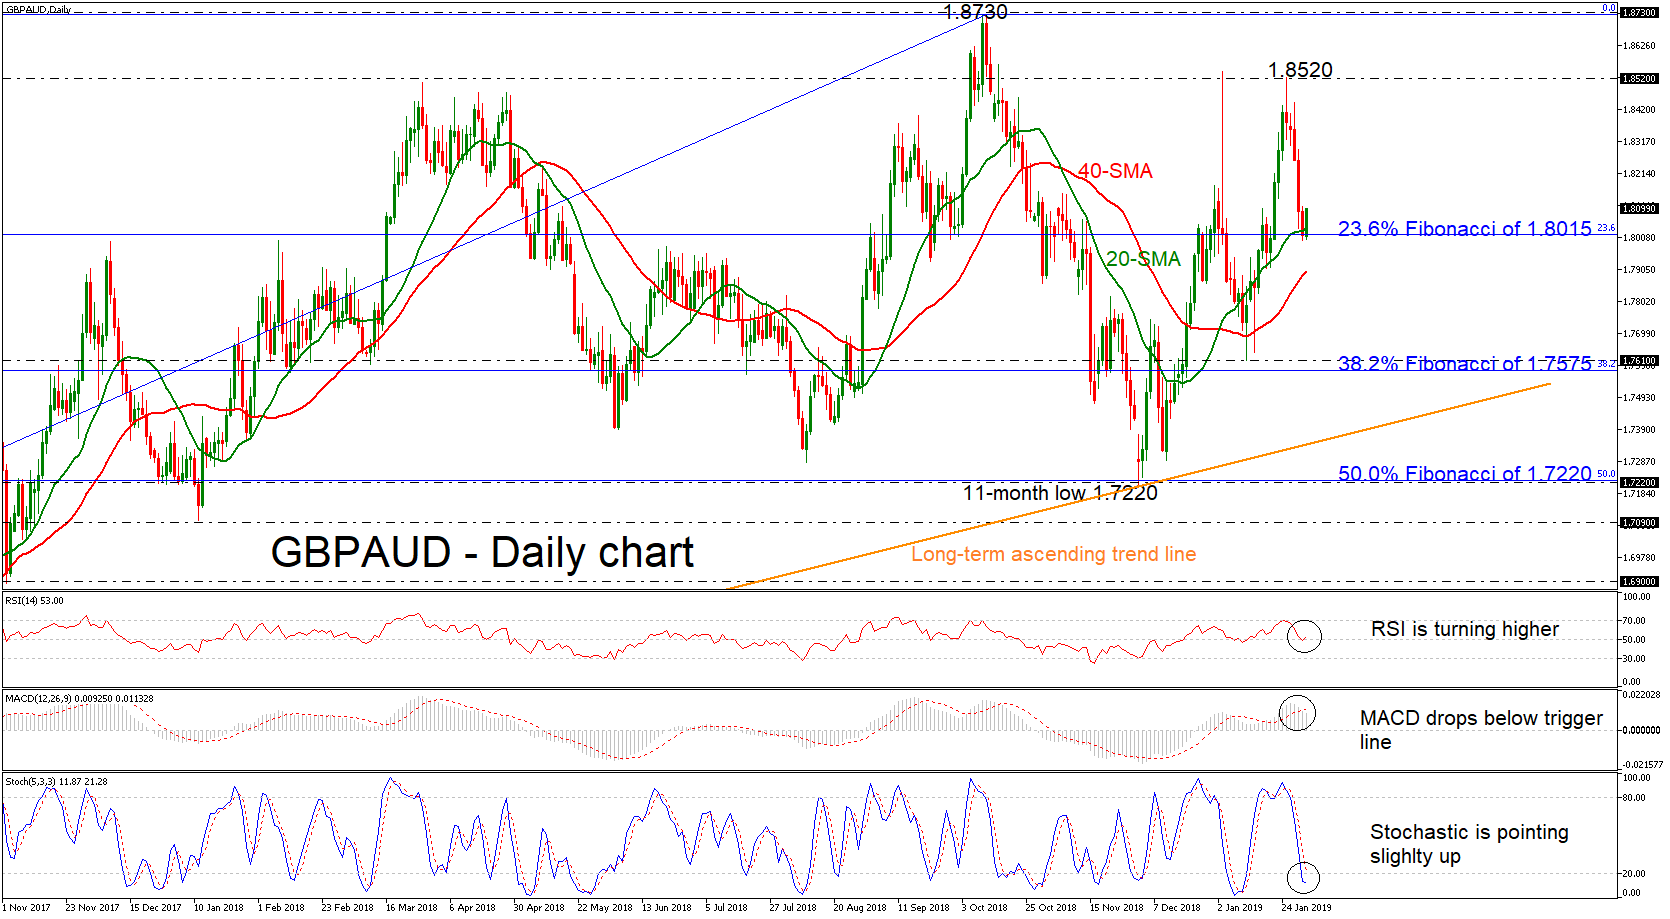
GBPAUD has rebounded somewhat on the 20-day simple moving average (SMA) and on the 23.6% Fibonacci retracement level of the upward movement from 1.5725 to 1.8730 around 1.8015. The price is ready to snap the five consecutive red days from the 1.8520 resistance, driving the price higher again.
From the technical point of view, the MACD oscillator now suggests that the market sentiment might get worse before getting better, however, the RSI is reversing back to the upside after the pullback on its 50-neutral threshold. The stochastic also looks to be changing direction, moving up in the oversold territory.
Should the price edge higher, the 1.8520 level which the bulls were unable to break in the previous week could provide resistance. Moving higher, the focus will shift to the more than two-year high of 1.8730 restrictive area, while more advances would push the pair to create a higher high in the medium term.
However, in case of a downward movement below the 23.6% Fibonacci mark the market could find support near the 40-SMA currently at 1.7900. If there is a successful penetration below this line, the next supports would come from 1.7610 and the 38.2% Fibonacci of 1.7575. In case of a significant rally lower the price could challenge the ascending trend line around 1.7450.
Overall, GBPAUD has been trading within an upside rally since October 2016, creating higher highs and higher lows during this period.
EUR/AUD Daily Outlook
Daily Pivots: (S1) 1.5681; (P) 1.5775; (R1) 1.5828; More....
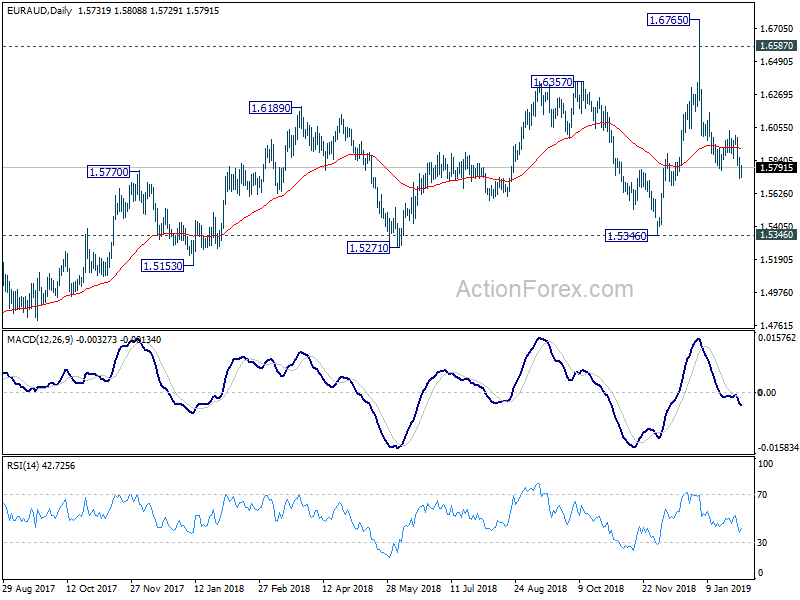
EUR/AUD's break of 1.5774 suggests fall from 1.6765 has resumed. Intraday bias is turned to the downside for 1.5346 key support. On the upside, break of 1.6038 resistance is needed to indicate completion of the decline. Otherwise, further fall is still expected even in case of recovery.
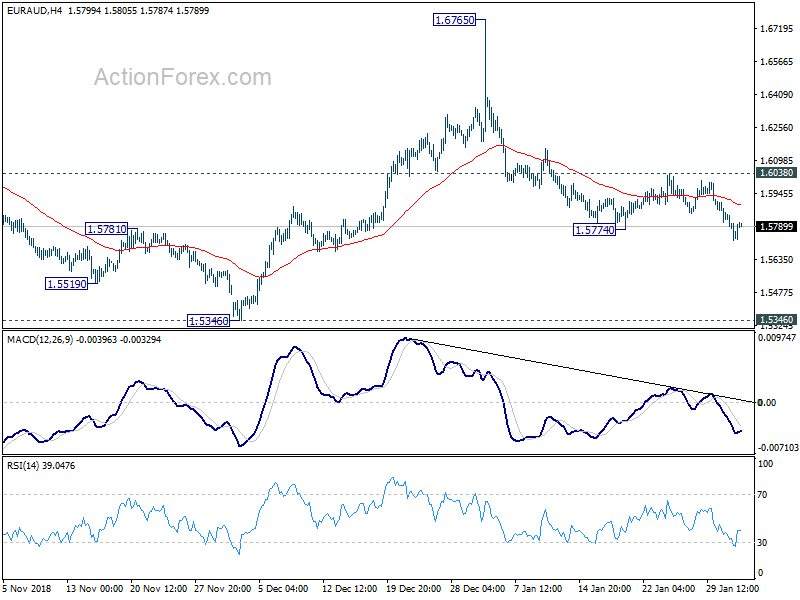
In the bigger picture, the failure to sustain above 1.6587 key resistance (2015 high) argues that up trend from 1.1602 (2012 low) is not ready to resume yet. But still, as long as 1.5346 support holds, outlook will remain bullish. Break of 1.6765 will target 61.8% retracement of 2.1127 (2008 high) to 1.1602 at 1.7488 next. However, firm break of 1.5346 key support will indicate trend reversal, with bearish divergence condition in weekly MACD, and turn outlook bearish.
EUR/CHF Daily Outlook
Daily Pivots: (S1) 1.1361; (P) 1.1395; (R1) 1.1417; More...
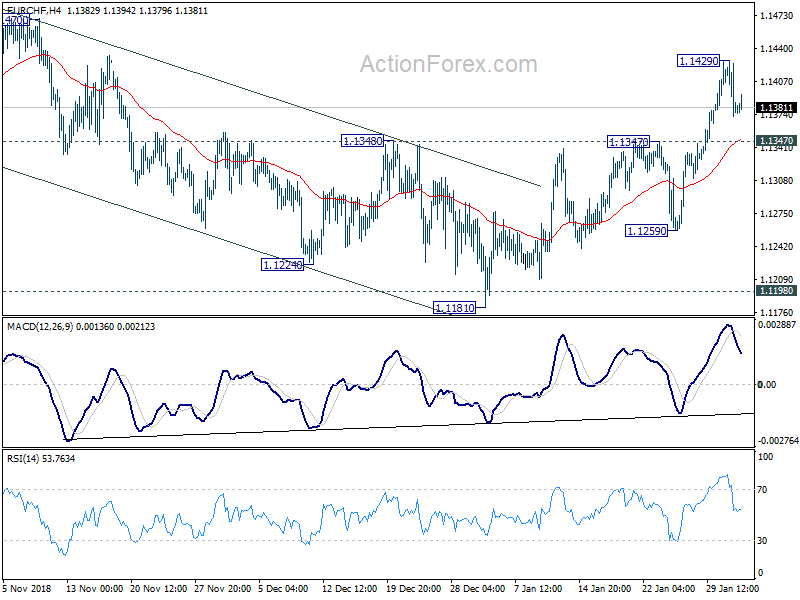
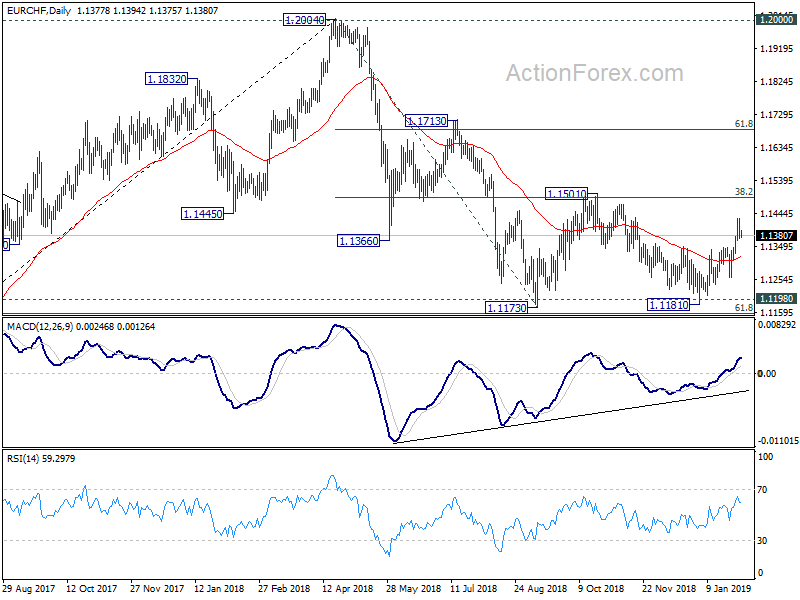
Intraday bias in EUR/CHF is turned neutral with the current retreat and some consolidations could be seen. But further rise is expected as long as 1.1347 resistance turned support holds. On the upside, break of 1.1429 will resume the rise from 1.1181 to 1.1501 key resistance. However, break of 1.1347 will argue that such rebound might be finished. Intraday bias will then be turned back to the downside for 1.1259 support instead.
In the bigger picture, price actions from 1.2004 medium term top is seen as a correction only. Downside should be contained by support zone of 1.1198 (2016 high) and 61.8% retracement of 1.0629 to 1.2004 at 1.1154 to complete it and bring rebound. A break of 1.2 key resistance is still expected in the medium term long term. However, sustained break of the mentioned support zone will mark reversal of the long term trend. In that case, 1.0629 key support will be back into focus.
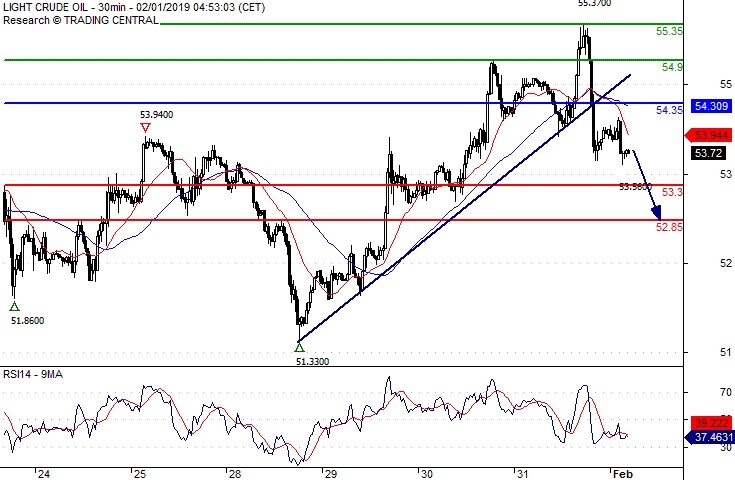
Crude Oil Under Pressure
Pivot (invalidation): 54.35
Our preference Short positions below 54.35 with targets at 53.30 & 52.85 in extension.
Alternative scenario Above 54.35 look for further upside with 54.90 & 55.35 as targets.
Comment The RSI is bearish and calls for further decline.