Sample Category Title
U.S. January Employment Unexpectedly Rises
Highlights:
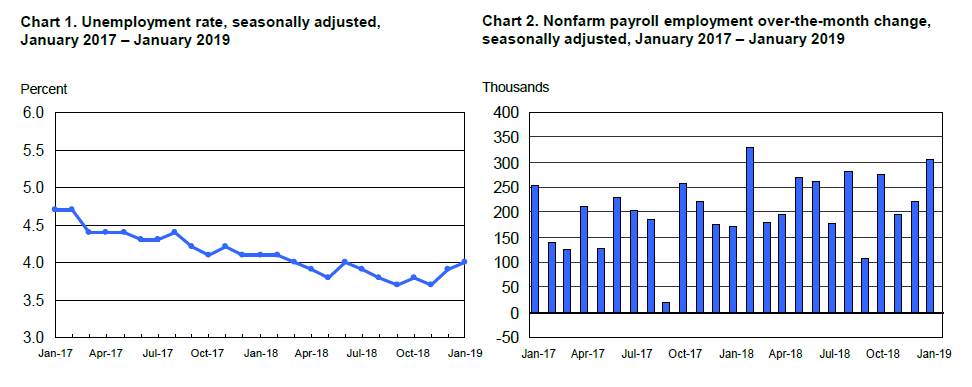
- January payroll employment rose a stronger-than-expected 304K following a 22k gain in December.
- The unemployment rate rose to 4.0% from 3.9% though the increase reflected the transitory impact of the government shutdown.
Our Take:
January payroll employment growth unexpectedly accelerated to a robust 304k which was almost double the 165k expected going into the report. The solid gain in payrolls will likely temper rising market expectations of the Fed remaining on hold indefinitely. These expectations emerged following statements coming out of this week’s FOMC meeting implying less urgency, if not the absence of any necessity, to tighten further. However, with the economy at capacity, the pace of hiring needs to drop to a pace consistent with new entrants coming into the labour market that is around one-half of the gain reported for January. The persistence of robust hiring implies an economy going even further into excess demand with a rising risk that the upward trend in wage gains will start to move into inflationary territory. To ensure that this risk does not materialize, our forecast assumes modest further tightening by the Fed this year with the fed funds range rising a further 50 basis points with the upper end of the range finishing 2019 at 3.0%. However, Fed comments this week suggest that the bar has been raised as to sufficient indication of these risks materializing.
US: Job Market Starts 2019 Off with a Bang!
Hiring activity started 2019 with a bang, adding 304k new jobs in January. This comes off a downwardly revised but still robust December hiring tally (now +222k, 312k previously). Hiring has averaged 241k new jobs per month over the past three months, only slightly below the 254k pace reported in December.
The unemployment rate did move up a tick to 4.0%, lifted by government workers who were furloughed during the government shutdown. Over the household survey reference week (January 6-12th), approximately 380k federal employees were neither working nor being paid, and would have been classified as unemployed. Therefore, the uptick in the unemployment rate is expected to be reversed in February.
The BLS highlighted that the number of people working part-time for economic reasons was also likely to have been boosted by the government shutdown. The broadest measure of unemployment (the U6) which includes these workers jumped up from 7.6% to 8.1% in January.
The good news in the household survey was another increase in the participation rate to 63.2%. The rate is now up 0.5 percentage points over the past year as a strong labor market draws in a greater share of workers.
In the payrolls data, hiring was strong in leisure and hospitality (+74k), construction (+52k), health care (+42k) and transportation and warehousing (+27k). As expected, there were no discernible impacts of the partial federal government shutdown on the estimates of employment, hours, and earnings from the establishment survey.
The closely watched measure of wage growth – average hourly earnings – was a bit softer than expected, rising 0.1% on the month. On a year-on-year basis, wages were up a healthy 3.2% in January (down slightly from 3.3% in December). After revisions, wage growth has now been running above 3% since August.
The January data also featured the annual benchmarking process and updated seasonal adjustment factors, which shifted the profile of job gains over the course of 2018, but didn’t materially affect the hiring trend for the year as a whole.
Key Implications
Boom. Downward revision aside, the overwhelming conclusion from today's numbers is that the U.S. labor market remained incredibly strong at the start of 2019 – resilience that should not go unnoticed by policymakers. There was little to find fault with in the January numbers. Hiring was broad based by industry, wage growth remained decent, and the share of core-aged people (25-54) with jobs was the highest it's been in about eleven years
January's job gains marks a record-setting 100th straight month of payroll gains for the U.S. economy. As outlined in our recent forecast the pace of growth in the U.S. economy is likely to slow over the course of 2019, and hiring is expected to slow along with it, but there is little signs of that yet in recent data. Even with half the pace of monthly gains recorded over the last several months, the unemployment rate will continue to drift lower through the year.
Today's job report gave a taste of the shutdown-clouded data to come. On top of the incomplete economic picture we are looking at due to delayed data releases, other data for January going forward may be tainted by shutdown impacts. This will make it harder to disentangle whether any slowdown is temporary due to the shutdown, or an indication of a weakening trend. It could be spring before we get a cleaner picture of the current state of the U.S. economy.
USD/JPY Mid-Day Outlook
Daily Pivots: (S1) 108.55; (P) 108.81; (R1) 109.12; More...
A temporary low is in place at 108.49 with today's recovery. Intraday bias is turned neutral first. On the downside, below 108.49 will target 107.77 support first. Break there will confirm completion of rebound from 104.69 at 110.00. Then, further decline would be seen back to retest 104.69 low. On the upside, break of 110.00 will extend the rebound. But we'd expect strong resistance from 61.8% retracement of 114.54 to 104.69 at 110.77 to limit upside.
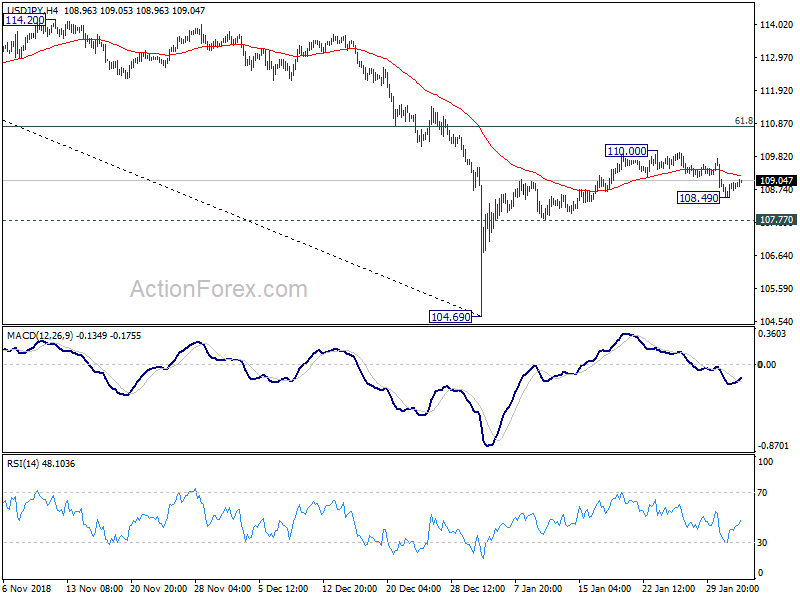
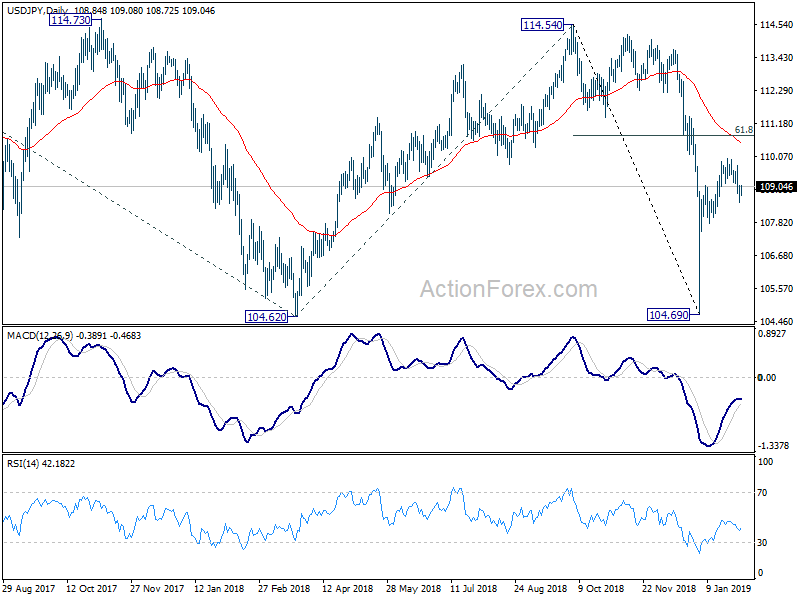
In the bigger picture, while the rebound from 104.69 is strong, there is no change in the view that it's a corrective move. That is, fall from 114.54, as part of the decline from 118.65 (2016 high), is not completed yet. Break of 104.62 will target 100% projection of 118.65 to 104.62 from 114.54 at 100.51, which is close to 100 psychological level. Nevertheless, sustained trading above 55 day EMA (now at 110.82) will dampen this bearish view and turn focus back to 114.54 resistance instead.
USD/CHF Mid-Day Outlook
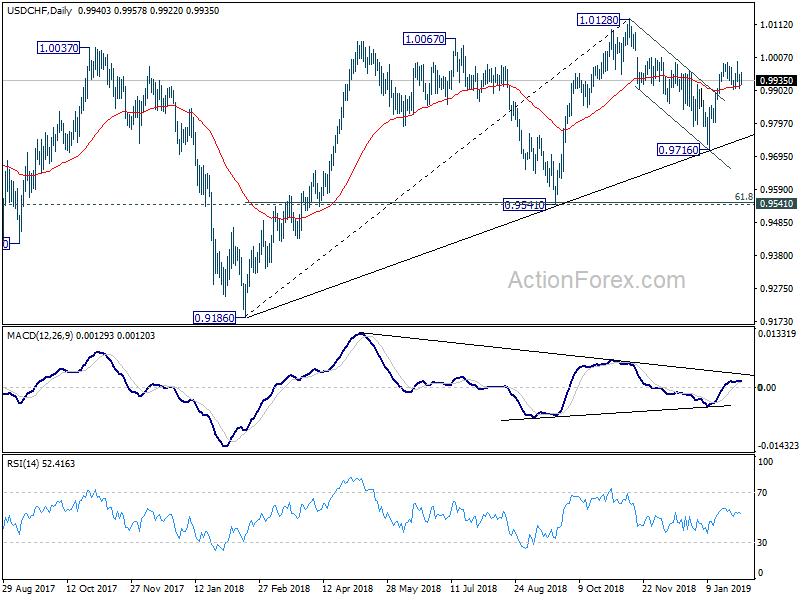
Daily Pivots: (S1) 0.9918; (P) 0.9935; (R1) 0.9963; More....
Intraday bias in USD/CHF remains neutral as consolidation from 0.9994 is in progress. As long as 0.9905 support holds, further rally is expected in the pair. We're holding on to the view that corrective pull back from 1.0128 has completed at 0.9716 already. On the upside, break of 0.9994 will resume the rise from 0.9716 to retest 1.0128 high. However, break of 0.9905 will dampen this view and turn bias to the downside.
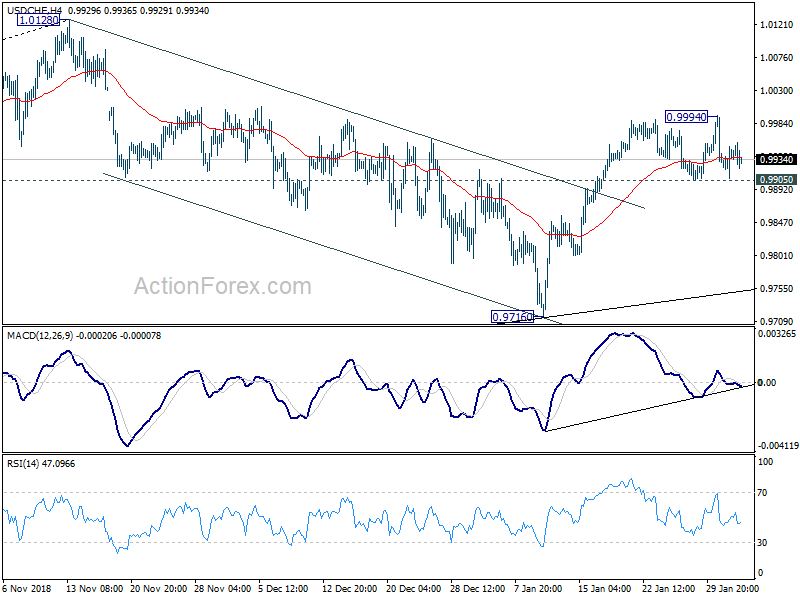
In the bigger picture, USD/CHF drew strong support from medium term trend line and rebounded. That suggests rise from 0.9186 is still in progress. Break of 0.9963 will affirm this bullish case. Further break of 1.0128 will confirm up trend resumption and target 1.0342 key resistance. Nevertheless, break of 0.9716 will dampen this bullish view and at least bring deeper fall to 0.9541 key support.
GBP/USD Mid-Day Outlook
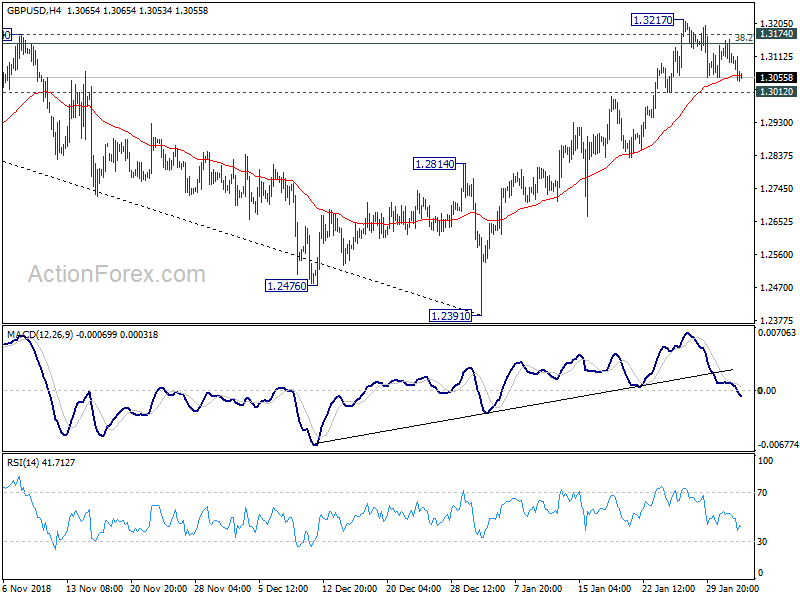
Daily Pivots: (S1) 1.3086; (P) 1.3123; (R1) 1.3148; More....
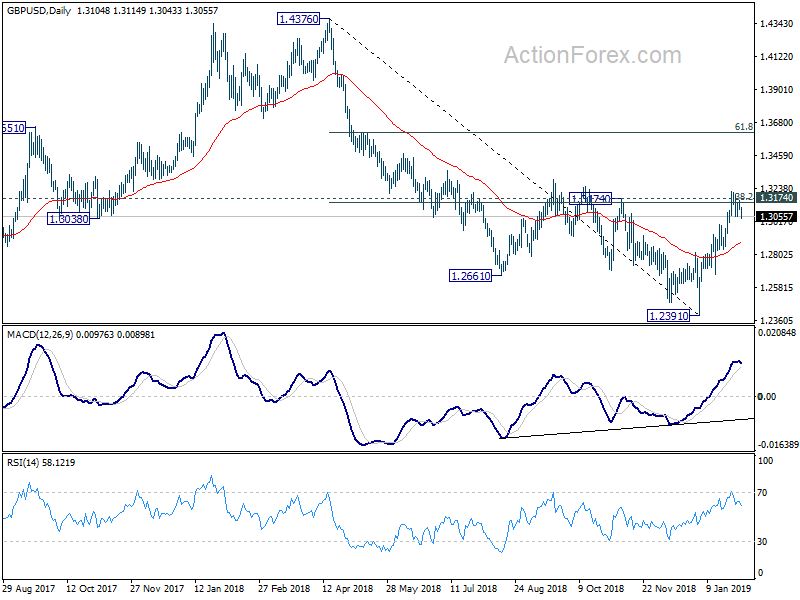
GBP/USD is staying in range of 1.3012/3217 and intraday bias remains neutral first. On the downside, break of 1.3012 minor support will suggest rejection by 1.3174 key resistance, and turn bias to the downside for 1.2814 support. On the upside, sustained break of 1.3174 key resistance will argue that whole decline from 1.4376 has completed at 1.2391. In such case, further rise should then be seen to 61.8% retracement of 1.4376 to 1.2391 at 1.3618.
In the bigger picture, rise from 1.1946 (2016 low) to 1.4376 (2018 high) is seen as a corrective move. Similarly, fall from 1.4376 to 1.2391 also displace a corrective structure. Current development suggests that rise from 1.2391 is the third leg of the corrective pattern from 1.1946 and could extend beyond 1.4376 high. Firm break of 61.8% retracement of 1.4376 to 1.2391 at 1.3618 will affirm this case. On the downside, break of 55 day EMA (now at 1.2865) will turn focus back to 1.2391 low instead.
EUR/USD Mid-Day Outlook
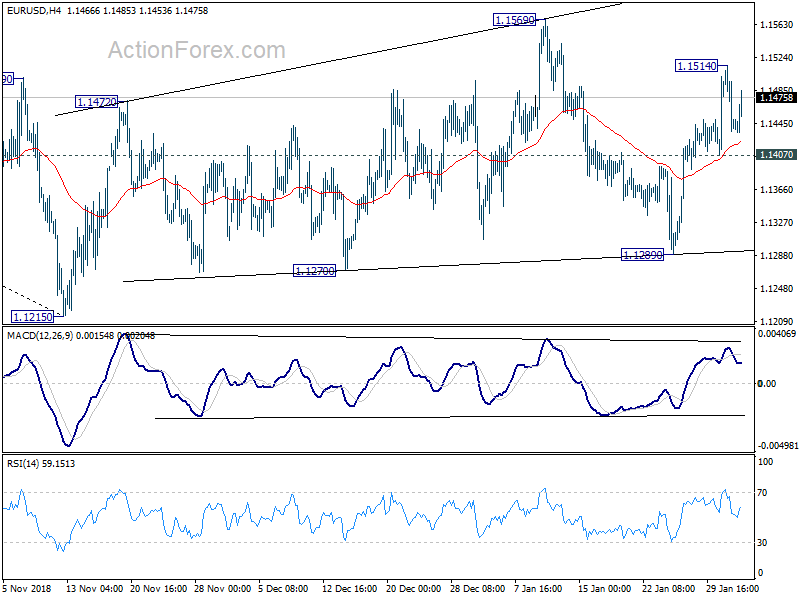
Daily Pivots: (S1) 1.1417; (P) 1.1466; (R1) 1.1496; More.....
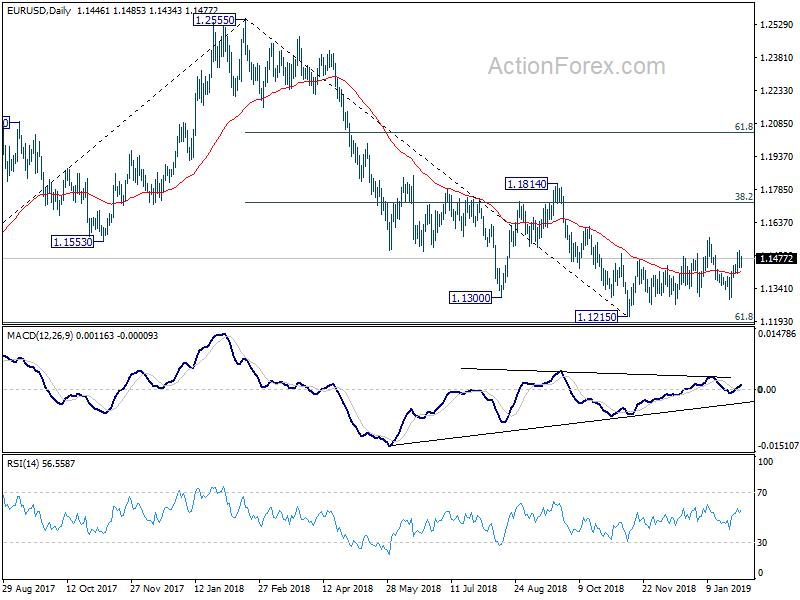
Intraday bias in EUR/USD remains neutral at this point. With 1.1407 minor support intact, further rise is in favor. Rise from 1.1289 is seen as another rising leg in the correction pattern from 1.1215. Above 1.1514 will target 1.1569 resistance and above. On the downside, break of 1.1407 minor support will turn bias back to the downside for 1.1289 support instead.
In the bigger picture, as long as 1.1814 resistance holds, down trend down trend from 1.2555 medium term top is still in progress and should target 61.8% retracement of 1.0339 (2017 low) to 1.2555 at 1.1186 next. Sustained break there will pave the way to retest 1.0339. However, break of 1.1814 will confirm completion of such down trend and turn medium term outlook bullish.
Dollar Dips on Weak Wage Growth, Rise in Unemployment Rate
Dollar is back under some pressure in early despite very strong headline NFP number. The problem with the report is that, other parts are rather weak, including revision in prior month's figure, rise in unemployment rate. More importantly, wage growth is a clear miss. The greenback is extending recent decline against Canadian. And it would probably do so against Euro and Australian too.
For now, in the currency markets, New Zealand Dollar is the strongest one for today, followed by Euro. Sterling is the weakest one, followed by Yen and then Dollar. For the week. Pound is the worst performing one, followed by Dollar and then Swiss Franc. Commodity currencies are all the strongest.
In other markets, DOW future point to slightly higher open. FTSE is up 0.41%, DAX is up 0.07%, CAC is up 0.16%. German 10-year yield is down -0.001 at 0.152. Earlier in Asia, Nikkei rose 0.07%, Hong Kong HSI dropped -0.04%, China Shanghai SSE rose 1.30%, Singapore Strait Times dropped -0.05%. Japan 10-year JGB yield dropped -0.0226 to -0.019.
NFP grew 304k... but wage growth missed, unemployment rate rose
US non-farm payroll grew 304k in January, well above expectation of 165k. However, prior month's figure was revised sharply down from 312k to 222k. Unemployment rate rose to 4.0% versus expectation of 3.8%. But labor force participation rate also rose to 63.2%, up from 63.1%. Wage growth is a clear miss with average hourly earnings rose 0.1% mom versus expectation of 0.3% mom.
Eurozone PMI manufacturing finalized at 50.5, adds to likelihood of recession
Eurozone PMI manufacturing was finalized at 50.5 in January, unrevised, down from December's 51.4. It's the six consecutive months of decline and the lowest level since November 2014. Markit noted that "output up marginally, but sharpest fall in new work recorded since April 2013". Also, "growth sustained via reduction in backlogs and fastest accumulation of stocks in survey history".
Among the countries, Italy PMI manufacturing hit 47.8, a 68-month low. Germany reading was also in contraction at 49.7, a 50-month low. Franc reading recovered mildly to 3-month high of 51.2. But Ireland reading hit 27-month low, Austria reading hit 29-month low and the Netherlands reading hit 28-month low.
Chris Williamson, Chief Business Economist at IHS Markit said, "the January PMI adds to the likelihood that the manufacturing sector is in recession and will act as a drag on the economy in the first quarter." "There appears to be a more deep-rooted malaise setting in, which reflects widespread concerns about the destabilising effect of political uncertainty and the damage to exports from rising trade protectionism."
Eurozone CPI slowed to 1.4%, but core edged up to 1.1%
Eurozone CPI slowed to 1.4% yoy in January, down from 1.6% yoy, matched expectation. Core CPI, rose to 1.1% yoy, up from 1.0% yoy and beat expectation of 1.0% yoy. Looking at the main components of euro area inflation, energy is expected to have the highest annual rate in January (2.6%), followed by food, alcohol & tobacco (1.8%), services (1.6%) and non-energy industrial goods (0.3%).
From Swiss, PMI manufacturing dropped to 54.3 in January, down from 57.8, missed expectation of 56.6. SECO consumer confidence improved to -4, up from -6. Retail sales dropped -0.3% yoy in December versus expectation of 0.4% yoy.
UK PMI manufacturing dropped to 52.8, stocks up on Brexit preparations
UK PMI manufacturing dropped to 52.8 in January, down from 54.2 and missed expectation of 53.5. That's also a 3-month low. Markit noted that "stocks of purchases rise at survey-record rate". And, "employment falls for only the second time in past 30 months".
Rob Dobson, Director at IHS Markit,. said "Stocks of inputs increased at the sharpest pace in the 27-year history, as buying activity was stepped up to mitigate against potential supply-chain disruptions in coming months. There were also signs that inventories of finished goods were being bolstered to ensure warehouses are well stocked to meet ongoing contractual obligations."
And, "based on its historical relationship against official data, the January survey is consistent with a further solid contraction of production volumes, meaning manufacturing will likely act as a drag on the economy in the first quarter."
China Caixin PMI manufacturing dropped to 48.3, no significant effect from countercyclical economic policy
China Caixin PMI manufacturing dropped to 48.3 in January, down from 49.7 and missed expectation of 49.7. That's the lowest reading since February 2016 and points to continued softening in the health of China's manufacturing sector. Markit also noted that underlying trend in production weakens. Export sales increase slightly, but overall new work softens. Though, a positive note is that business confidence rose to eight-month high.
Zhengsheng Zhong, Director of Macroeconomic Analysis at CEBM Group said "On the whole, countercyclical economic policy hasn't had a significant effect. While domestic manufacturing demand shrank, external demand turned positive and became a bright spot amid positive progress in Sino-U.S. trade talks. As companies were more willing to reduce their inventories, their output declined, indicating notable downward pressure on China's economy. China is likely to launch more fiscal and monetary measures and speed up their implementation. Yet the stance of stabilizing leverage and strict regulation hasn't changed, which means the weakening trend of China's economy will continue."
Japan PMI manufacturing finalized at 29-month low, bad news for global trade cycle
Japan PMI manufacturing was finalized at 50.3 in January, revised up from 50.0. But that's still the lowest level in 29 months. And, new export orders decline at sharpest pace since July 2016. Also, business confidence falls for the eighth month running.
Joe Hayes, Economist at IHS Markit said "the data "brought bad news for the global trade cycle at the start of 2019, with new export orders falling at the sharpest rate in two-and-a-half years" And, "domestic markets also showed signs of frailty as total demand declined for the first time since September 2016."
Besides, "with Abe set to levy the consumption tax this year, and Sino-US trade tensions still lurking, domestic weakness in Japan further adds to already existing challenges.
Also from Japan, jobless rate dropped to 2.4% in December, below expectation of 2.5%.
EUR/USD Mid-Day Outlook
Daily Pivots: (S1) 1.1417; (P) 1.1466; (R1) 1.1496; More.....
Intraday bias in EUR/USD remains neutral at this point. With 1.1407 minor support intact, further rise is in favor. Rise from 1.1289 is seen as another rising leg in the correction pattern from 1.1215. Above 1.1514 will target 1.1569 resistance and above. On the downside, break of 1.1407 minor support will turn bias back to the downside for 1.1289 support instead.
In the bigger picture, as long as 1.1814 resistance holds, down trend down trend from 1.2555 medium term top is still in progress and should target 61.8% retracement of 1.0339 (2017 low) to 1.2555 at 1.1186 next. Sustained break there will pave the way to retest 1.0339. However, break of 1.1814 will confirm completion of such down trend and turn medium term outlook bullish.
Economic Indicators Update
| GMT | Ccy | Events | Actual | Forecast | Previous | Revised |
|---|---|---|---|---|---|---|
| 21:30 | AUD | AiG Performance of Manufacturing Index Jan | 52.5 | 49.5 | 50 | |
| 23:30 | JPY | Jobless Rate Dec | 2.40% | 2.50% | 2.50% | |
| 00:30 | AUD | PPI Q/Q Q4 | 0.50% | 0.60% | 0.80% | |
| 00:30 | AUD | PPI Y/Y Q4 | 2.00% | 2.10% | ||
| 00:30 | JPY | PMI Manufacturing Jan F | 50.3 | 50 | 50 | |
| 01:45 | CNY | Caixin PMI Manufacturing Jan | 48.3 | 49.7 | 49.7 | |
| 06:45 | CHF | SECO Consumer Confidence Jan | -4 | -5 | -6 | |
| 07:30 | CHF | Retail Sales Real Y/Y Dec | -0.30% | 0.40% | -0.50% | -0.60% |
| 08:30 | CHF | PMI Manufacturing Jan | 54.3 | 56.6 | 57.8 | |
| 08:45 | EUR | Italy Manufacturing PMI Jan | 47.8 | 49 | 49.2 | |
| 08:50 | EUR | France Manufacturing PMI Jan F | 51.2 | 51.2 | 51.2 | |
| 08:55 | EUR | Germany Manufacturing PMI Jan F | 49.7 | 49.9 | 49.9 | |
| 09:00 | EUR | Eurozone Manufacturing PMI Jan F | 50.5 | 50.5 | 50.5 | |
| 09:30 | GBP | PMI Manufacturing Jan | 52.8 | 53.5 | 54.2 | |
| 10:00 | EUR | Eurozone CPI Core Y/Y Jan A | 1.10% | 1.00% | 1.00% | |
| 10:00 | EUR | Eurozone CPI Estimate Y/Y Jan | 1.40% | 1.40% | 1.60% | |
| 13:30 | USD | Change in Non-farm Payrolls Jan | 304K | 165K | 312K | 222K |
| 13:30 | USD | Unemployment Rate Jan | 4.00% | 3.80% | 3.90% | |
| 13:30 | USD | Average Hourly Earnings M/M Jan | 0.10% | 0.30% | 0.40% | |
| 14:30 | CAD | Manufacturing PMI Jan | 53.6 | |||
| 14:45 | USD | Manufacturing PMI Jan F | 54.9 | 54.9 | ||
| 15:00 | USD | ISM Manufacturing Jan | 54.3 | 54.1 | ||
| 15:00 | USD | ISM Prices Paid Jan | 58 | 54.9 | ||
| 15:00 | USD | ISM Employment Jan | 56.2 | |||
| 15:00 | USD | Construction Spending M/M Dec | ||||
| 15:00 | USD | U. of Mich. Sentiment Jan F | 90.7 | 90.7 |
NFP grew 304k… but wage growth missed, unemployment rate rose
Dollar shows rather little reactions to non-farm payroll report. It spikes initial on very strong headline number. But the greenback is quickly pare the little gains as the overall set of data is just mixed. In particular, wage growth is rather disappointing.
US non-farm payroll grew 304k in January, well above expectation of 165k. However, prior month's figure was revised sharply down from 312k to 222k. Unemployment rate rose to 4.0% versus expectation of 3.8%. But labor force participation rate also rose to 63.2%, up from 63.1%. Wage growth is a clear miss with average hourly earnings rose 0.1% mom versus expectation of 0.3% mom.
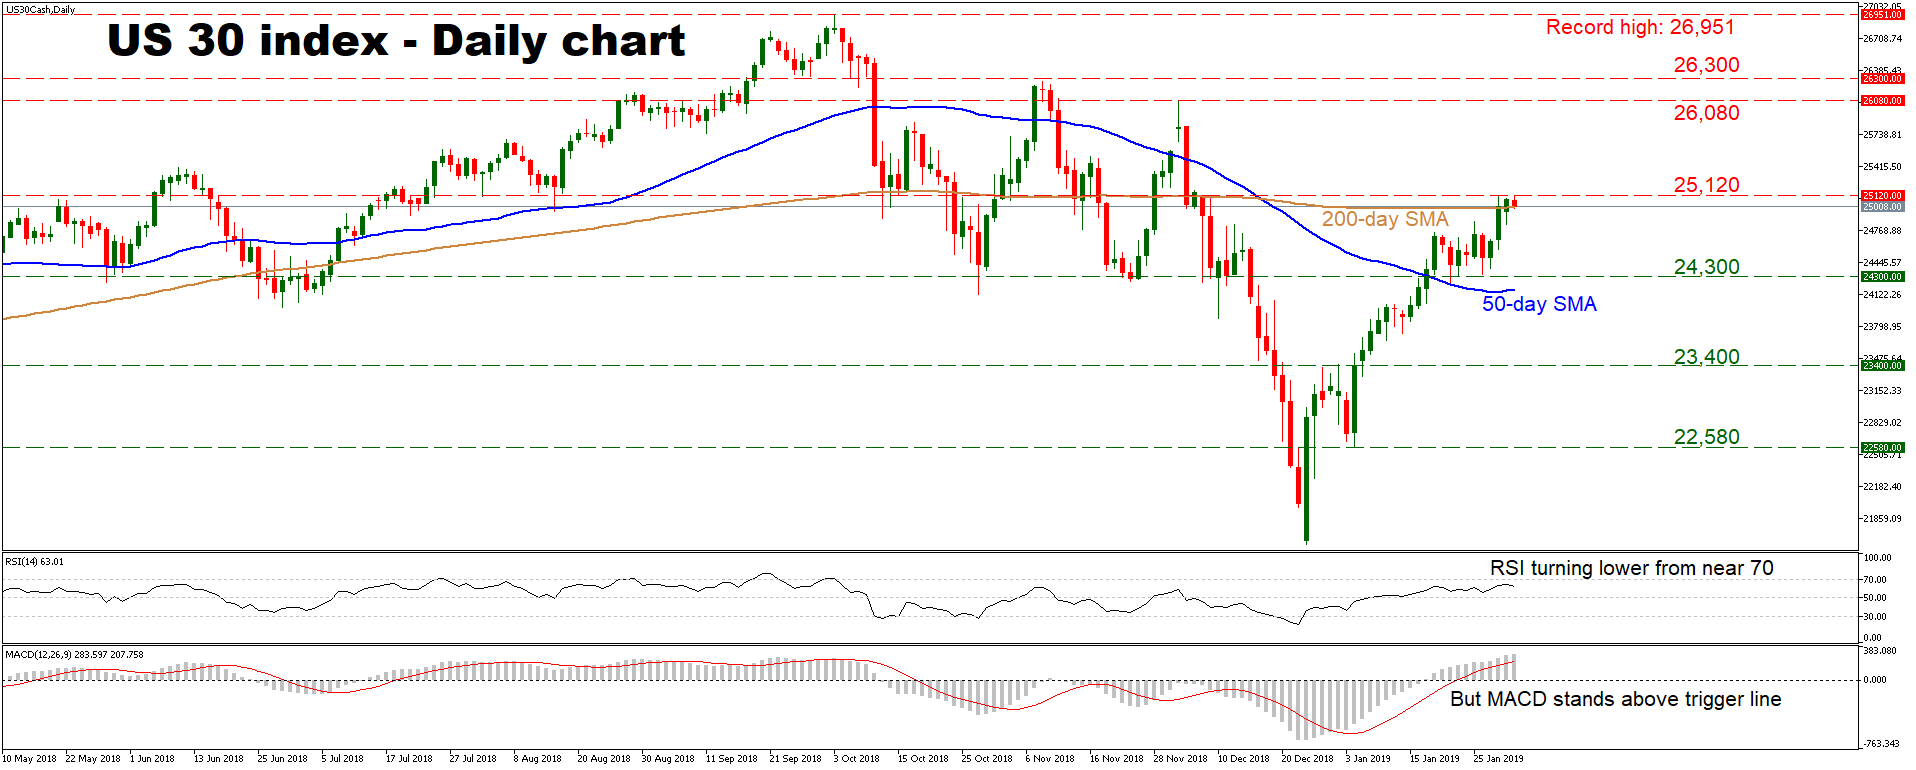
US 30 Index Clears 200-Day SMA, Seems Positive in Immediate Term
The US 30 index has continued to recover in recent sessions, managing to close above its 200-day simple moving average (SMA) on January 31. Combined with the fact that recent price action consists of higher highs and higher lows, the bias seems to have turned back to positive in the immediate term.
The RSI, though, suggests that a pullback may be on the cards, as it appears to have met resistance near its overbought zone and turned lower. The MACD, on the other hand, remains above its red trigger line.
A potential correction lower in the index could stall around the 24,300 zone, which capped multiple declines in late January. Notice that the 50-day SMA is not far below, at 24,168. If the bears break below that too, the picture would turn back to negative, opening the way for a test of 23,400, the inside swing high on December 28.
Otherwise, if buyers stay in control, preliminary resistance may come near 25,120, which halted the advance on January 30. An upside break could reaffirm the positive bias, giving the bulls the green light to challenge 26,080, the peak of December 3.
Summarizing, the short-term picture seems positive at the moment, though a corrective wave lower shouldn’t be ruled out as the next move given the RSI’s slope.
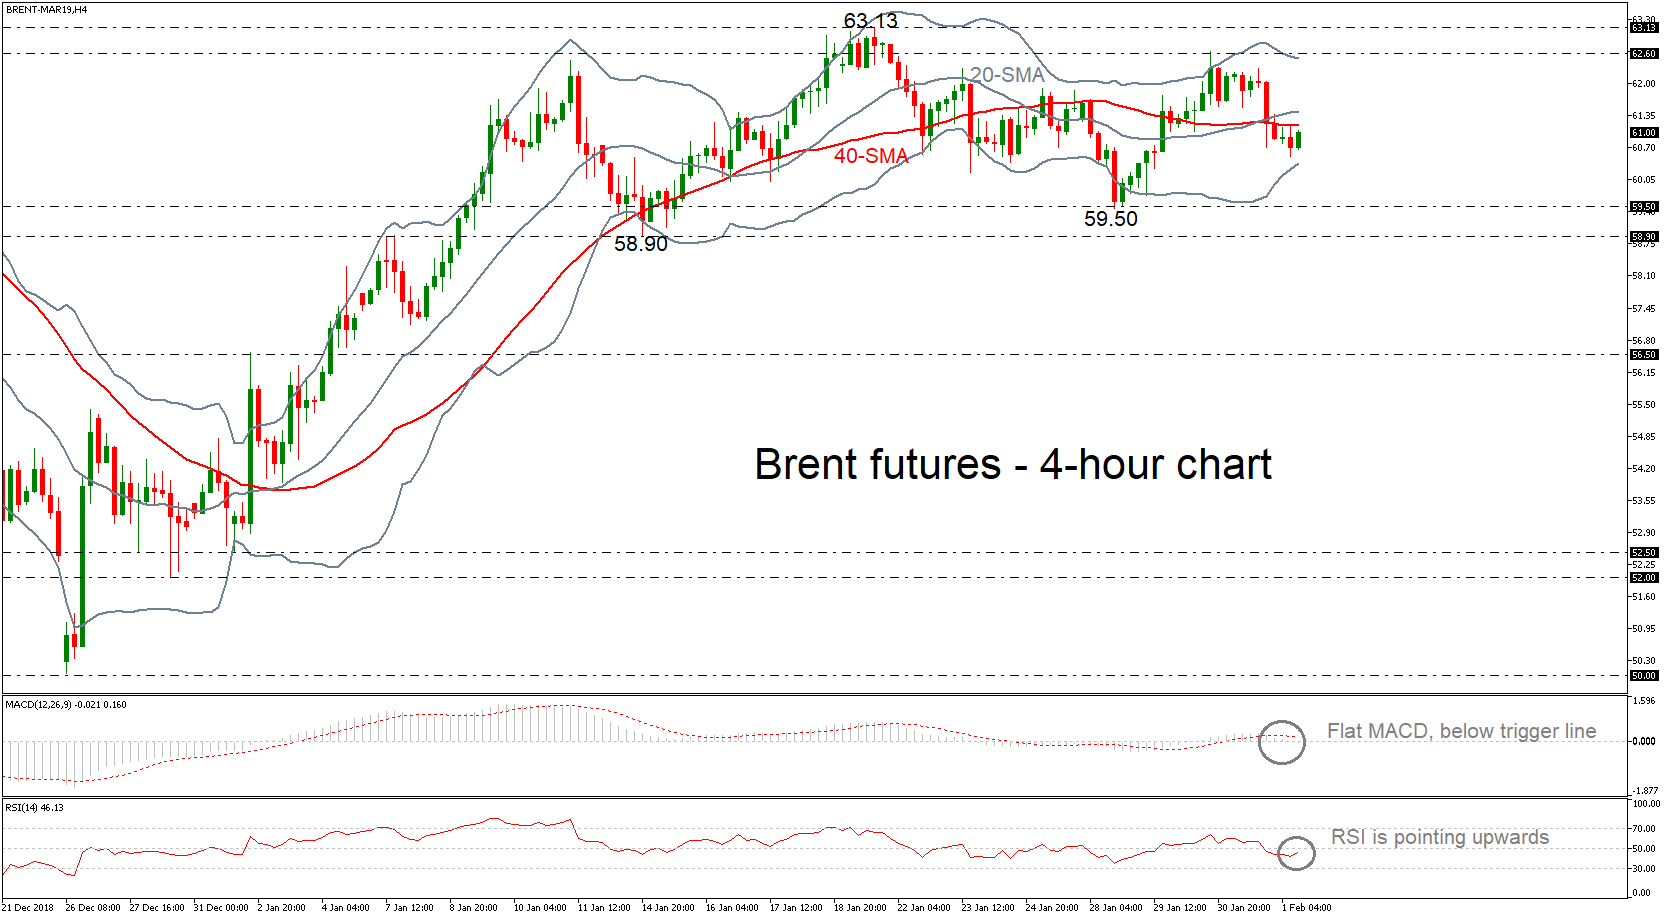
Brent Crude Oil Futures Trade Sideways in Near Term; Hold in Tight Bollinger Band
Brent crude oil futures have been moving sideways within the Bollinger bands over the last three weeks, failing to create a significant movement. The RSI indicator suggests that the market might improve in the coming sessions as it is pointing upwards, however, the MACD oscillator is flattening near the zero line, confirming the recent trend in the 4-hour chart.
Should the price move higher, it would increase the chances for an extension of the bullish correction but would first face immediate resistance at the 62.60 barrier, which stands near the upper Bollinger band. Above that, the area around 63.13 could be another potential hurdle in focus.
On the flipside, if the price manages to drop below the lower Bollinger band, nearby support could come from the 59.50 barrier. A decisive close below the latter level would drive the price towards the 59.50 – 58.90 support zone.
In the short-term picture, the price currently stands below the 20- and 40-simple moving averages (SMAs) but the structure remains neutral.