Sample Category Title
AUD/USD Weekly Outlook
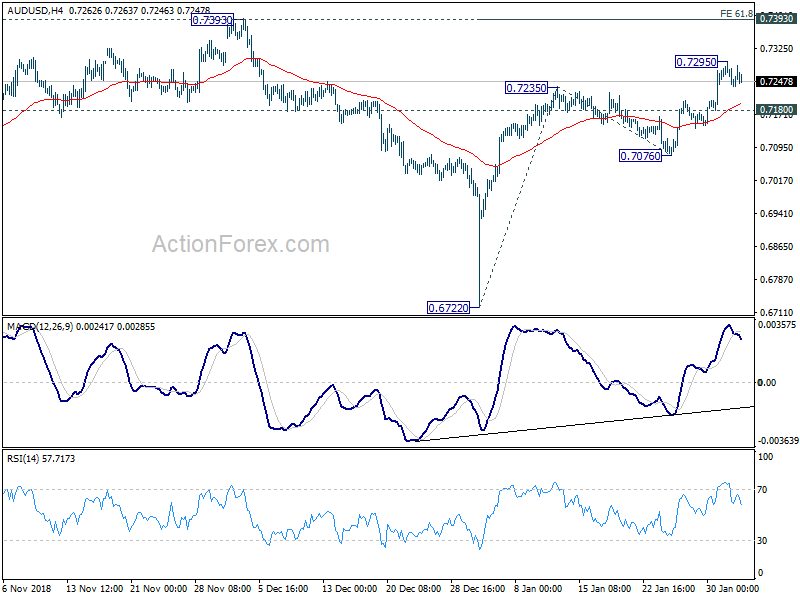
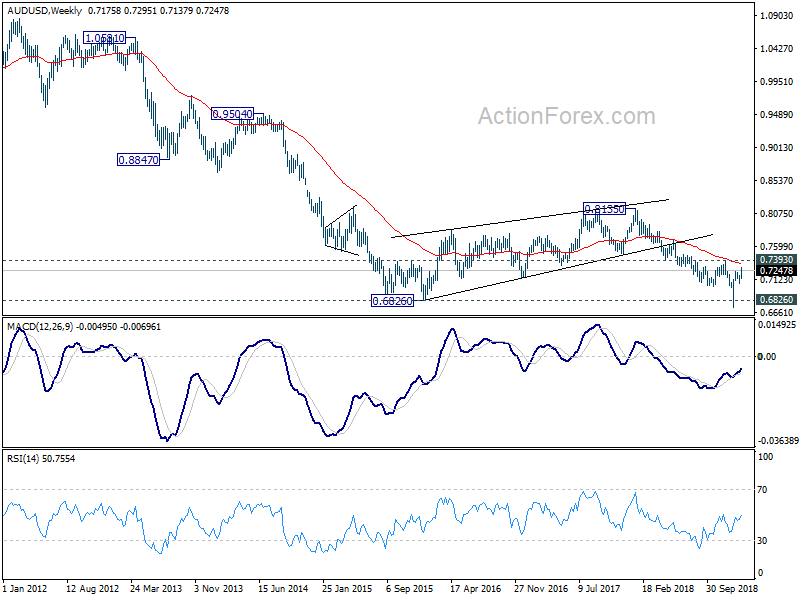
AUD/USD's rebound from 0.6722 resumed last week by taking out 0.7235 resistance to as high as 0.7295. As a temporary top is formed there, initial bias is neutral this week first. On the upside, above 0.7295 will target 0.7393 cluster resistance (61.8% projection of 0.6722 to 0.7235 from 0.7076 at 0.7393). We'd expect strong resistance from there to limit upside to complete the rebound from 0.6722. On the downside, break of 0.7180 minor support will turn bias back to the downside for 0.7076 support. However, sustained break of 0.7393 will indicate bullish reversal and target 100% projection at 0.7589 next).
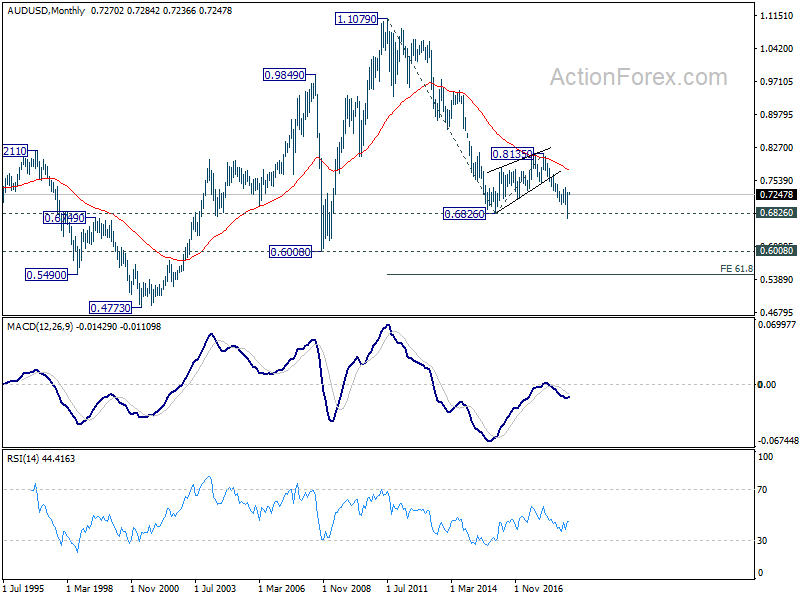
In the bigger picture, as long as 0.7393 resistance holds, we'd treat fall from 0.8135 as resuming long term down trend from 1.1079 (2011 high). Decisive break of 0.6826 (2016 low) will confirm this bearish view and resume the down trend to 0.6008 (2008 low). However, firm break of 0.7393 will argue that fall from 0.8135 has completed. And corrective pattern from 0.6826 has started the third leg, targeting 0.8135 again.
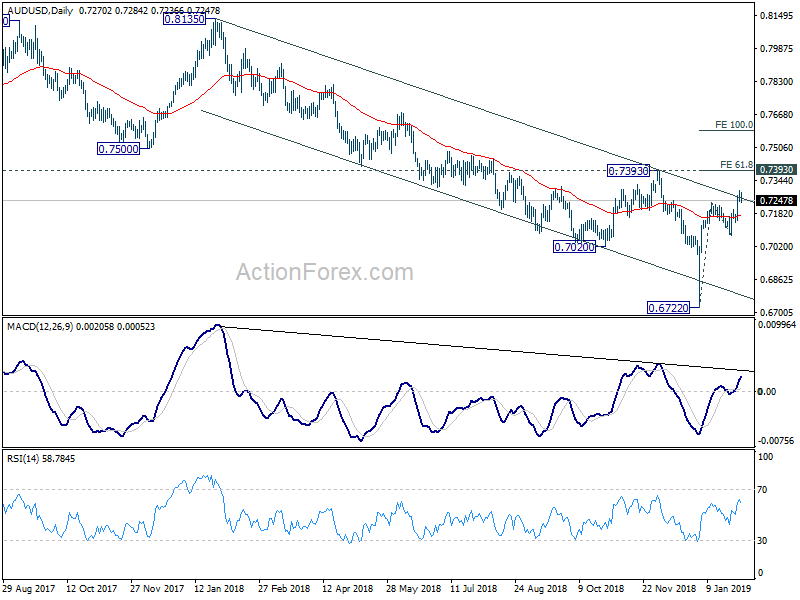
In the longer term picture, prior rejection by 55 month EMA maintained long term bearishness in AUD/USD. That is, down trend from 1.1079 (2011 high) is still in progress. Sustained break of 0.6826 will target 0.6008 low and then 61.8% projection of 1.1079 to 0.6826 from 0.8135 at 0.5507.
USD/CAD Weekly Outlook
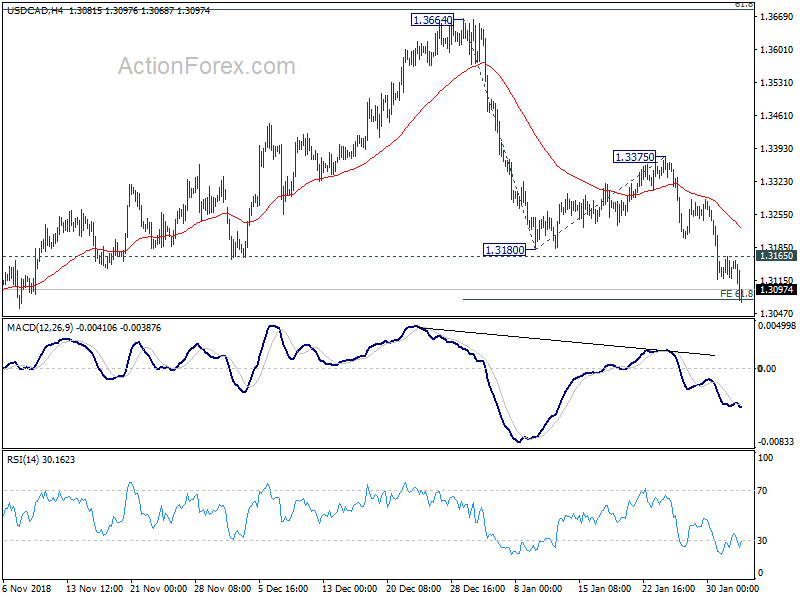
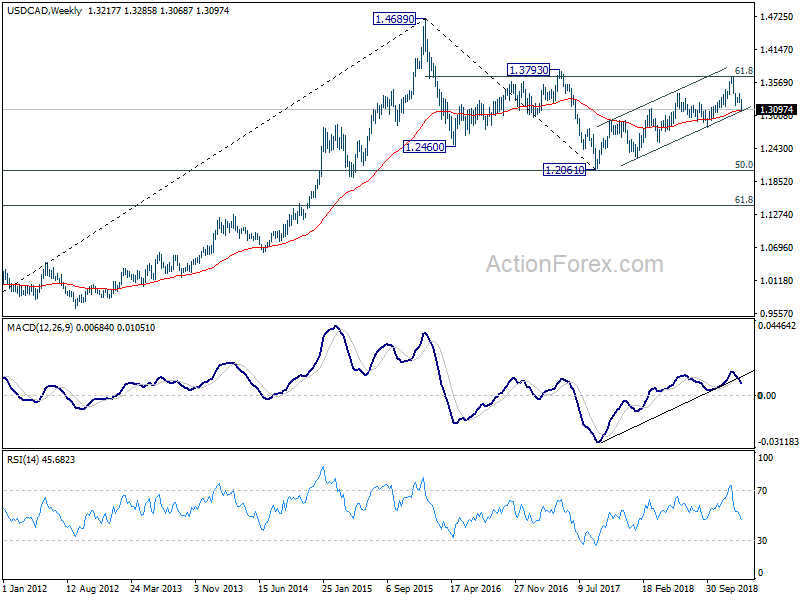
USD/CAD's fall from 1.3664 resumed and accelerated to as low as 1.3068 last week. Initial bias stays on the downside this week. But we'd start to be cautious on bottoming as it approaches channel support (now at 1.3049). On the upside break of 1.3165 will turn bias to the upside for rebounding towards 1.3375 resistance. However, sustained break of the channel support will pave the way to 100% projection of 1.3664 to 1.3180 from 1.3375 at 1.2891.
In the bigger picture, structure of the medium term rise from 1.2061 (2017 low) to 1.3664 is not clearly impulsive. Hence, we'd stay cautious on strong resistance from 61.8% retracement of 1.4689 (2016 high) to 1.2061 at 1.3685 and 1.3793 resistance to limit upside, and bring medium term topping. But in any case, medium term outlook will stay bullish as long as channel support (now at 1.3049) holds. Sustained break of 1.3793 will pave the way to retest 1.4689 (2015 high). Firm break of the channel support should confirm reversal target 1.2061 low again.
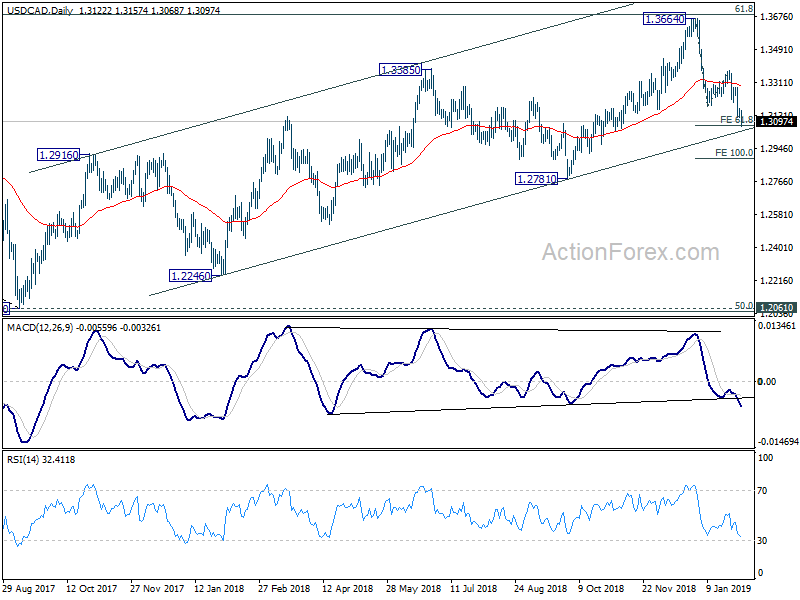
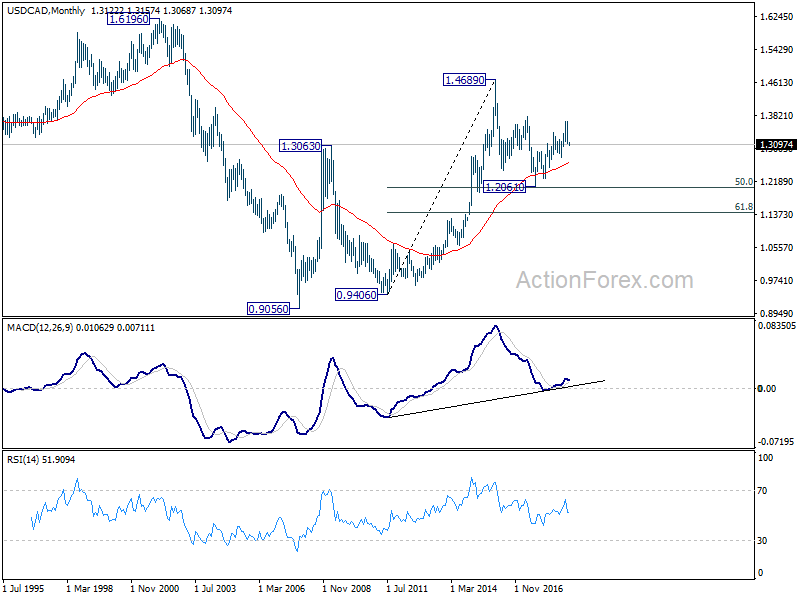
In the longer term picture, corrective fall from 1.4689 (2015 high) should have completed with three waves down to 1.2061, just ahead of 50% retracement of 0.9406 (2011 low) to 1.4689 (2015 high) at 1.2048. The development keeps long term up trend from 0.9406 and that from 0.9056 (2007 low) intact. For now, there is prospect of extending the long term up trend through 1.4689.
GBP/JPY Weekly Outlook
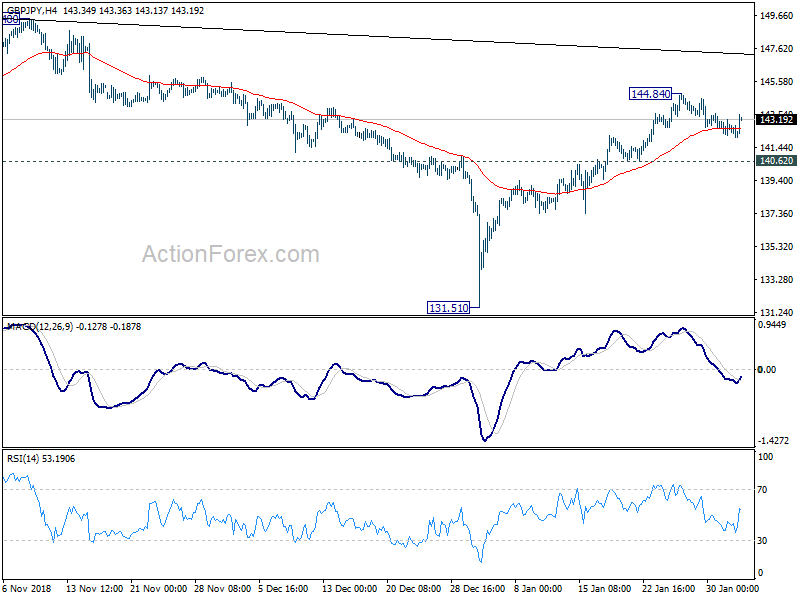
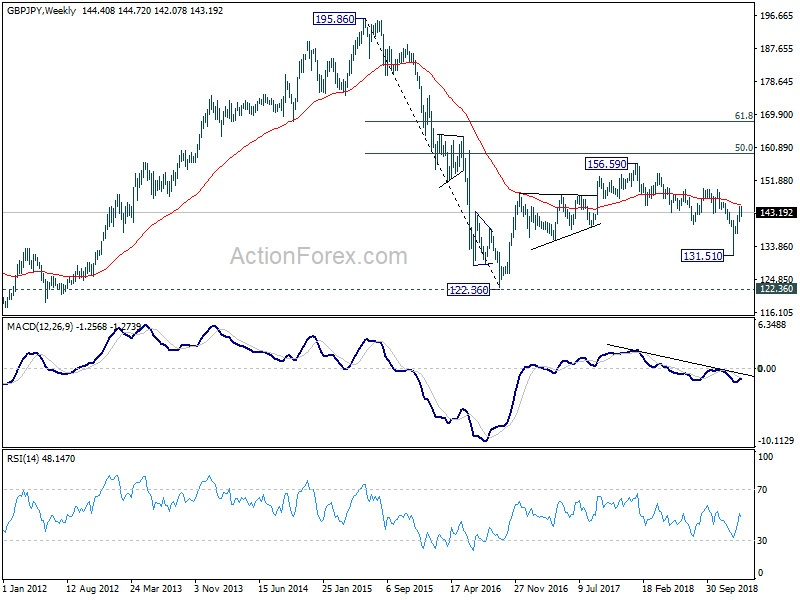
GBP/JPY retreated last week as price actions from 144.84 developed into consolidation pattern. Initial bias remains neutral this week first. Further rise is expected as long as 140.62 minor support holds. Break of 144.82 will resume the rebound from 131.51 to trendline resistance at around 147.23. We'd expect strong resistance from there to limit upside, at least on first attempt. On the downside, firm break of 140.62 will suggest completion of the rebound and turn bias to the downside.
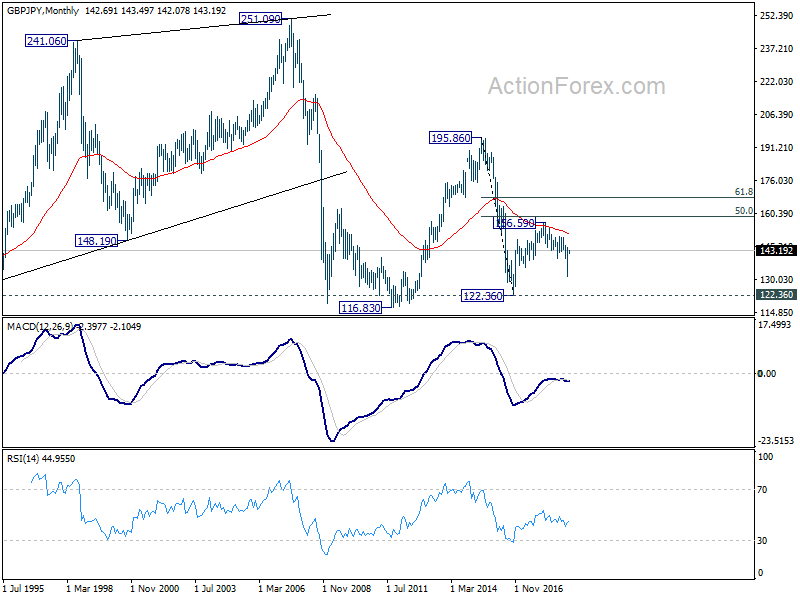
In the bigger picture, the strong rebound from 131.51 suggests that medium term fall from 156.59 (2018 high) has completed already. The corrective structure of such decline is turn argues that it's the second leg of the corrective pattern from 122.36 (2016 low). And this pattern is starting the third leg. On the upside, decisive break of 149.38 will pave the way to 156.59 resistance and above.
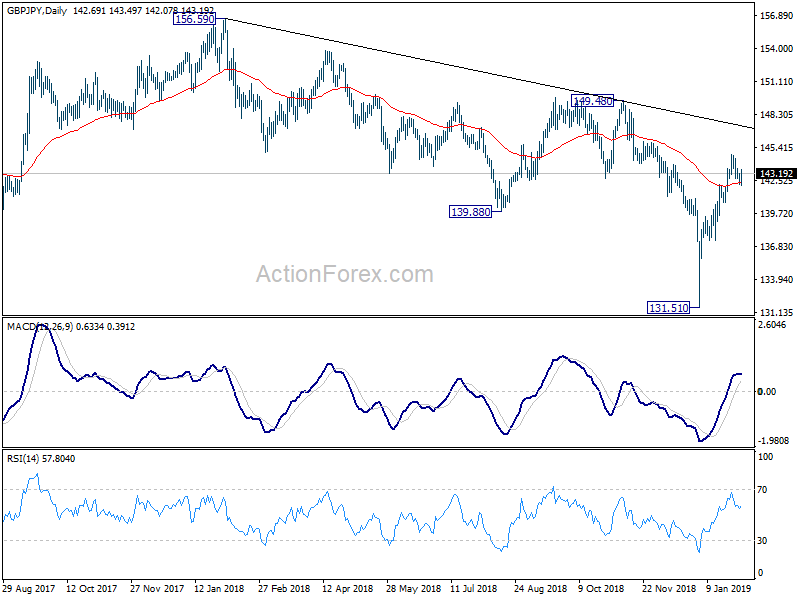
In the longer term picture, the rise from 122.36 (2016 low) to 156.59 (2018 high) doesn't display a clear impulsive structure. Thus, we're treating price actions from 122.36 as a corrective pattern. In case of an extension, strong resistance is likely to be seen at 50% retracement of 195.86 (2015 high) to 122.36 at 159.11 to limit upside. On the downside, break of 131.51 support will bring 122.26 low back into focus.
EUR/JPY Weekly Outlook
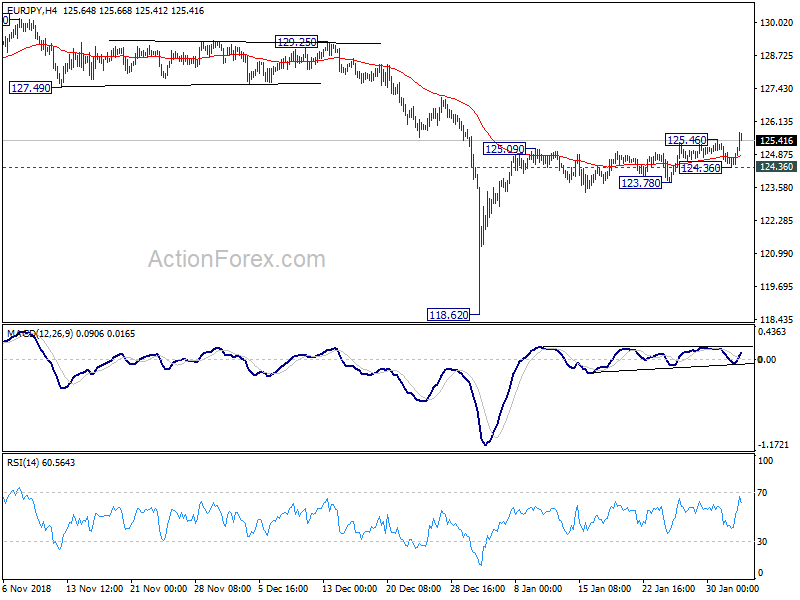
EUR/JPY's rebound from 118.62 extended last week even though upside momentum has been unconvincing. Further rise is expected this week for 55 days EMA (now at 126.15). We'd be cautious on strong resistance from there to limit upside. And, break of 124.36 support will argue that the rebound has completed and turn bias to the downside. Nevertheless, sustained trading above 55 day EMA will pave the way back to 129.25 resistance next.
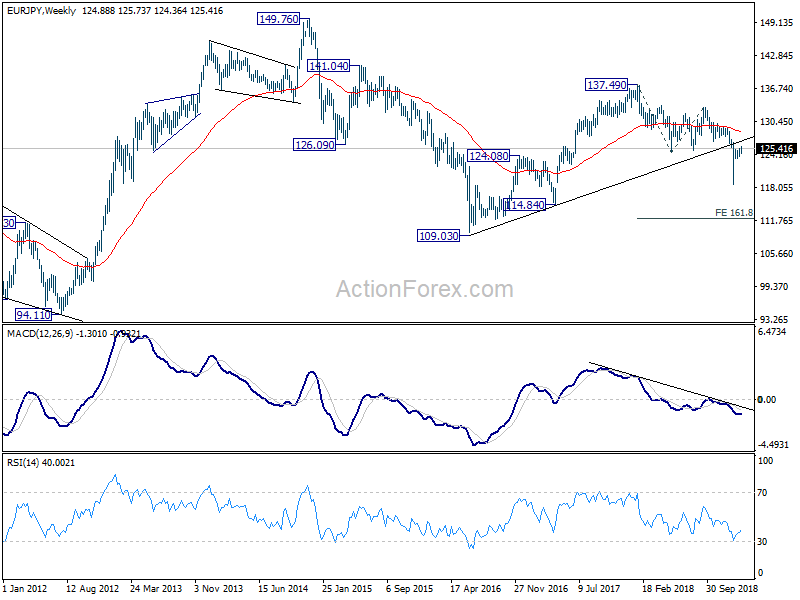
In the bigger picture, medium term rebound from 109.03 (2016 low) has completed at 137.49 already, with corrective structure. Fall from 137.39 is possibly just the second leg of the corrective pattern from 109.03. Break of 133.12 resistance should start the third leg to 137.49 and above. Nevertheless, break of 118.62 will resume the decline from 137.49 for 109.03/114.84 support zone instead.
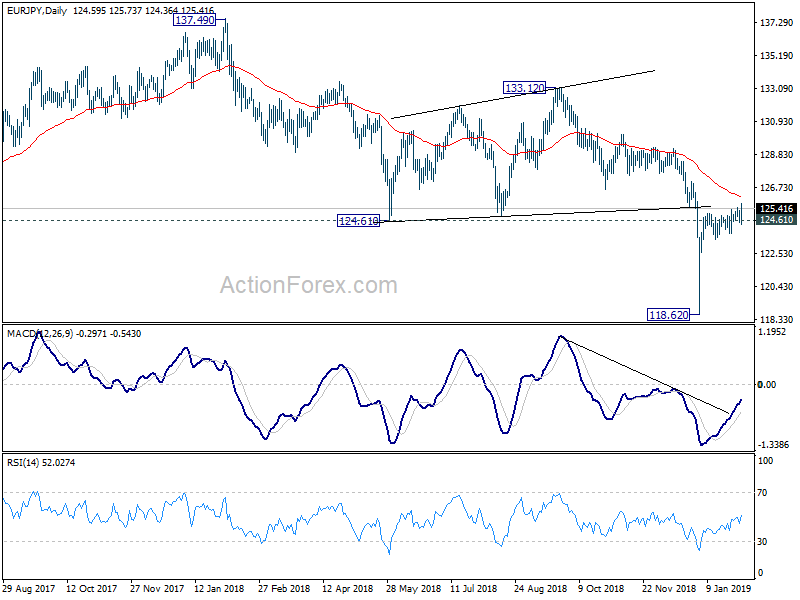
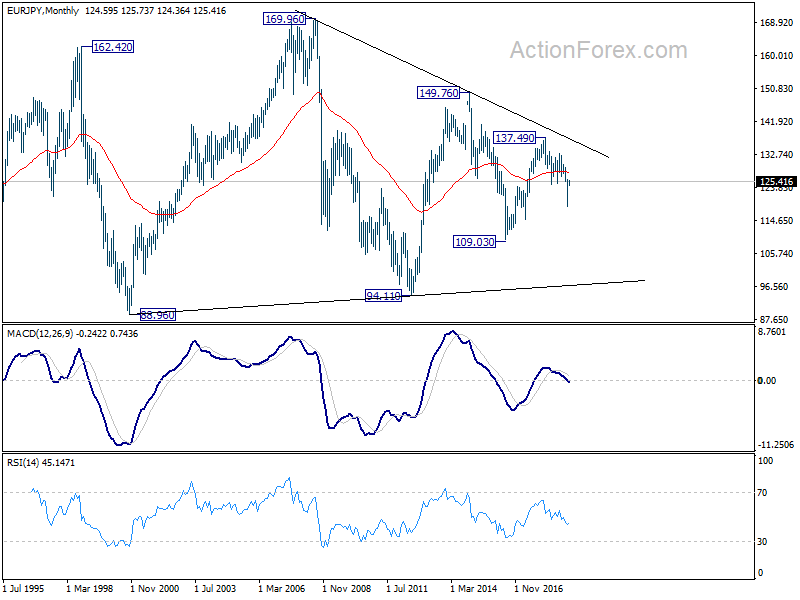
In the long term picture, EUR/JPY is staying in long term sideway pattern, established since 2000. Fall from 137.49 is seen as a falling leg inside the pattern. It could extend through 109.03 to resume the decline from 149.76 But in that case, we'd expect strong support around 94.11 (2012 low) to bring reversal.
EUR/GBP Weekly Outlook
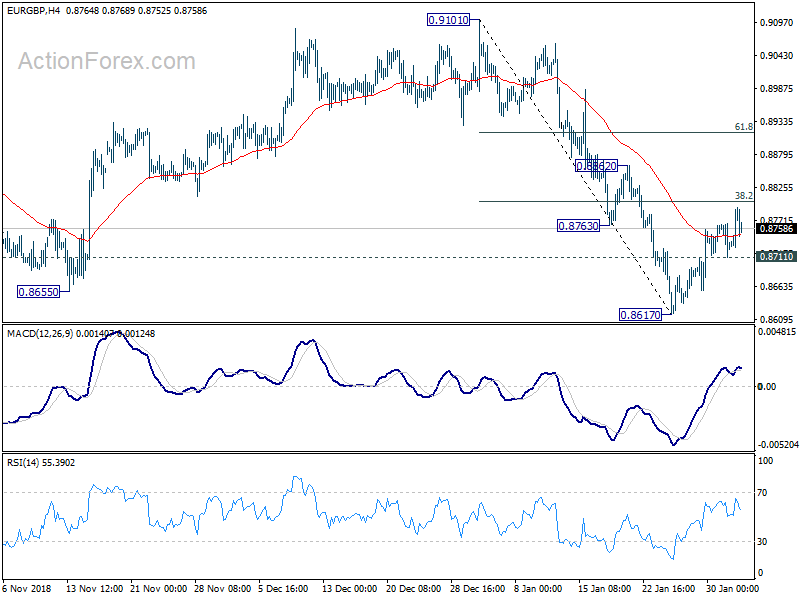
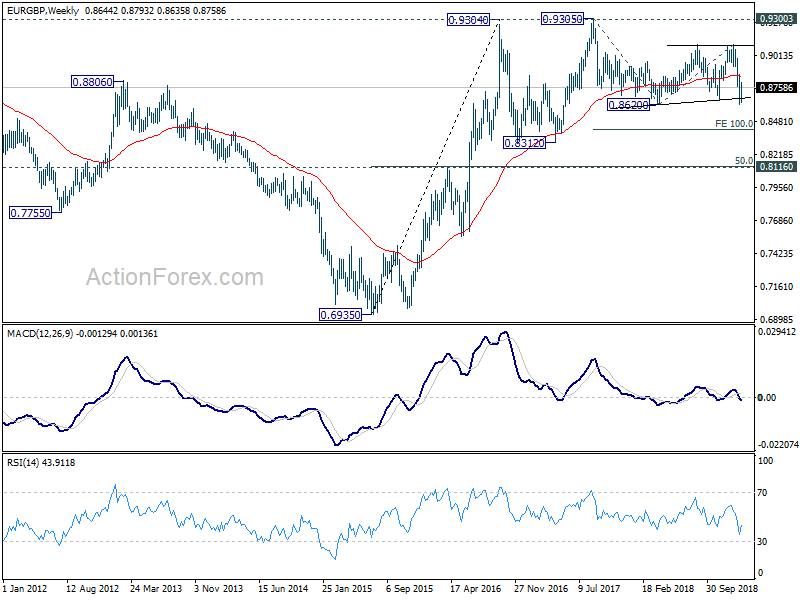
EUR/GBP's rebound last week suggests short term bottoming after drawing support from 0.8620 key support level. Further rise is expected this week as long as 0.8711 minor support holds, to 38.2% retracement of 0.9101 to 0.8617 at 0.8802. Break will target 61.8% retracement at 0.8916. On the downside, break of 0.8711 will turn bias back to the downside for 0.8617/20 support instead.
In the bigger picture, EUR/GBP is seen as staying in long term range pattern started at 0.9304 (2016 high). The medium term range is set between 0.8620 and 0.9101. Downside breakout of 0.8620 will pave the way back to 0.8312 support . Break of 0.9101 will bring retest of 0.9304/5 resistance.
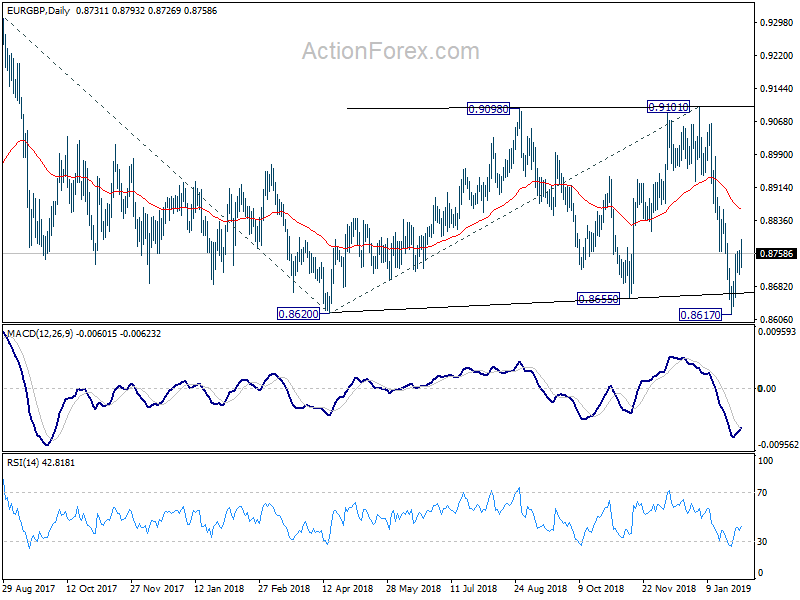
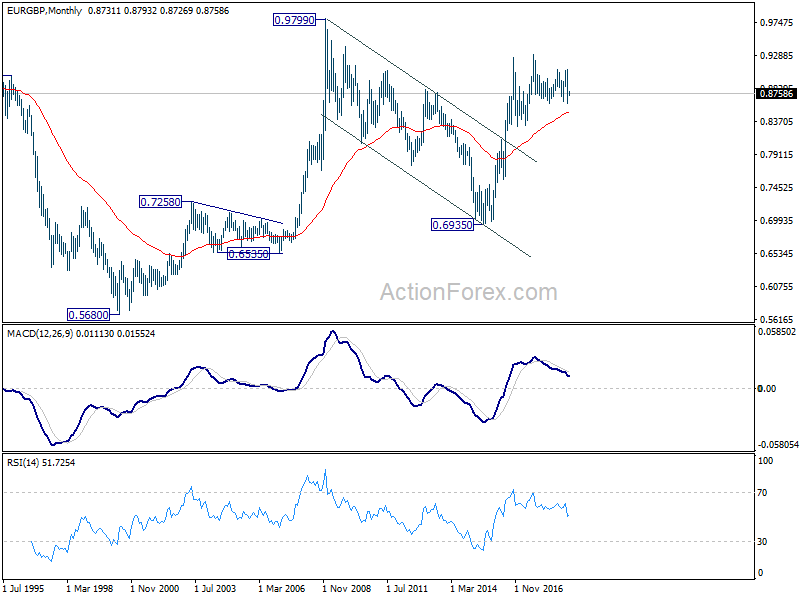
In the long term picture, we're holding on to the view that rise from 0.6935 (2015 low) is resuming the up trend from 0.5680 (2000 low). As long as 0.8116 cluster support (50% retracement of 0.6935 to 0.9304 at 0.8120) holds, further rise should be seen through 0.9305 to 0.9799 and above down the road.
EUR/AUD Weekly Outlook
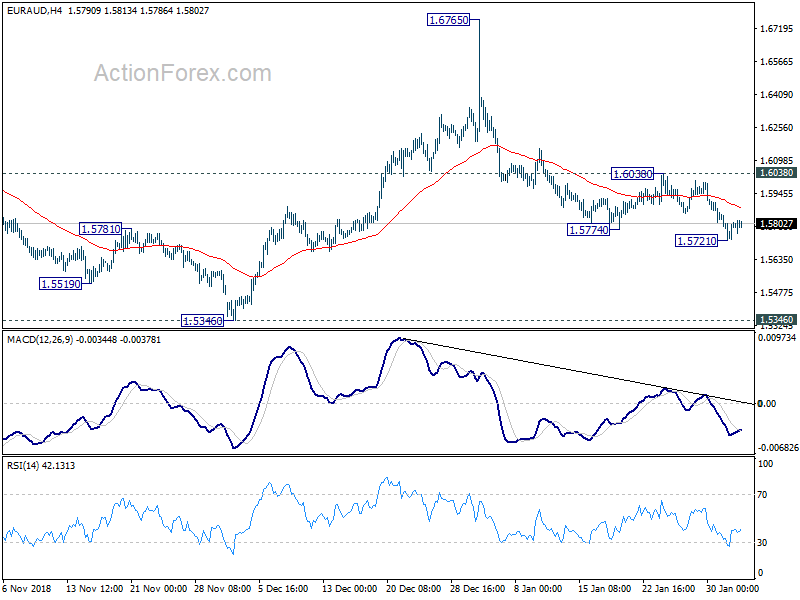
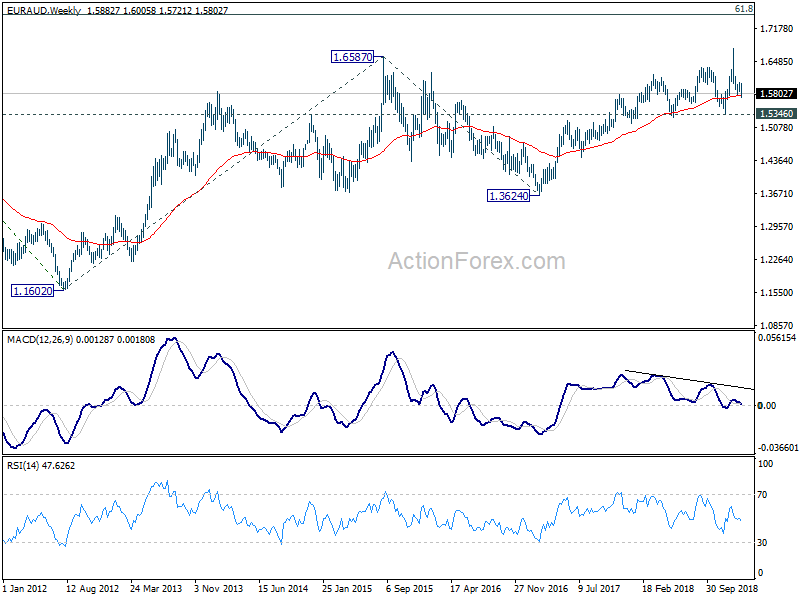
EUR/AUD's fall from 1.6765 resumed last week by taking out 1.5774 support and reached 1.5721. As a temporary low was formed, initial bias is neutral this week first, for some consolidations. Near term outlook will stay mildly bearish as long as 1.6038 resistance holds. Break of 1.5721 will target 1.5346 key support. But break of 1.6038 will indicate completion of the fall and turn bias back to the upside.
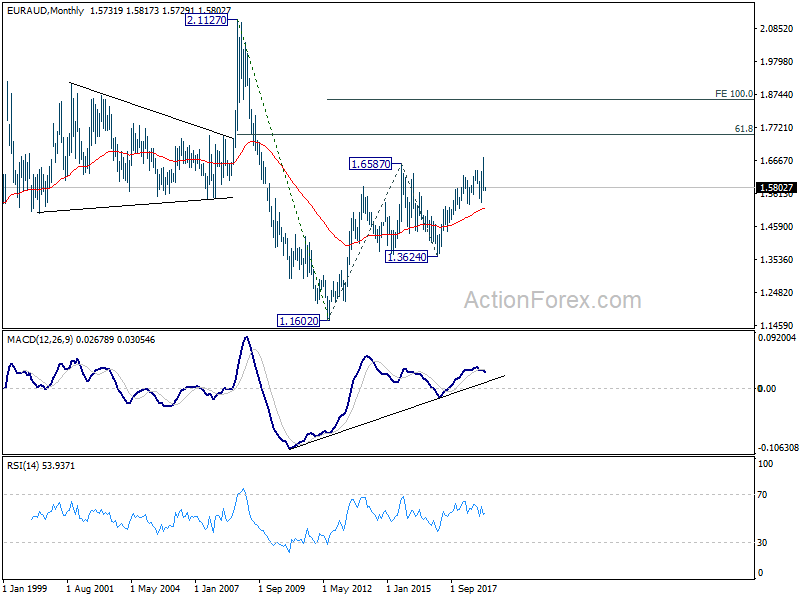
In the bigger picture, the failure to sustain above 1.6587 key resistance (2015 high) argues that up trend from 1.1602 (2012 low) is not ready to resume yet. But still, as long as 1.5346 support holds, outlook will remain bullish. Break of 1.6765 will target 61.8% retracement of 2.1127 (2008 high) to 1.1602 at 1.7488 next. However, firm break of 1.5346 key support will indicate trend reversal, with bearish divergence condition in weekly MACD, and turn outlook bearish.
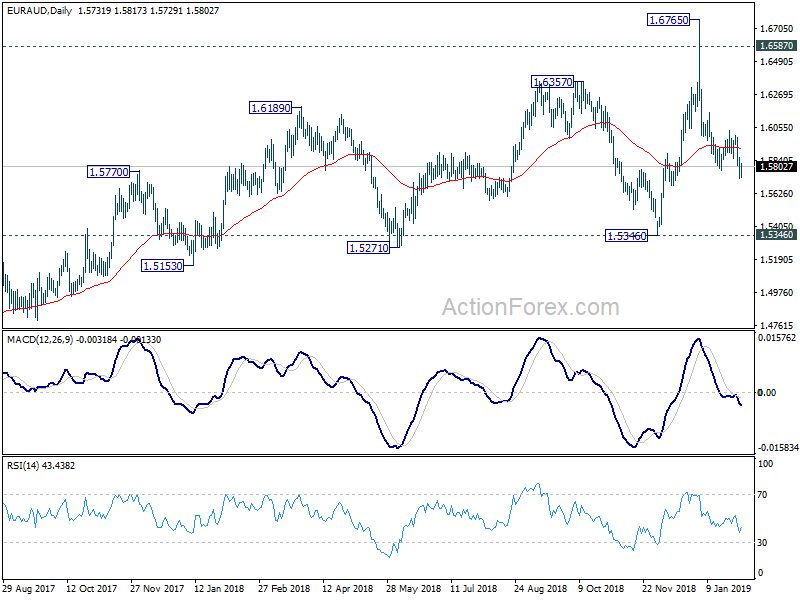
In the longer term picture, the rise from 1.1602 long term bottom (2012 low) is still in progress for 61.8% retracement of 2.1127 to 1.1602 at 1.7488. Firm break there will pave the way to 100% projection of 1.1602 to 1.6587 from 1.3624 at 1.8069. This will remain the favored case as long as 1.5346 remains intact.
EUR/CHF Weekly Outlook
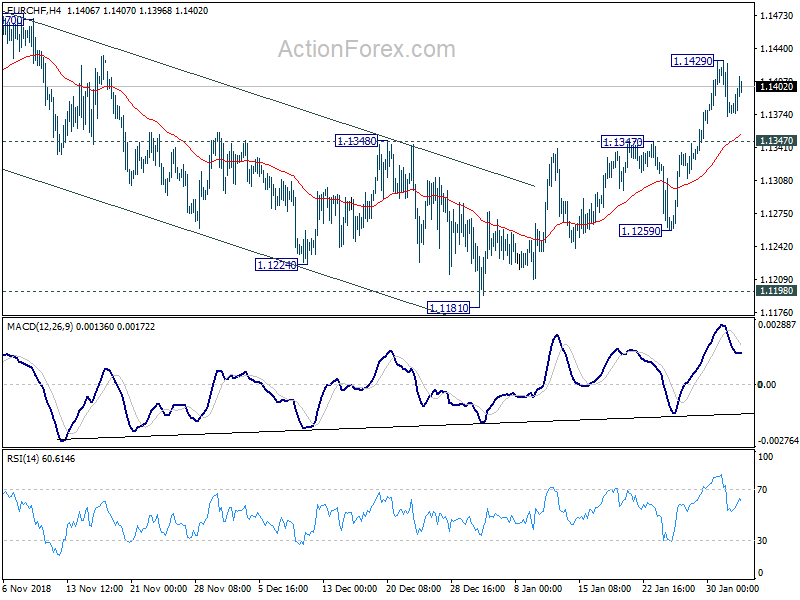
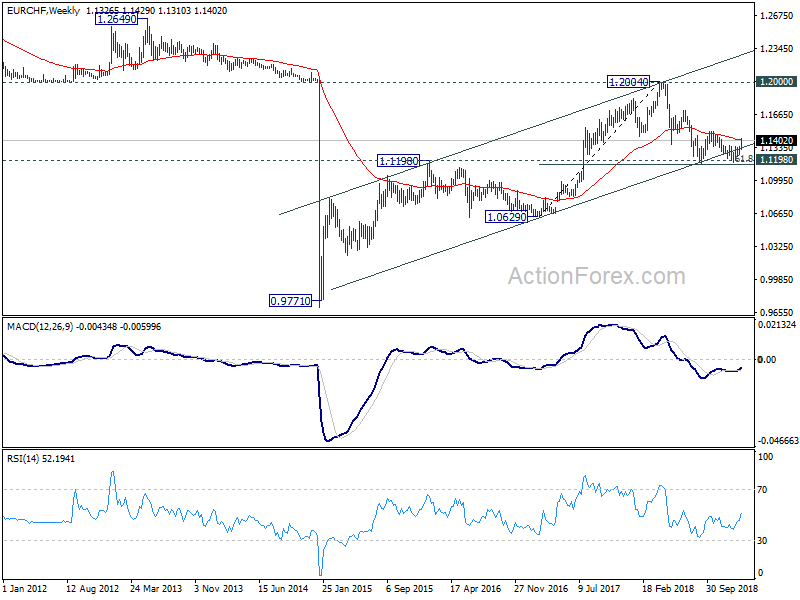
EUR/CHF's strong rally and firm break of 1.1347/8 resistance last week confirmed completion of fall from 1.1501. As a temporary top was formed at 1.1429, initial bias is neutral this week for some consolidation first. But downside of retreat should be contained by 1.1347 resistance turned support to bring another rally. On the upside, break of 1.1429 will extend the rise from 1.1181 to retest 1.1501 key resistance next.
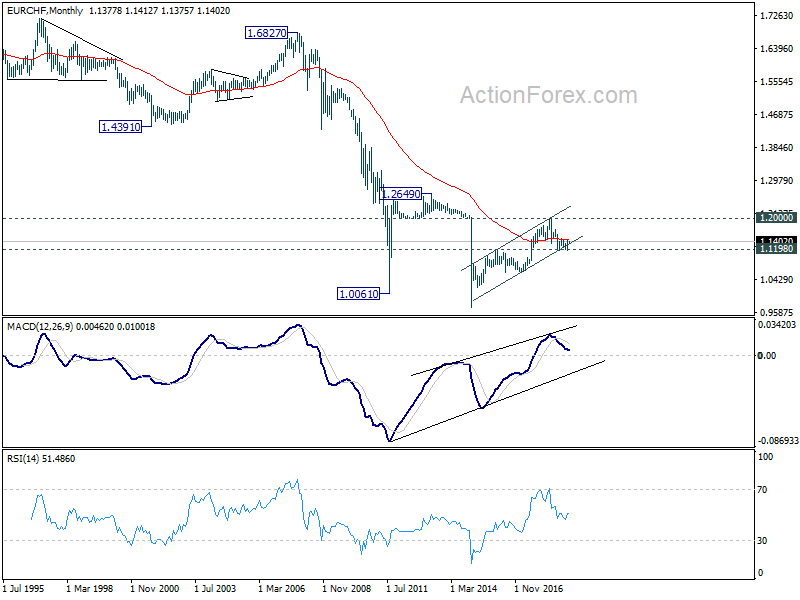
In the bigger picture, price actions from 1.2004 medium term top is seen as a correction only. Downside should be contained by 1.1154/98 support zone to complete it and bring rebound. Decisive break of 1.1501 (38.2% retracement of 1.2004 to 1.1173 at 1.1490) will confirm completion of the correction, on bullish convergence condition in daily MACD, with double bottom pattern (1.1173, 1.1181) Further rise should be seen to 61.8% retracement at 1.1687 and above next.
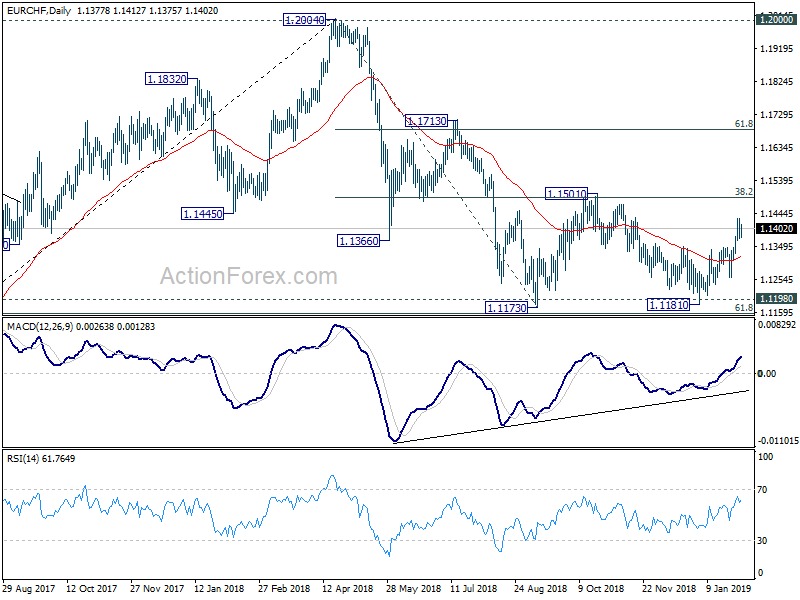
In the long term picture, as long as key support zone of 1.1198 (2016 high) and 61.8% retracement of 1.0629 to 1.2004 at 1.1154 holds, A break of 1.2 key resistance is still expected in the medium to long term. However, sustained break of the mentioned support zone will mark reversal of the long term trend. In that case, 1.0629 key support will be back into focus.
Dollar Down But Not Out after Fed, Oil Lifted Canadian, Iron Ore Boosted Australian
Fed's dovish turn occupied a lot of head lines last week. Stocks were lifted while Dollar was pressured. However, the moves were not as drastic as they could seem to be. There was no upside acceleration in stocks. Treasury yield actually dropped at the long end, indicating that expectations on inflation and economy had not turned despite Fed's patience stance. Meanwhile, Dollar index is just extending recent corrective pull back, also without downside acceleration. The rally in AUD/USD and decline in USD/CAD were more due to rise in iron ore prices and oil prices.
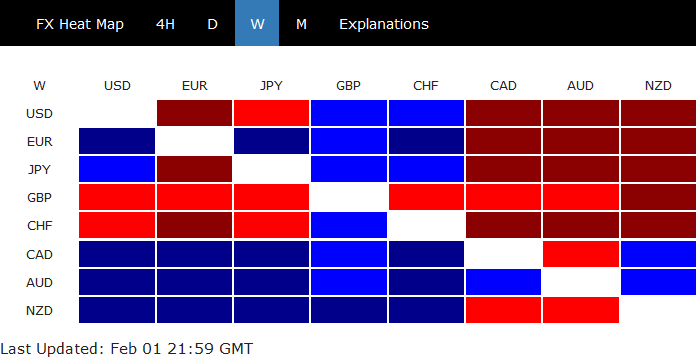
Over the week, Sterling was the weakest one as Brexit enters a new chapter. Within a few days, the UK government might be ready to unveil what alternative proposal on Irish border backstop they have, to persuade EU to reopen withdrawal agreement negotiation. Swiss Franc was the second weakest. And Dollar was just the third weakest. Australian, Canadian, and New Zealand Dollar were the strongest in order.
Markets expect Fed to stand pat through 2019
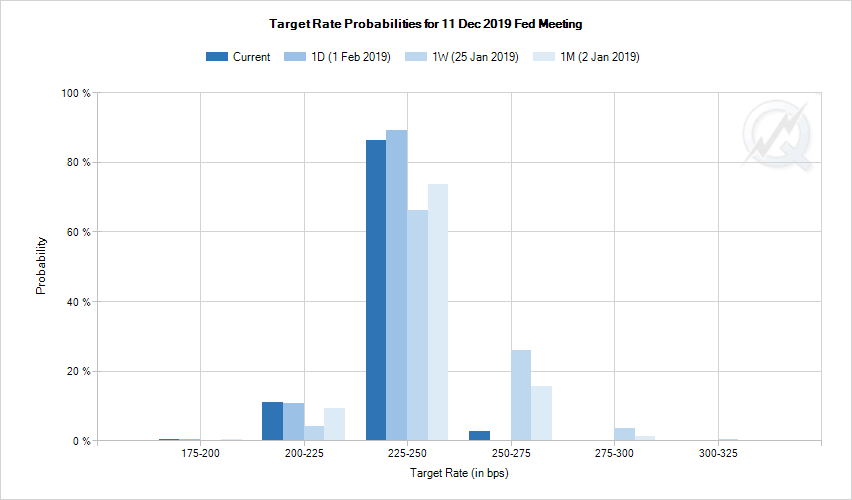
To recap, FOMC left federal funds rate unchanged at 2.25-2.50% as widely expected. The accompanying statement contained some dovish changes. Firstly, Fed dropped the language regarding "some further gradual increases in" interest rates. Secondly, Fed said it would be "patient as it determines what future adjustments" to the policy rate, due to "global economic and financial developments and muted inflation pressures". Thirdly, Fed also noted it's "prepared to adjust any of the details for completing balance sheet normalization in light of economic and financial developments". No detail was provided for the change in balance sheet reduction plan. But Fed is at least ready to cut it short if needed.
After the meeting, Fed funds futures are pricing in 86.1% chance of no change through 2019, higher than 73.5% a month ago. Chance of a rate cut to 2.00-2.25% by December rose slightly to 10.9%, but was not far from 9.2% a month ago. Chance of a hike to 2.50-2.75% dropped to just 2.6%, comparing to 15.6% a month ago. While both pricing are low, chance of a cut is actually higher than chance of a hike. The overall picture didn't change much in January.
Stocks lifted, without upside acceleration
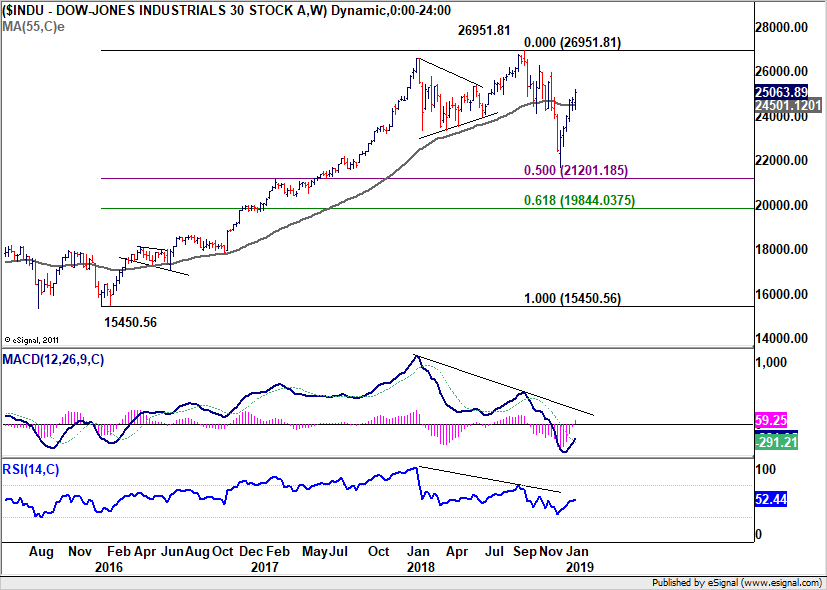
The reactions in the stocks markets to Fed was positive but not overwhelming. DOW extended recent rally to close at 25063.89, and reclaimed 25k handle. But structurally, there is no clear upside acceleration. We'd expect DOW to start losing momentum as it approaches 78.6% retracement of 26951.81 to 21712.53 at 25830.60. Meanwhile, break of 24323.94 support will argue that the rebound has completed earlier than expected.
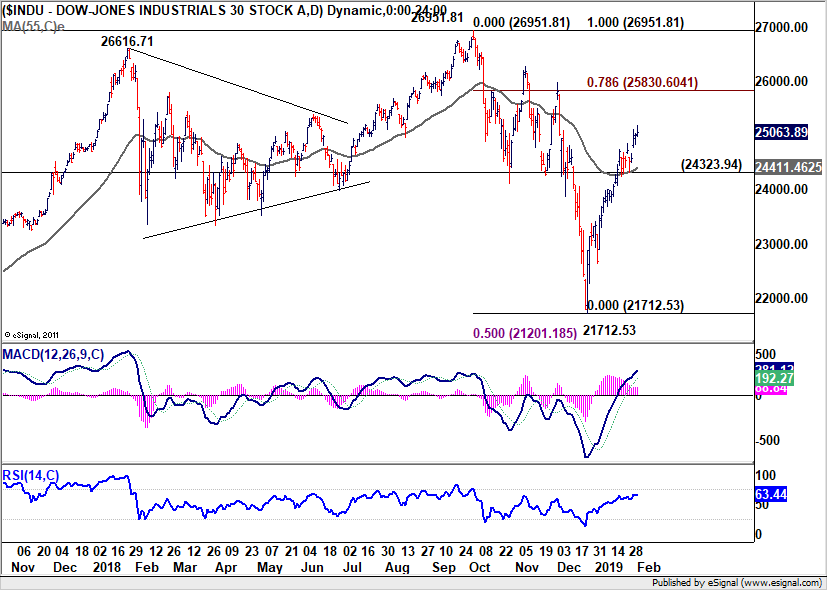
Overall, DOW is in a long term corrective pattern, consolidating the up trend from 15450.56. It would extend for a while, with at least another medium term decline.
10-year yield dropped after Fed, but may find support soon.
10-year yields has actually dived after Fed and reached as low as 2.626. Despite recovering to close at 2.691, TNX was held below 2.7 handle.
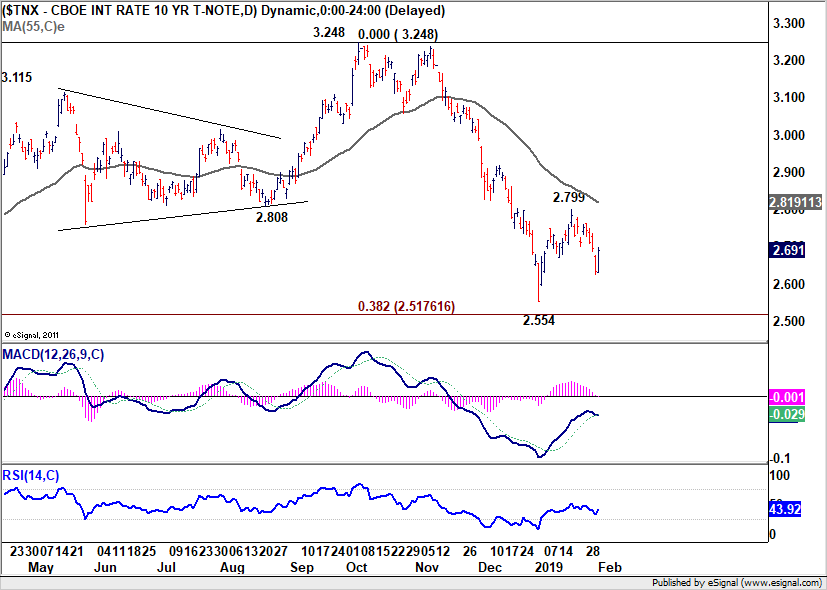
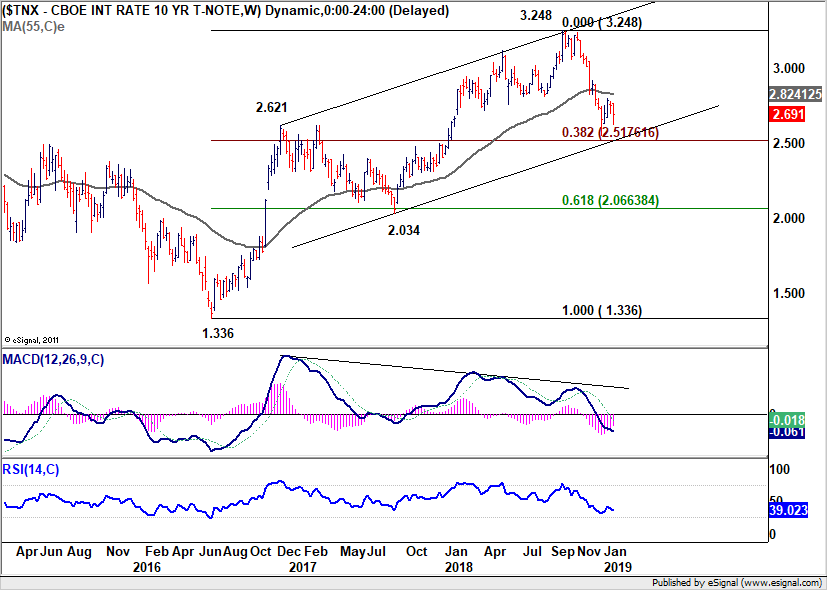
At this point, another fall in TNX remains likely as long as 2.799 resistance holds. But downside potential should be limited as it's close to 38.2% retracement of 1.336 to 3.248 at 3.517, which is close to long term channel support too.
Dollar index extending correction from 97.71
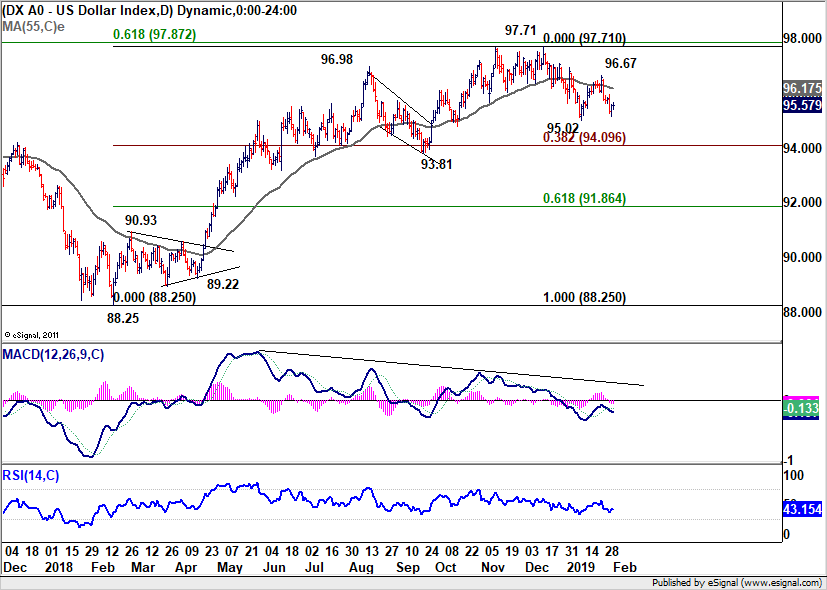
Dollar index dropped further to as low as 95.16, but was held above 95.02 and recovered to close at 95.57. Overall outlook is unchanged that price actions from 97.71 are corrective up trend from 88.25. Hence, while deeper decline is in favor for the near term, downside should be contained by 93.81/94.09 support zone (38.2% retracement of 88.25 to 97.71 at 94.09) to bring rebound.
WTI crude oil breaks 55, lifted Canadian
Canadian Dollar was the second strongest for the week, partly thanks to weakness in Dollar. But more importantly, the Loonie was helped by surge in oil prices. Additionally, a Reuters survey showed that production from OPEC dropped by -0.89m bpd in January to 30.98m bpd. It's the largest monthly decline in two years. With the support from oil prices, Loonie will also look into this week's Canadian job data for more strength.
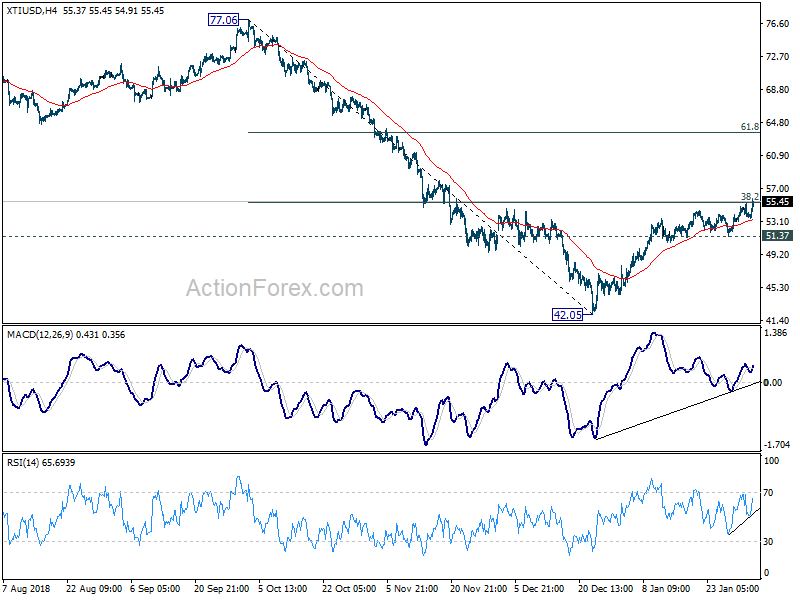
WTI crude oil's price actions since mid-January now proved to be just consolidations, rather than setting up a reversal. WTI resumed the rise from 42.05 last week and rose to close the week strongly at 55.45. 4 hour MACD and RSI suggests that the rebound from 42.05 low is picking up momentum again. Focus is now on 38.2% retracement of 77.06 to 42.05 at 55.42. Firm break will pave the way to 61.8% retracement at 63.68. And this bullish base will be slightly favored as long as 51.37 support holds.
Aussie followed soaring iron ore higher
Australian Dollar's rally was more related to surge in iron ore prices, the country's top exports. Driving price higher was the concern on Brazilian supply. In response to the collapse of a tailings dam at its Feijao iron ore mine last weekend, Brazilian miner Vale announced that it will decommission all of its upstream tailings dams over the next three years. That could sideline around 2.5% of the seaborne trade.
Also, the China steel industry PMI jumped sharply to 51.5 in January, up from 45.6 in December. In particular, new orders subindex rose to 53.4, up from 39.5. The data suggests improvement in the sector with surge in steel demand.
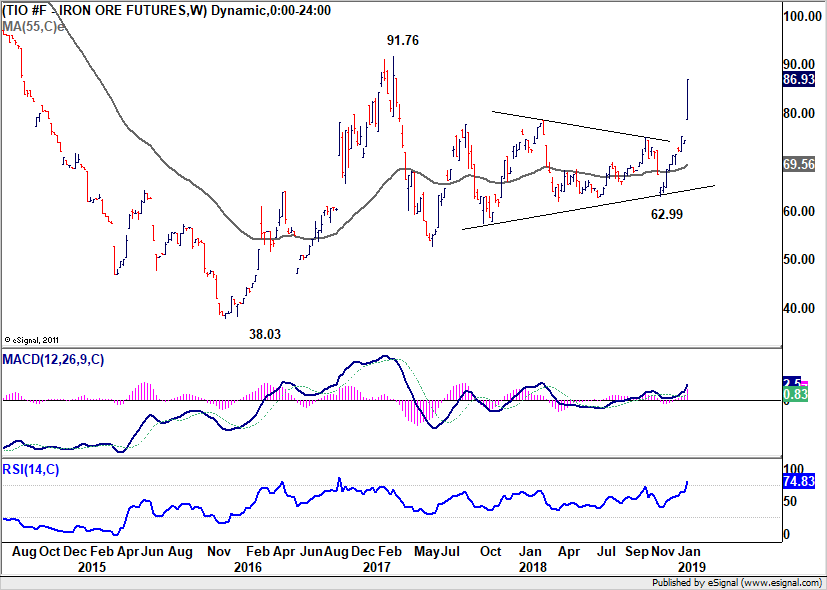
Iron Ore 62% FE,CFR CHINA jumped to 86.93 last week, up 16.6%. AUD/USD's fate, and whether it could break 0.74 handle, will depend more on how far iron ore could go. There is much chance of hawkish surprise from RBA this week. Indeed, there is dovish potential in RBA's new economic projections.
Position trading strategy
Our buy USD/CHF at 0.9880 order (as noted last week) was again not filled as USD/CHF dipped to 0.9905 only. Fundamentally, we'd like to point out again that despite Fed's dovish turn, Dollar wasn't that weak overall. As mentioned above, the dollar index is just extending recent consolidation, with no clear sign of trend reversal yet. Markets are just pricing in Fed to stand pat through 2019, which they have been doing that for nearly a month already. There is chance of a Dollar comeback should 10-year yield rebounds from the above mentioned channel support. And Swiss Franc was indeed the weaker one.
Technically, the rise from 0.9716 to 0.9994 is apparently a five wave impulsive sequence. That suggests price actions from 0.9994 are merely corrective in nature. And rise from 0.9716 should resume after the correction from 0.9994 completes.
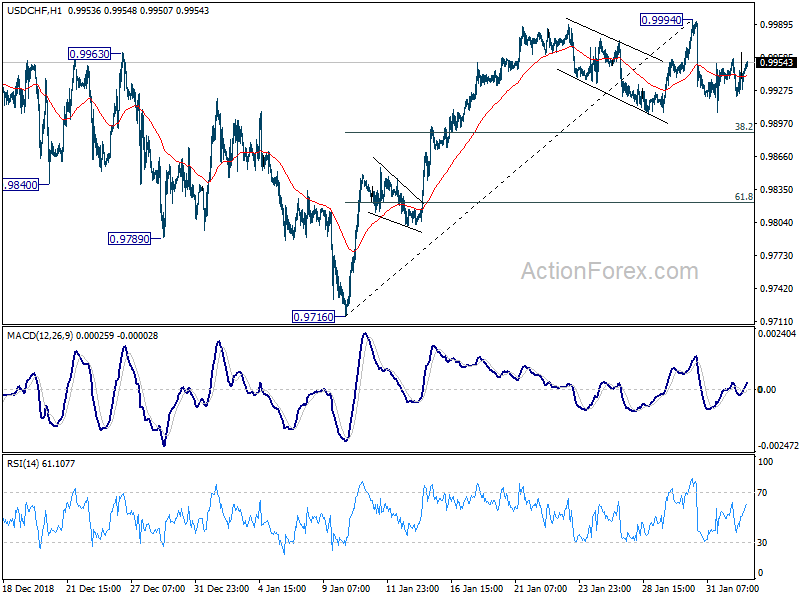
In the bigger picture, we maintain the view that corrective fall from 1.0128 has completed at 0.9716 after drawing support from medium term trend line, on bullish convergence condition in 4 hour MACD. Rise from 0.9716 is likely resuming whole up trend from 0.9186.
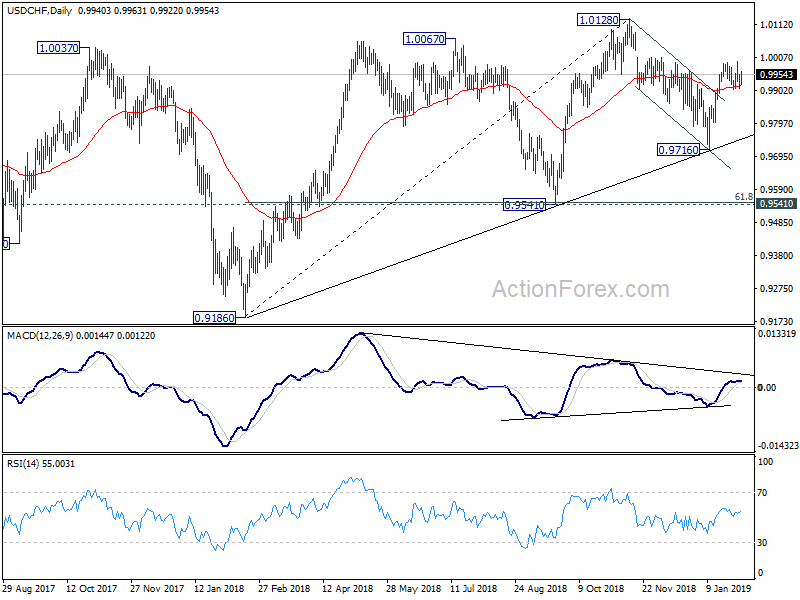
So, we'll maintain the strategy. That is, buy USD/CHF at 0.9880 (slightly below 38.2% retracement of 0.9716 to 0.9994 at 0.9888). Stop will be placed at 0.9810, (slightly below 61.8% retracement at 0.9822). Target is placed at 1.0300, as we expect the upside to extend to take on 1.0342 resistance (2017 high).
As for other strategies, we'd firstly avoid Sterling for the neverending drama. We'd a bit skeptical on whether WTI crude oil could extend rebound through 55.42 key fibonacci level decisively. And the surge in iron ore price looks stretched while there is dovish possibility in RBA statement economic projections. Thus, we'd avoid both Canadian and Australian. We're still viewing Yen's rebound from the flash crash low as correction. So we'd prefer not to ride on it, but wait to trade on a reversal later. Well, so, we'll keep our hands off other strategies first.
AUD/USD Weekly Outlook
AUD/USD's rebound from 0.6722 resumed last week by taking out 0.7235 resistance to as high as 0.7295. As a temporary top is formed there, initial bias is neutral this week first. On the upside, above 0.7295 will target 0.7393 cluster resistance (61.8% projection of 0.6722 to 0.7235 from 0.7076 at 0.7393). We'd expect strong resistance from there to limit upside to complete the rebound from 0.6722. On the downside, break of 0.7180 minor support will turn bias back to the downside for 0.7076 support. However, sustained break of 0.7393 will indicate bullish reversal and target 100% projection at 0.7589 next).
In the bigger picture, as long as 0.7393 resistance holds, we'd treat fall from 0.8135 as resuming long term down trend from 1.1079 (2011 high). Decisive break of 0.6826 (2016 low) will confirm this bearish view and resume the down trend to 0.6008 (2008 low). However, firm break of 0.7393 will argue that fall from 0.8135 has completed. And corrective pattern from 0.6826 has started the third leg, targeting 0.8135 again.
In the longer term picture, prior rejection by 55 month EMA maintained long term bearishness in AUD/USD. That is, down trend from 1.1079 (2011 high) is still in progress. Sustained break of 0.6826 will target 0.6008 low and then 61.8% projection of 1.1079 to 0.6826 from 0.8135 at 0.5507.
Summary 2/4 – 2/8
Monday, Feb 4, 2019
[php_everywhere instance="1"]
Tuesday, Feb 5, 2019
[php_everywhere instance="2"]
Wednesday, Feb 6, 2019
[php_everywhere instance="3"]
Thursday, Feb 7, 2019
[php_everywhere instance="4"]
Friday, Feb 8, 2019
[php_everywhere instance="5"]
China Weekly Letter: On Track for a Trade Deal, First Signs of a Bottom in Growth
- Top-level trade talks end on a positive note - a deal is in sight as soon as March
- Charges against Huawei underline tensions in tech war - how far will the US go?
- Chinese PMI points to weakness - but tentative signs of a bottom in Q1
Trade talks end on an upbeat note
The high-level trade talks in Washington this week were a litmus test of the ability of US and China to make a deal. It was time to put the tough questions on the table regarding intellectual property rights, forced technology transfer, industrial policy and non-tariff barriers. However, the meeting ended with very positive statements from both sides, see US-China trade: A deal in sight - look out for Xi-Trump meeting(s), 1 February, for more details. The US Trade Representative Robert Lighthizer and Treasury Secretary Stephen Mnuchin are now set to go to Beijing in mid-February for talks and Trump has said that the last difficult questions will be resolved by Trump and Xi at a meeting in 'the near future'.
The tone in an oval office meeting between Trump and the US and China trade teams was cordial. Trump described a letter from Xi Jinping which was read out as 'beautiful'. Trump said there had been 'tremendous progress' and it 'will be the biggest deal ever made'. Robert Lighthizer emphasized 'enforcement, enforcement, enforcement' in his comment at the meeting but also pointed to progress in the talks. Fox News published a video on 31 January.
Adding to the positive picture this week, China is fast tracking a new foreign investment law that among other things will ban the transfer of technology and improve protection of intellectual property rights, see Xinhua 29 January and Reuters 30 January.
Comment. We are getting more confident that we are closer to a deal and that the probability of a deal in March has increased. The intense efforts put into the talks at the highest level - including from Trump and Xi - suggest that both sides are very keen to get the work done. It will give China more breathing space in tackling its debt challenges and Trump can present himself as the great deal maker to the American population going into the 2020 election campaign with a package that will benefit key voters in swing states. At the meeting in the oval office, Trump emphasised several times the large amount of soybeans that China will now buy and how it would benefit the farmers.
US taking a tough stance on Huawei - how far will it go?
While the prospect of an end to the trade war has improved, the tech war is nowhere near an end. This week the US raised the stakes by filing charges against Huawei and formally requesting extradition of Huawei's CFO Meng Wengzhou from Canada.
The prosecution against Huawei concern two areas: 1) committing bank fraud by violating US sanctions against Iran and 2) stealing trade secrets from an American rival (T-Mobile US Inc.) in a case that goes back to 2014, see Bloomberg28 January. Huawei has denied the allegations of bank fraud and stated that the dispute with T-mobile US Inc. was settled in 2017, see Geekwire, 17 May 2017, for more on the settlement. The US indictment revealed that the FBI interviewed the Huawei founder Ren Zhengfei in 2007 about the company's dealings with Iran. According to the indictment Ren Zhengfei identified as Individual-1 'falsely stated' to the FBI that Huawei had not dealt directly with any Iranian company. It suggests even Ren could be charged as well, see Washington Post, 29 January. The US charges also concern a claim that Huawei offered bonuses to employees who stole confidential information from other firms.
A spokesman for China's Ministry of Industry and Information Technology said that the US had no proof to back up the charges and called them 'unfair and immoral'. China's Foreign Ministry said in a statement that Beijing would resolutely protect the interests of Chinese companies.
Comment. Trade deal or not, it is clear the tech war will rage on. Some US politicians have argued for a ban of selling microchips to Huawei, which could cause severe disruption for Huawei in the short term. However, a step like that would in our view quickly back-fire and possibly trigger a consumer boycott of US goods in China. For more on Huawei and the tech war see this article in Foreign Affairs: Is Huawei a pawn in the trade war? 30 January.
Chinese PMI data weak - but rays of light hint at bottom soon
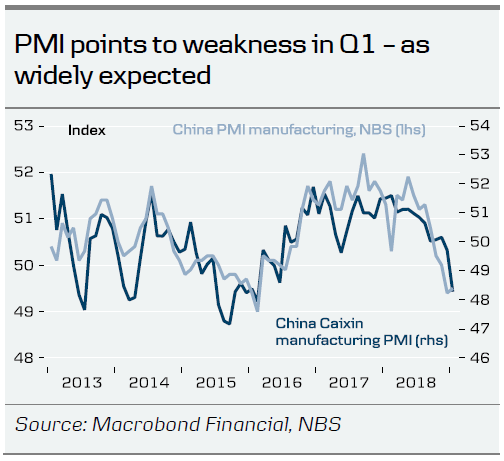
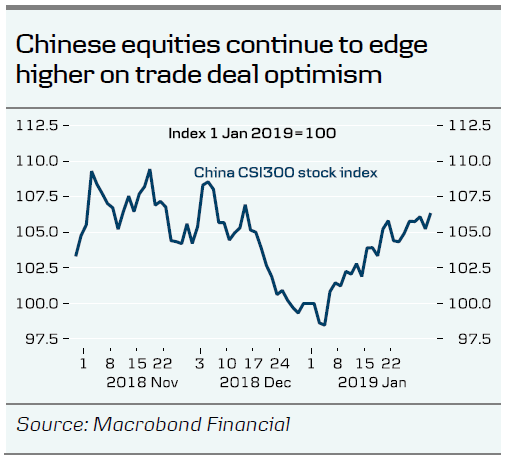
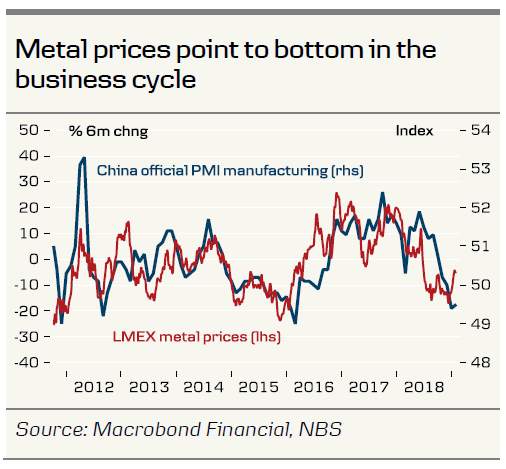
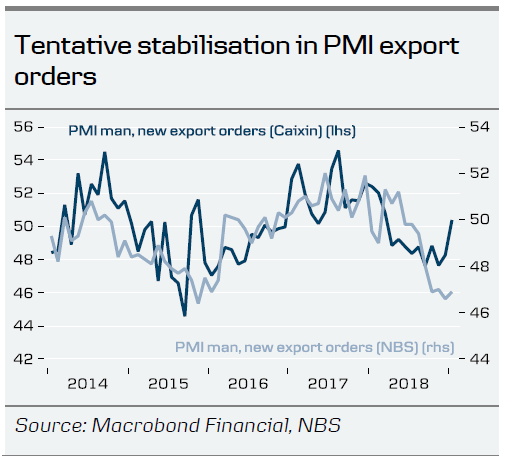
Both the private and official version of PMI manufacturing was released this week. The PMI is one of our favourite gauges of the state of the Chinese business cycle. The official version surprised a bit to the upside whereas the private version declined sharply. Some may say this is a sign that the official data are unreliable. However, it is actually the case that the official version has dropped much more in previous months and the private version is simply catching up with this weakness (see top chart on page 1). On a positive note, the export orders in both sets of PMI point to stabilisation/bottom and the same picture emerges when looking at metal prices, which are normally a good real-time indicator for Chinese activity (China consumes 50% of global metals).
China announced further stimulus for consumers this week offering subsidies on cars and home appliances, see Reuters 29 January. There were no details, though, and it is unclear how significant it is. We still await an announcement on further tax cuts.
Comment. We still look for a bottom in the Chinese business cycle in Q1 followed by a moderate recovery. The drivers should be a US-China trade deal and Chinese stimulus.
Other news of the week
Huawei is set to unveil a 5G foldable smartphone, see People's Daily 26 January.
In a Senate hearing, US intelligence chiefs stated that China and Russia pose the biggest threat to the US and are more aligned than they have been in decades, see Reuters 29 January.
China continues to send warnings to Taiwan. In a China Daily Editorial it said 'nationhood' talk only leads it to abyss. On Saturday China called on the US to abide by the one-China policy after US warships sailed through the Taiwan Strait, see People's Daily 26 January. It was the fourth such 'Freedom of Navigation' since summer.
China released footage of the so-called 'Guam killer' ballistic missile for the first time on state TV amid intensified US-China military rivalry, see SCMP 28 January.
Warning to China - Germany may be about to get tough, SCMP 26 January