

Sample Category Title
Weekly Economic and Financial Commentary: Growth Set to Moderate, Yet Continue
U.S. Review
Growth Set to Moderate, Yet Continue
- With the government doors having re-opened on Monday, a more patient stance from the Fed and the 100th consecutive month of employment gains, developments have provided some comfort to fears of an impending recession.
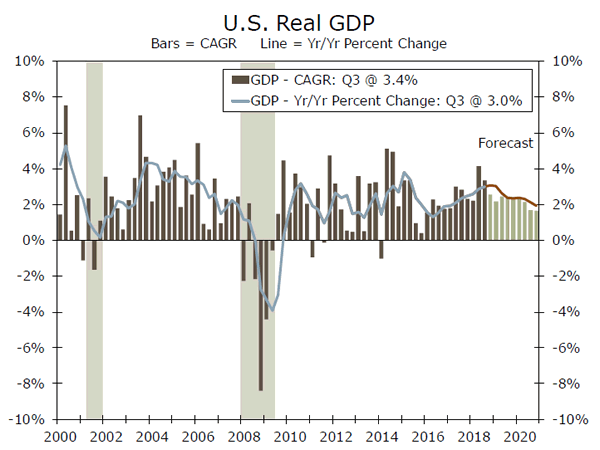
- Our visibility of economic developments remains clouded by the continued delay of indicator releases, but with the data we have received, economic growth looks set to continue, albeit at a more moderate pace.
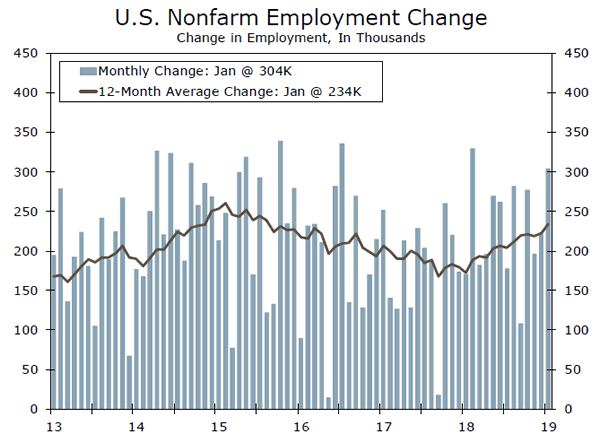
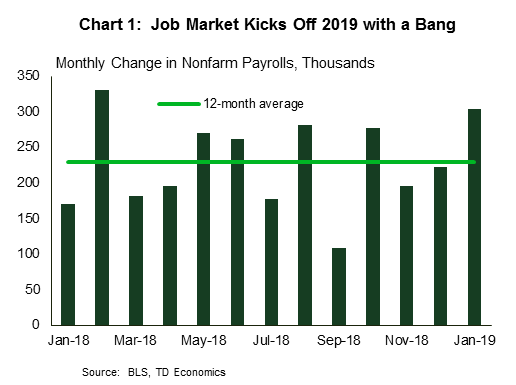
- Nonfarm payrolls added 304,000 jobs in January, but the trend is expected to slow over the course of this year as economic growth moderates.
Growth Set to Moderate, Yet Continue
The longest partial government shutdown on record came to an end this past weekend, but with only a tentative solution that funds the portion of the government that was closed until February 15. Based off of what has already transpired, we estimate that the shutdown will directly reduce real GDP growth in Q1-2019 by about 0.3 percentage points, with a rebound of a similar magnitude likely in Q2. While the environment remains uncertain, we direct interested readers to our update on the subject, which discusses some possible paths forward.
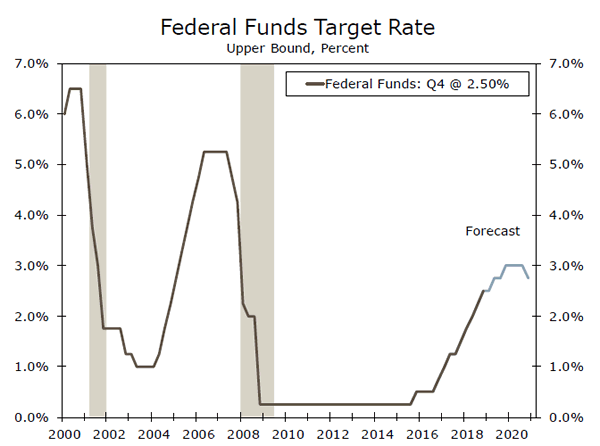
Later in the week, the Federal Open Market Committee (FOMC) held its first policy meeting of 2019. As was widely expected, and in what was a unanimous decision, the Fed decided to keep its target range for the fed funds rate unchanged at 2.25% to 2.50%. Perhaps the most notable takeaway was the generally dovish tone of the policy statement. The committee removed its forward guidance, and even added a key word to its outlook for policy; patient. The committee said it "will be patient as it determines what future adjustments to the target range" may be appropriate. We still look for the FOMC to hike rates 50 bps more in this cycle, once in June and another in H2-2019. For further reading on this topic, please see our Interest Rate Watch section on page 6.
Even with the government re-opening its doors on Monday, the release of economic data remains delayed. GDP and personal income are two of the indicators postponed this week, which continues to constrain our visibility of economic developments. With the data we have received, economic growth looks set to continue, albeit at a more moderate pace.
The U.S. Department of Labor has not been impacted by the shutdown, and thus arguably the most closely watched indicator was released on time today–nonfarm payrolls. Market participants were in store for a surprise this morning, with nonfarm payrolls having risen a whopping 304,000 in January. This surpassed analysts' expectations, with the consensus estimate at an increase of only 165,000. But, the solid report came with a downward revision to December payrolls of about 90,000 jobs. The January gain in employment, nonetheless, provides support that economic growth remains stable. Overall, we expect the trend in hiring to slow as economic growth moderates and the tight state of the labor market makes it difficult to fill vacant positions. But, if employment gains remains steady, our current assumption of another rate hike in the first half of the year may not look all that unlikely, despite the Fed demonstrating it is on hold for the foreseeable future. One caveat to that interpretation, however, is the subdued gains in average hourly earnings and the lack of upward pressure on inflation.
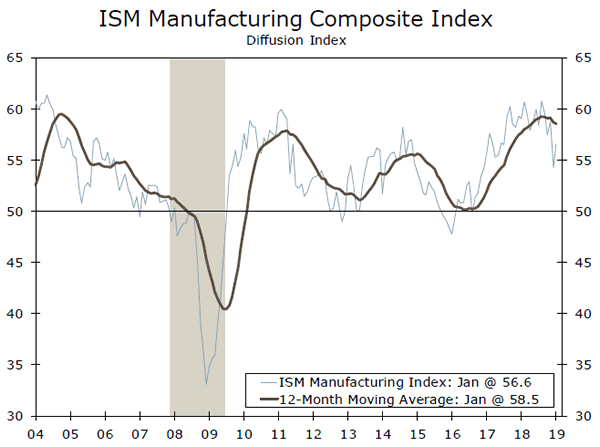
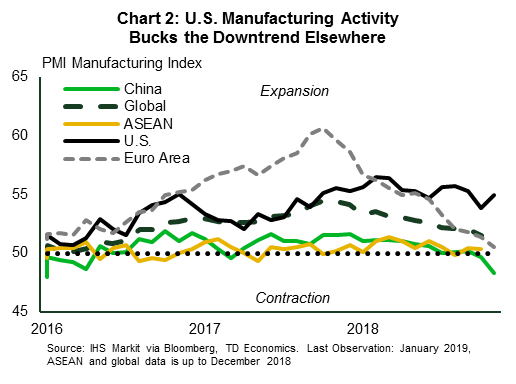
Later this morning, we turned our attention to the manufacturing sector. The Institute for Supply Management (ISM) released its fresh survey data for January. The ISM manufacturing index rebounded to 56.6 in January, after posting its largest monthly decline since 2008 in December. While this rebound likely has allied fears of a rapid deterioration in the factory sector, the road for the manufacturing sector ahead remains a bumpy one.
U.S. Outlook
Factory Orders • Monday
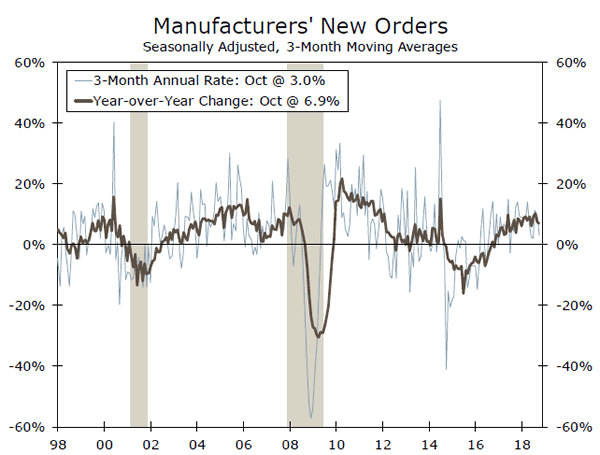
Manufacturing activity appears to have softened over the past couple of months, with the ISM manufacturing index slipping to 56.6 from 58.8 as recently as November. Yet, survey data on the manufacturing sector had already been running ahead of "hard" data, making it unclear if actual orders have also been faltering or if the ISM has merely fallen back in line.
The November factory orders data were a causality of the government shutdown. Although dated at this point, the November factory orders data will help fill in the pieces about the degree to which the manufacturing sector is losing momentum. We estimate orders fell 0.5% in November on a nominal basis. Durable goods orders are already reported to have risen 0.8% in November. Orders for nondurables, however, the new information in this report, were likely hit by declining oil prices weighing down the value of petroleum-related products over the month.
Previous: -2.1% Wells Fargo: -0.5% Consensus: 0.3% (Month-over-Month)
ISM Non-Manufacturing • Tuesday
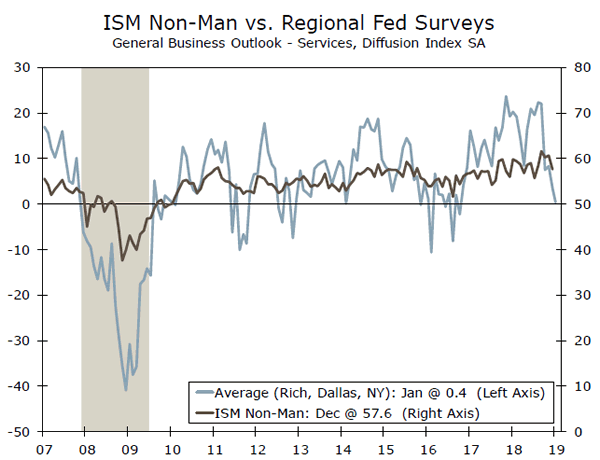
The ISM non-manufacturing index shed 2.4 points in December, indicating somewhat slower growth. That said, at 58.0, the index was consistent with the service sector expanding at a solid rate.
The January reading, however, is unlikely to paint as favorable a picture. The government shutdown likely hit the service sector particularly hard. Payment disruptions to contractors or businesses patronized by effected workers are expected to have weighed on sales and new orders. An average of Fed service-sector PMIs have come down sharply in recent months, including a 3-point drop in January.
A sharp pullback may not be too concerning for the Fed if details suggest it was attributable to the shutdown and therefore ripe for reversal over the next few months. Another strong print would be consistent with the economy motoring along despite recent headwinds, supporting further Fed tightening later this year. Previous: 58.0 Wells Fargo: 56.0 Consensus: 57.0
Trade Balance • Wednesday
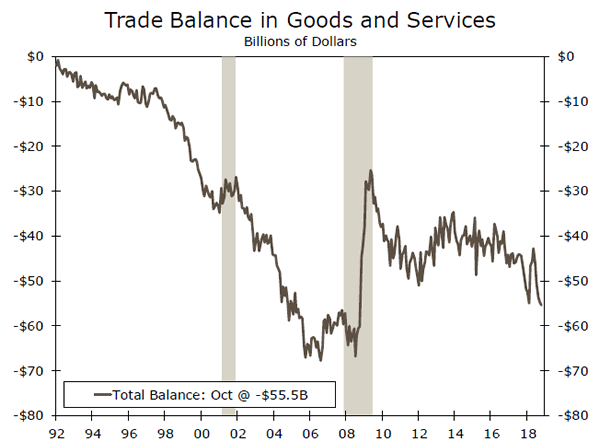
Trade figures for November are to be released next week after a nearly one-month delay due to the partial government shutdown. In October, the trade deficit widened by $900 million to a total of $55.5 billion. We expect to see that reversed for November, with the deficit narrowing to $54.3 billion.
Nevertheless, the gap between imports and exports looks on track to be significantly wider in the fourth quarter. Continuing trade tensions are weighing on exports, particularly to China. At the same time, importers late in the year were likely trying to get ahead of potential tariff increases set for January. More fundamentally, solid U.S. consumer spending has supported demand for imported goods. We estimate trade will be a significant drag on fourth quarter GDP, which was originally scheduled to be released this past Wednesday.
Previous: -$55.5 Billion Wells Fargo: -$54.3 Billion Consensus: -$54.0 Billion
Global Review
Eurozone Economic Growth Remains Weak
- Data released this week showed the Eurozone economy grew just 0.2% on a sequential basis in Q4-2018, while the year-overyear pace of growth slowed to just 1.2%. Italy fell into recession, while the slowdown appears to be broadly based across various sectors of the economy.
- U.K. Parliament considered a number of paths forward for Brexit, but did not appear to be in favor of any proposals that were palatable to the European Union. Parliament is scheduled to vote on May's deal again on February 14, and another failure to pass the deal could see the U.K. push for an extension of the March Brexit deadline.
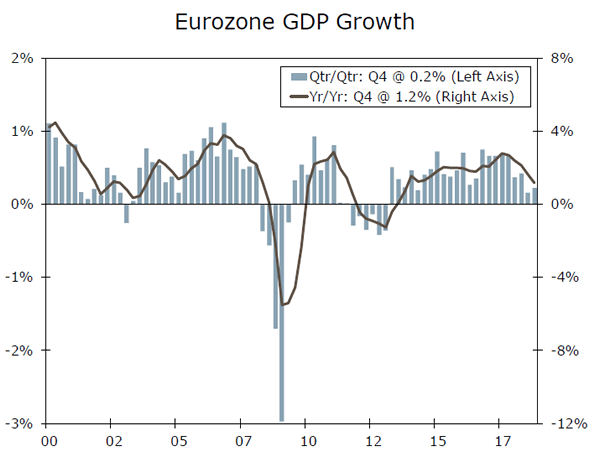
Eurozone Growth Remained Soft in Q4
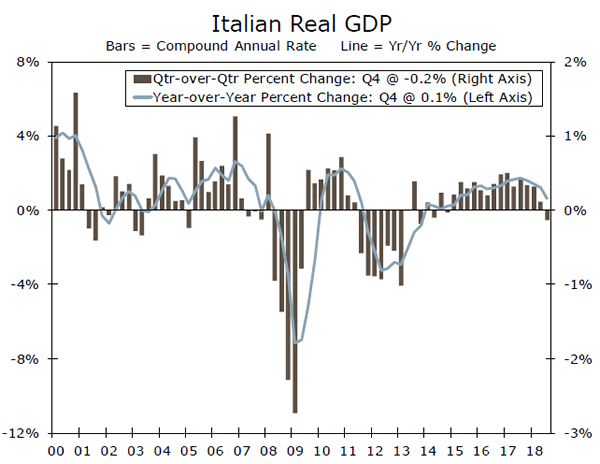
Data released this week confirmed that Eurozone economic growth remained soft at the end of 2018. Real GDP in the Eurozone rose just 0.2% on a sequential basis in Q4, while the year-over-year pace of growth eased to 1.2%, the slowest rate since 2013. Additional details on the slowdown are scant at this point, but the countrylevel data and higher frequency activity data offer some clues. A particular standout in the country-level data was Italy, which saw a 0.2% (not annualized) sequential drop in real GDP after a 0.1% decline in Q3, suggesting the economy fell into a technical recession in the second half of 2018. Meanwhile, data suggest the slowdown has been broadly based across sectors. In December, German retail sales fell 4.3% month over month, the largest decline since 2007, and French consumer spending fell 1.5% during the month. Meanwhile, activity figures in the industrial sector have also been worrying, as industrial output fell 1.7% month-overmonth in November after a 0.1% drop in the prior month. In short, the Eurozone is showing broad-based weakness, and the European Central Bank (ECB) has taken note. Last week, the ECB acknowledged that economic risks had moved to the downside, while policymakers have become more vocal in their concerns around the pace of economic growth. Accordingly, we have downgraded our GDP growth forecast for the Eurozone to 1.5% in 2019 and 1.4% in 2020. Meanwhile, we still see the first ECB rate hike in December, but are pushing back the timing of the following hike to June from March.
Elsewhere in Europe, U.K. Parliament held a series of votes on various paths forward for the Brexit process. The only proposal it approved was one aimed at sending Prime Minister Theresa May back to Brussels to renegotiate the Irish border backstop, and lawmakers voted against a proposal to delay the Article 50 deadline of March 29. However, E.U. policymakers have made it clear that they are unwilling to renegotiate the backstop, and prefer instead to consider a delay in the March deadline. In other words, the U.K. and E.U. are on entirely different pages. Ultimately, we expect something very close to May's current withdrawal deal to be passed by U.K. Parliament—the only question is timing. May is expected to hold another vote on her deal on February 14, and if the deal is not approved this time, the U.K. might capitulate and ask for an extension of the March deadline as far as July.
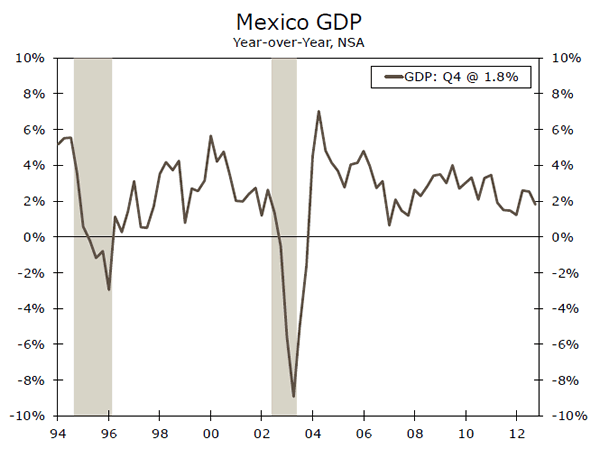
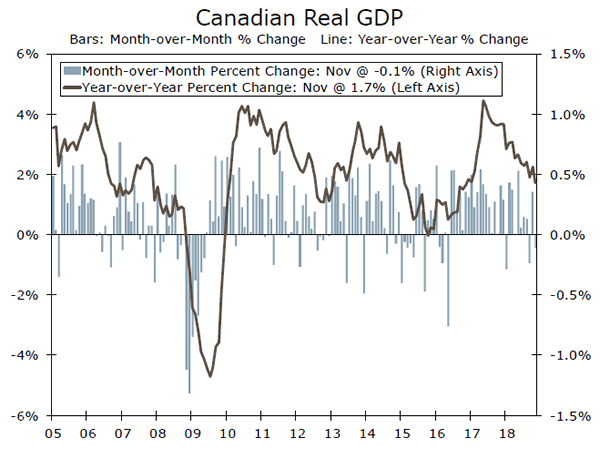
Turning back to global economic data, the news were fairly mixed this week. Mexico's Q4 GDP growth figures surprised to the downside, as the year-over-year pace of growth slowed to 1.8%. Meanwhile, Canada's GDP figures printed largely as expected, with a 0.1% sequential drop in November. Canadian GDP growth has clearly slowed in recent months, and the drop in oil prices has likely played a role. Last but not least, China's January PMI figures were a bit better than expected—the manufacturing PMI stayed below 50 but unexpectedly ticked higher to 49.5, while the services PMI climbed to 54.7. We still look for Chinese economic growth to slow going forward, but reasonably stable sentiment figures, particularly in the services sector, suggest a collapse in activity is not imminent.
Global Outlook
Eurozone Retail Sales • Tuesday
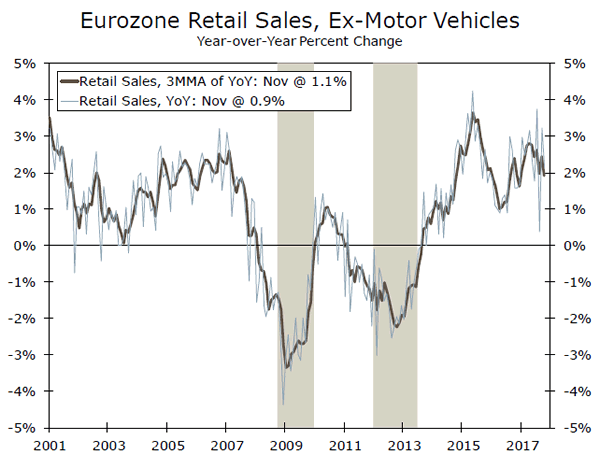
Eurozone economic weakness has been a key theme in recent months, and one that has garnered the attention of European Central Bank (ECB) policymakers. At the latest ECB policy announcement, the statement acknowledged that economic risks have moved to the downside, while there has been increasing talk of a potential economic recession in the Eurozone.
Along those lines, recent data from the consumer sector have been discouraging. In December, German retail sales plunged 4.3% month over month, while French consumer spending fell 1.5% during the month. These sharp declines in consumer activity suggest risks are to the downside for next week's Eurozone retail sales print, which will likely only add to ECB policymakers' concerns around the slowdown in activity in the currency bloc.
Previous: 0.6% Consensus: -1.6% Month-over-Month
Bank of England • Thursday
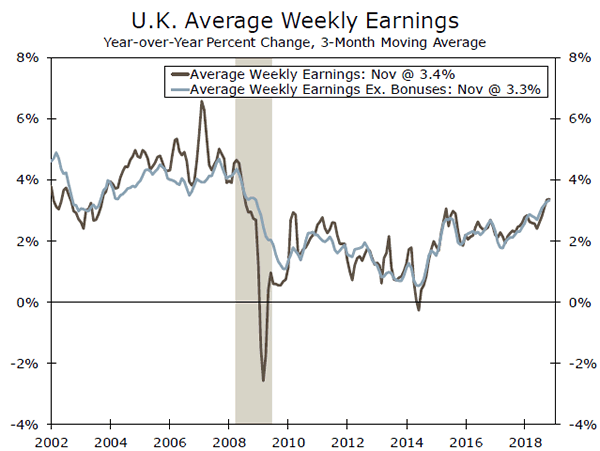
The Bank of England (BoE) has been firmly on hold since August against a backdrop of uncertainty over Brexit. However, there have been increasing signs of building price pressures within the U.K. economy, and BoE policymakers have taken note. It is our sense that were the cloud of Brexit uncertainty not hanging over the U.K. economy, the BoE likely would have raised rates an additional 25 bps since August to stave off incipient wage and broader inflation pressures.
We remain of the view that the BoE will raise rates twice this year, a view that is predicated on a smooth resolution to Brexit uncertainty by the March 29 deadline. However, a delay in the Brexit process could lead us to change that view to one or zero rate hikes, unless a decisive plan emerges within the U.K. government to resolve Brexit uncertainty.
Previous: 0.75% Wells Fargo: 0.75% Consensus: 0.75%
Canada Employment • Friday
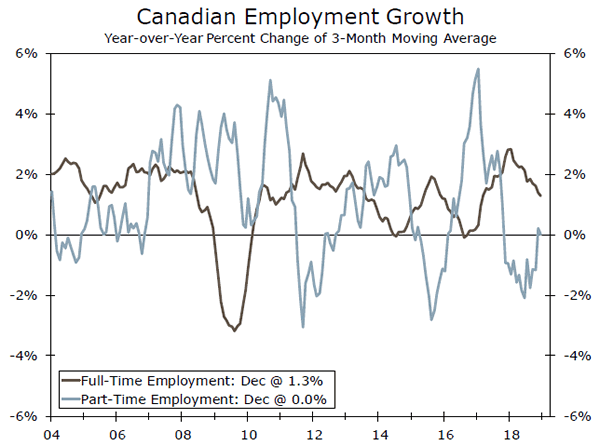
Canada's economy has showed signs of weakening in recent months, including slowing activity in the retail and industrial sectors alike and a drop in economic sentiment. Labor market developments have been more mixed. Headline employment growth has remained solid, but full-time employment growth has slowed. Softer full-time job growth has coincided with a weakening in wage growth, while the unemployment rate has fallen rather markedly in recent months.
On balance, we still see Canada's labor market as fairly healthy, and see the economy growing around trend in 2019. Against that backdrop, we look for the Bank of Canada (BoC) to hike rates twice this year. In evaluating next week's Canadian jobs report, we see the wage figures as just as important, if not more important, in considering the path forward for the BoC. Some stabilization or a rebound in wage growth is likely a necessary, but not sufficient, condition for further BoC rate hikes in the quarters ahead.
Previous: 9.3K Consensus: 10.0K
Point of View
Interest Rate Watch
FOMC Says It Can Be "Patient"
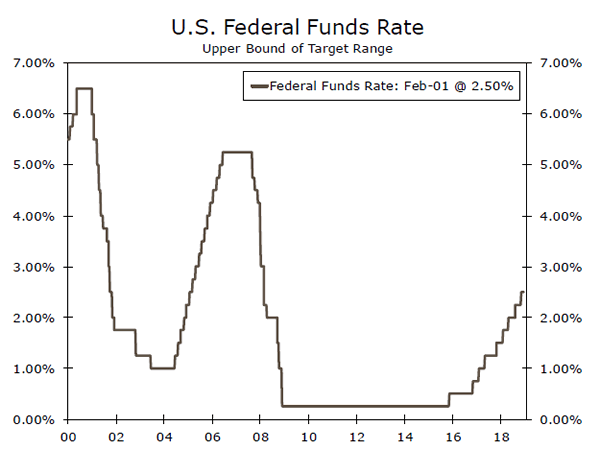
As widely expected, the Federal Open Market Committee (FOMC) decided this week to keep its target range for the fed funds rate unchanged at 2.25% to 2.50% (top chart). In addition, the committee removed its forward guidance by which it had indicated that "some further gradual increases in the target range for the federal funds rate" would be needed. The FOMC now says that it can be "patient" as it determines what future adjustments to the target range for the federal funds rate may be appropriate. In short, the Fed is on hold for the foreseeable future. Although we forecast that the FOMC will opt to tap on the brakes again (i.e., raise rates by 25 bps) this summer and again at the end of the year, it appears that short-term interest rates likely will remain more or less unchanged over the next few months.
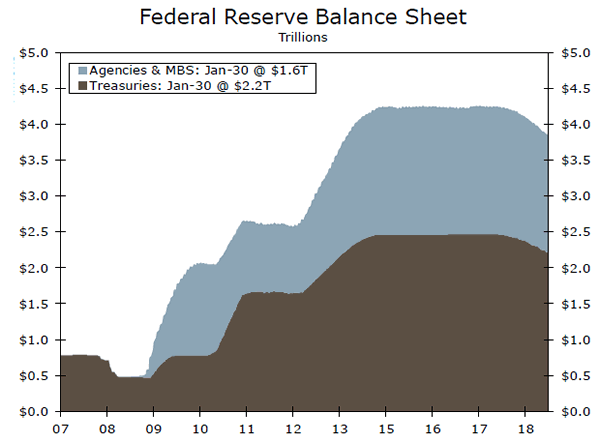
In a separate statement, the FOMC announced that it had decided to maintain the current monetary policy operating framework that it has employed for the past ten years. As we noted in a recent report, the Fed now relies on administered rates to control the fed funds rate rather than the old system in which it added or drained reserves on a daily basis in an effort to hit its target. The implications of this decision is that the Fed's balance sheet will not shrink back to its pre-crisis level (middle chart). As we pointed out in two reports we wrote last summer (Part I and Part II), a large Fed balance sheet means that long-term interest rates likely will be lower than otherwise, everything else equal. This operating framework gives the Fed the flexibility to return to quantitative easing again once interest rates are cut to essentially zero percent, should that prove necessary at some point in the future.
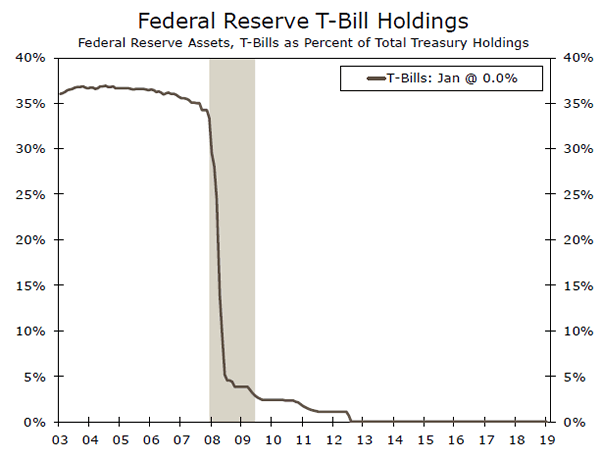
The FOMC has not yet indicated, however, when the shrinkage of the balance sheet would come to an end. In the meantime, we suspect the gradual shrinkage that has been occurring since the end of 2017 will proceed in more or less a mechanical fashion for the foreseeable future. The FOMC also did not address the future composition of the asset side of its balance sheet. But as we have written previously, we suspect the Fed will let its holdings of mortgage-backed securities continue to run off in favor of holding T-bills once again (bottom chart).
Credit Market Insights
Shadow Mortgages?
The former head of Ginnie Mae (GNMA) called it "the biggest shift in mortgage lending since the savings-and-loan debacle in the 1980s." The growing role of nonbank lenders in the mortgage market has caught the eye of officials from GNMA as well as the Federal Reserve, including Chairman Powell. Non-bank lenders composed nearly 80% of total issuance of GNMA-backed mortgage securities in FY 2018, up from 51% in FY 2014. These smaller, non-bank lenders rose in prominence after the financial crisis as banks retreated from the mortgage market and have stayed on the sidelines as the housing sector gradually recovered.
The surge in non-bank mortgage origination has taken place entirely during a period of economic growth and steady, albeit gradual, improvement in the housing market. This has raised concerns over the resilience of these firms during a period of stress. Nonbanks do not take deposits, typically have weaker balance sheets and generally rely on short-term financing from banks that could dry up if delinquencies were to spike. Moreover, non-bank lenders rely relatively more heavily on refinancing fees and activity, which have declined amid higher mortgage rates. As a result, GNMA has recently begun the process of stress testing these entities, and has even gone as far as to request improvements to specific financial metrics before granting full backing of mortgage securities. Delinquency rates remain very low for now, but regulators are increasingly monitoring the non-bank sector's role in mortgage origination.
Topic of the Week
Dating Advice
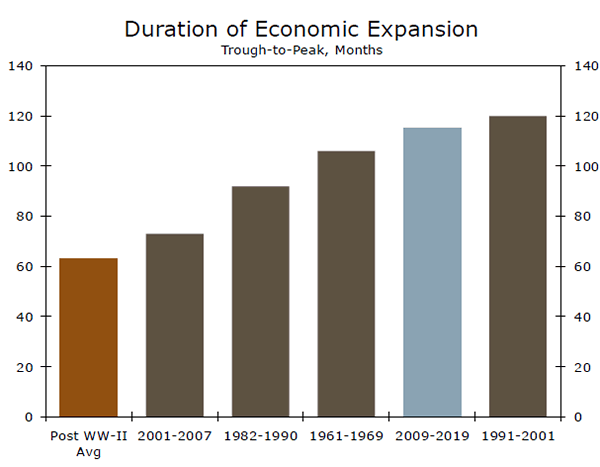
Since 1945 there have been 12 U.S. recessions that have lasted, on average, 10.8 months. Add up the duration of every post-war recession and you get 130 months, or just shy of 11 years. That is less than 15% of the time. Said differently, 85% of the time the economy is in expansion. The average expansion during that same time period is just under five years, and the longest (1991-2001) was 120 months (top chart). If the U.S. economy is still in expansion in July as we expect it to be, this will become the longest U.S. economic expansion on record.
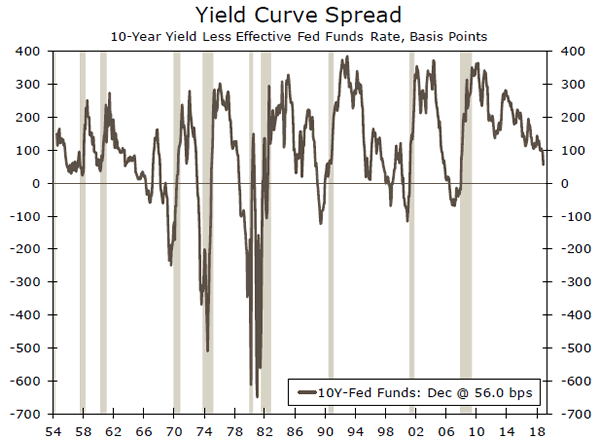
The length of this expansion alone implores a hard look at when the next recession may strike. More crucially, sailing is anything but smooth at present. Risks are mounting and early warning signals of a recession keep popping up. Global growth is slowing. The world's most influential central bank, the Fed, is teetering on restrictive monetary policy. U.S. policy uncertainty is at a five-year high amid ongoing trade disputes and only tentative resolution to the government shutdown. The leading economic index, a key yardstick for the direction of the economy, is losing momentum. Perhaps most ominously, an inverted yield curve has preceded each of the past seven recessions, and we are uncomfortably close to inversion again (bottom chart).
So what defines recession and what should we be watching? The official call is up to the National Bureau of Economic Research (NBER), whose dating committee determines the start and end dates for each cycle. It considers recession to be "a significant decline in economic activity…normally visible in real GDP, real income, employment, industrial production, and wholesale-retail sales."
In a series of notes this past week, we have unpacked each of these components. None of these four horsemen of the apocalypse are signaling recession yet. But what do the leading indicators for each signal in light of the gathering clouds? The next recession is coming, it is just a question of when. These reports will help you identify the leading indicators to watch. Dating the economic cycle is not easy; these reports are our best advice.
The Weekly Bottom Line: The Fed’s Rate Hikes: A Pause or A Stop?
U.S. Highlights
- Financial markets extended their gains this week. The re-opening of the U.S. government, the dovish FOMC statement, progress in the U.S.-China trade talks and a strong January payroll report all helped to boost sentiment.
- Global growth concerns persisted this week, but the U.S. economy continued to move along nicely. The labor market added 304k new jobs in January, and the ISM manufacturing index improved after a sharp decline in December.
- Even as domestic economic performance remains solid, global growth slowdown did not go unnoticed by the FOMC. The Committee left the fed funds rate unchanged, and went to great lengths to emphasize patience.
Canadian Highlights
- Canada's economy contracted 0.1% in November as the energy sector weighed on growth. Real GDP is tracking a modest 1% (annualized) for the fourth quarter as a whole.
- A "patient" Federal Reserve will mean an even more patient Bank of Canada. Canada's outlook is even cloudier than that stateside, providing numerous reasons for caution from the central bank.
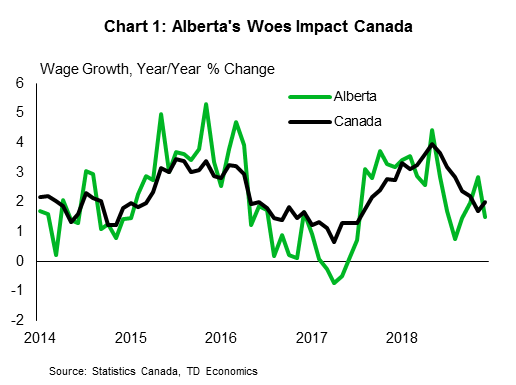
- In a speech this week, Deputy Governor Wilkins noted that the oil shock is coming through not only on the unemployment rate but also the pace of wage growth. Until there is some clarity on the path of global growth, expect the Bank of Canada to remain on the sidelines.
U.S. - The Fed's Rate Hikes: A Pause or A Stop?
Concerns about slowing global growth continued to linger this week. Even so, financial markets had a lot to be cheerful about: the U.S. government re-opened, the FOMC was dovish, the U.S.-China talks made progress and January payroll report showed blockbuster job growth. After a brutal December, this week's trading capped the best monthly performance for the S&P 500 since October 2015.
Top of the list, the longest shutdown in U.S. history has ended – for now. A short-term spending bill keeps the government funded until February 15th. Still, the damage has been done. Various estimates suggest that the shutdown has shaved between 0.2-0.4 percentage points off first quarter GDP growth, which is tracking 1.6% (annualized). While most of the lost economic activity will be recouped in the following quarter, some of the loss will be permanent.
The impact of the government shutdown was also apparent in today's payroll report. The unemployment rate move up a tick to 4.0%, lifted by government workers who were furloughed, and the broader measure of unemployment which includes people working part-time for economic reasons (the U6) has jumped up from 7.6% to 8.1%. Aside from those temporary distortions, it was a stellar report. The labor market added an impressive 304k new jobs in January, marking a record-setting 100th straight month of payroll gains. Wages continued to advance at above-3% pace, and the core age participation rate kept moving higher, rising 0.5 percentage points over the past year.
Meanwhile, across most other major economies, performance is shifting into lower gear. China's economy is weakening: last year's auto sales declined for the first time in decades, and manufacturing activity is contracting. That impact is being felt acutely by China's major trading partners and American companies with significant exposure to the region. The export-oriented Euro Area economy also ended 2018 on a weaker footing, growing at the slowest pace in four years. Clearly, the toll on global growth from the U.S.-China trade dispute is rising, and the time to reach a deal before possible further escalation after the March 1st deadline is running out. President Trump was upbeat about the progress during this week's negotiations, but important issues remain unresolved and any deal is unlikely until the two presidents meet in person later this month.
Global growth slowdown considerations did not go unnoticed by the FOMC. As widely expected, the Committee left the target range for the fed funds rate unchanged at 2.25%-2.5%, but the statement itself was very dovish. In particular, the committee acknowledged that, while domestic economic activity has been "rising at a solid rate", risks to the outlook have increased, which would necessitate patience and flexibility on the Fed's behalf. Any mention of "gradual" rate increases has been removed, suggesting the Fed is prepared to be patient for some time until the fog clears and its gets a better reading on global and domestic economic conditions.
Canada - Oil Sector Puts a Chill on Canada's Growth
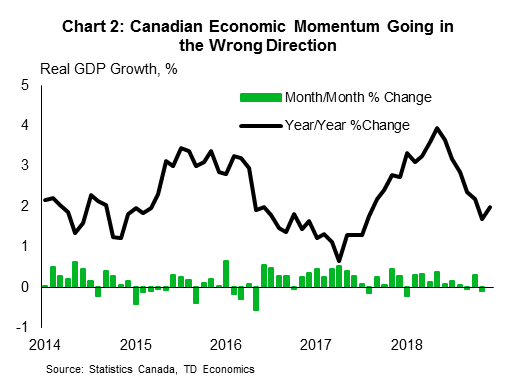
The impact of lower oil prices and widening spreads on Western Canadian Select was on full display in the November real GDP report, released this week. Canada's economy shrunk by 0.1% in the month. The economy likely grew for the fourth quarter as a whole, but with the poor outturn in November, the pace is likely a modest 1% (annualized).
The pain, unfortunately, is not over. The oil shock is evident in small business confidence into January, which, according to the CFIB, pulled back dramatically in Alberta and remained at a low level nationally (edging up only slightly after a steep decline in December). Mandatory production cuts will continue to weigh on economic growth through the first quarter of this year, likely leading to a repeat performance in terms of sluggish real GDP growth in the neighbourhood of 1%. The good news is that due to the improvement in pricing, Alberta has announced a production boost in February, slightly earlier than expected. With a bit of luck, the drag will be contained to the first quarter and a healthy bounceback will take place in the second.
Still, ongoing economic weakness, alongside rising global uncertainty, is reason enough for a pause on interest rate increases from the Bank of Canada. Recall that the last oil shock resulted in two rate cuts from the Bank of Canada in 2015. The current situation is different from the past. For one, the energy price shock is smaller (roughly 25% versus 70% according to Bank of Canada estimates). What is more, the unemployment rate is a percentage point lower and core inflation is closer to the Bank of Canada's 2% target. Nonetheless, below-trend growth gives little reason to expect further improvement in the country's labour market and will mute upward pressure on inflation.
At the same time, the outlook for rate hikes from the Bank of Canada will be influenced by events outside of the country's borders. With the Federal Reserve changing tack on future interest rate increases, there is less scope or rationale for the Bank of Canada to push higher. If the Federal Reserve has reason for patience, the Bank of Canada has a multitude. To name a few: Canada is even more tied into the softening global outlook, especially through the commodity channel, than the U.S.; the interest-rate sensitivity of households is a more pressing issue north of the border where debt levels are higher and housing valuations more stretched; and, finally, competitiveness and investment challenges are a much more pressing issue, necessitating a lower exchange rate to maintain full employment.
As Senior Deputy Governor Wilkins noted, the oil shock is coming through not only on the unemployment rate but also the pace of wage growth, which is particularly muted in oil producing regions. Other structural factors weighing on wage growth, such as increased market power of firms and lower labour market turnover, also bear watching.
The improvement in Canada's benchmark oil prices of late is encouraging, but until global event risks subside and there is some clarity on the path of global growth, expect the Bank of Canada to remain on the sidelines.
U.S.: Upcoming Key Economic Releases
U.S. GDP - Q4 Advanced
- Release Date: TBD
- Previous: 3.4%
- TD Forecast: 2.8%
- Consensus: 2.6%
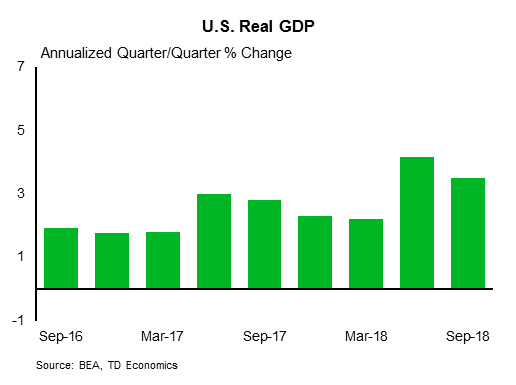
We expect the advanced release of Q4 GDP to show economic growth slowed back to a still strong 2.8% q/q pace, down from Q3's solid burst to 3.4%. The more measured expansion rate should reflect the economy's expected normalization as the fiscal stimulus wanes and as a result of the gradual impact of a tighter monetary stance. We anticipate consumers to remain a firm driver of economic activity during the quarter as suggested by a strong holiday shopping season, and on the back of high levels of consumer confidence and solid employment numbers. That said, we expect the stimulus driven sugar-high of 2018 to start to wane beginning in 19Q1 as the gradual normalization of output toward trend-growth continues this year.
Canada: Upcoming Key Economic Releases
Canadian Employment – January
- Release Date: February 8, 2019
- Previous: 9.3k, unemployment rate: 5.6%
- TD Forecast: 15k, unemployment rate: 5.6%
- Consensus: N/A
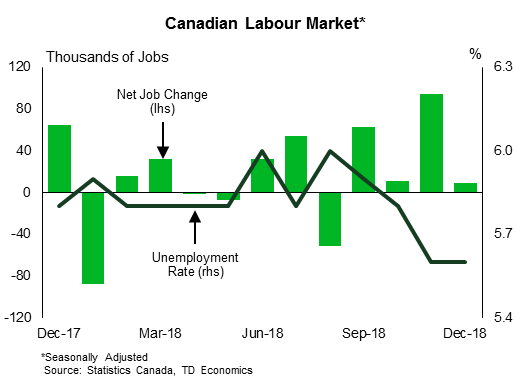
TD looks for the labour market to add 15k jobs in January, led by a rebound in services sector hiring. Services saw an outsized pullback in retail and public administration employment throughout December, the latter of which registered the largest one-month net job loss since mid-2016. Together, these two industries shed over 40k workers which suggests some mean reversion into 2019. Meanwhile, goods-producing employment will face a headwind from layoffs across the energy sector, a likely result of government mandated caps on oil production, and a giveback in manufacturing employment after 24k jobs were added last month, a post-crisis record. Elsewhere we also look for a recovery in private sector job growth following last month's rotation into self-employment. Job growth of 15k should leave the unemployment rate unchanged at the current cycle low of 5.6% while wage growth should firm modestly to 1.7% y/y, still well below levels associated with a tight labour market.
Canadian Housing Starts - January
- Release Date: February 8, 2019
- Previous: 213k
- TD Forecast: 205k
- Consensus: N/A
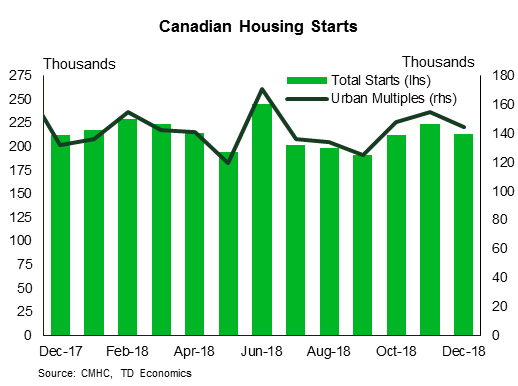
TD looks for residential construction to slow to an annualized 205k units in January on a pullback in multi-unit starts. Permit issuance for multi-unit projects has waned in recent months on a slowdown in new home sales and softer conditions in the resale market, while single family permit issuance continues to sit near the 2008/09 lows. Cold weather in late January will also weigh on construction due to harsh conditions for outdoor workers.
Soft Dollar and Strong Stock Market Supported by Dovish Fed and Strong US Economic Data
Commodity currencies outperformed against the US dollar after the Fed clearly signaled that rates are going nowhere anytime soon, also shrugging off a very strong nonfarm payroll number. Strong corporate earnings and no major hiccups with trade talks also helped drive equities higher on the week.
Rate decisions will be a key theme for the week. The Bank of England policy meeting, inflation report and Governor Carney press conference on Thursday will closely be watched as growth and inflation forecasts could be cut. Key decisions will also come from the Mexico Banxico and the Philippines central bank, economists also expect no change with their respective policy rates.
- RBA, BOE, Banxico, and Philippines central bank all expected to keep rates steady
- Fed’s Mester, Quarles, Powell, Kaplan, Clarida and Bullard all expected to speak
- Should get an update on the release dates for major US data including Advance Q4 GDP and personal income and spending (delayed due to shutdown)
Dollar continues to fall as rate hike expectations evaporate
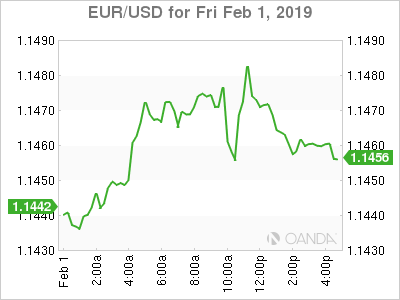
EUR/USD had another positive week, but still remains trapped in a very stubborn 1.1200 to 1.1550 range. The prospects of tightening have faded for both the ECB and Fed, making next week’s wrath of European services PMIs, factory orders and industrial production data an important gauge if the slowdown is easing in Europe. Fed speak this week is also expected to confirm the Fed’s dovish pivot.
Global stock markets will see uneven flows as most of Asia will be closed for some or all of next week as the Lunar New Year holiday begins. Corporate earnings will remain busy next week and look to build on the recent gains. The stock market rally has so far been supported by the backdrop of no rate hikes priced in for 2019 from both the Fed and ECB, progress in trade talks between China and the US and mostly better than expected earnings. Key earnings for the week include Google on Monday, Disney on Tuesday, and both AIG and Boston Scientific on Wednesday.
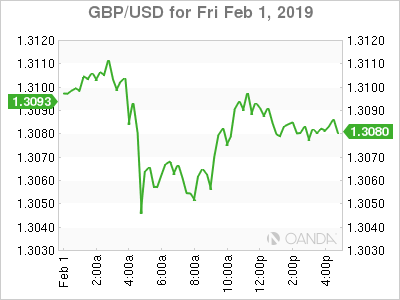
Cable remains in wait-and-see mode on Brexit negotiations
The British had a very choppy move lower this week as lawmakers voted on amendments that gave PM May a new mandate to negotiate a new deal with the EU. The EU is set on taking their time with negotiations and have even suggested they could wait till the scheduled summit on March 21-22nd, just seven days before they are scheduled to leave the bloc.
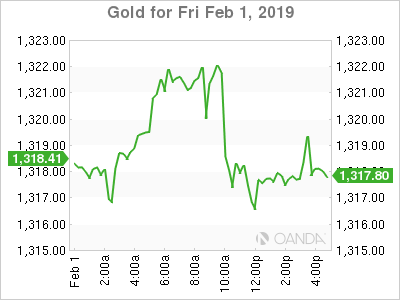
Gold continues to shine on dovish Fed
The precious metal’s breakout was supported on a dovish Fed and slower global growth concerns. The precious metal however pared gains at the end of the week on mostly stronger economic data from the US. Friday delivered several positive signs on the economy as the NFP headline came in better than the top forecast, an impressive ISM manufacturing reading and a rebound with the Michigan sentiment survey.
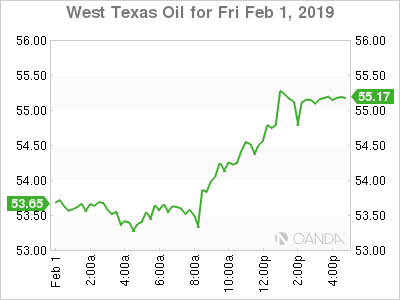
Crude rallies on Venezuela sanctions and strong US data
West Texas Intermediate crude prices remained bid this week as the US unleashed sanctions on Venezuela, and refiners struggled to get crude before the polar vortex crippled the mid-west.
If we do see Venezuelan opposition leader Juan Guaido become successful in win over the backing from Russia and China, we could see President Maduro run out of support. If we do see a peaceful transition of power, oil could see prices fall towards the $50 level. A continued standoff could see prices attempt to capture the $60 handle.
Monday, February 4
- 10:00am USD Factory Orders and Durable Goods
- 7:30pm AUD Retail Sales m/m
- 10:30pm AUD RBA Interest Rate Decision
Tuesday, January 5
- Major European Services PMI data
- 9:45am USD Markit Services PMI
- 7:00pm USD State of the Union Address
- 7:30pm AUD CPI q/q
Wednesday, February 6
- 2:00am EUR Germany Factory Orders
- 8:30am USD Trade Balance
- 9:00am MXN Mexico Consumer Confidence
- 4:45pm NZD Employment Change
- 7:00pm USD Fed Chair Powell to host town hall
Thursday, February 7
- 2:00am EUR Germany Industrial Production
- 3:00am PHP Philippines Rate Decision
- 7:00am GBP BOE Rate Decision and Inflation Report
- 2:00pm MXN Mexico Rate Decision
Friday, February 8
- 2:45am EUR France Industrial Production m/m
- 4:00am EUR Italy Industrial Production m/m
- 8:30am CAD Net Change in Employment
Australia & New Zealand Weekly: RBA Forecasts to be Consistent With On Hold Policy
Week beginning 4 February 2019
- RBA forecasts to be consistent with on hold policy.
- RBA: policy meeting, Governor Lowe speaks, Statement on Monetary Policy.
- Australia: dwelling approvals, retail sales, trade balance, Banking Inquiry Report.
- NZ: residential building consents, labour force, labour cost index.
- China: Caixin services PMI.
- UK: BOE policy decision.
- Europe: retail sales, Sentix investor confidence.
- US: Fed Chair Powell speaks, factory orders.
- Key economic & financial forecasts.
Information contained in this report current as at 1 February 2019.
RBA Forecasts to be Consistent With On Hold Policy
After the usual summer recess the Reserve Bank will conduct its Board meeting on February 5, followed by a speech from Governor Lowe on February 6 and the February Statement on Monetary Policy which will print on February 8.
Of course there will be no rate change following the Board meeting but there will be considerable interest in the Governor's Statement and the subsequent communications.
Recall that the minutes of board meetings have usually contained words along the lines of "members continued to agree that the next move in the cash rate was more likely to be an increase rather than a decrease." Alternatively the November Statement on Monetary Policy noted "further reducing unemployment and ensuring inflation is consistent with the target. If that progress is made higher interest rates are likely to be appropriate at some point."
But those sentiments were expressed when markets had been anticipating rate hikes. At the beginning of 2018 when Westpac was predicting the cash rate would remain on hold in both 2018 and 2019, markets had priced–in a full 25bps rate hike by end 2018. Today, markets are assessing that the next move in the cash rate will be down by 25 basis points with a probability of 60% (15bps) by year's end.
In defence of the economists, only 11 of the 20 forecasters (Bloomberg Survey, January 12, 2018) predicted a hike or hikes in 2018 but this group did include the other three major banks, AMP, and most major investment banks. There is no survey evidence to check how many of the "no–change nine" supported the Westpac view that rates would remain on hold through 2019 as well. Since that survey in January last year Westpac has extended its "on hold view" through 2020. Turning to today, there is also, at this stage, little support from the economists for the "market view" which is pricing rates to be cut by end 2019.
The key as to whether the Reserve Bank will placate markets and adopt a pure neutral bias by eliminating the "next move up" in its commentary will hinge on how it reassesses its forecasts which will be released with the February Statement on Monetary Policy (SOMP) on February 8.
Recall that, based on its forecasts in the November SOMP, the conclusion that the cash rate would eventually rise was reasonable.
Growth was forecast at 3.5% in 2018; 3.25% in 2019; and 3% in 2020. Trend growth is assessed by the RBA as 2.75% (1 ppt for productivity growth and 1.75 ppts for labour force growth).
Three consecutive years of comfortably above trend growth could be expected to erode significant excess capacity and boost employment growth so that inflation would lift into the 2–3% target range and the unemployment rate would approach the NAIRU. Accordingly, the Bank forecast core inflation to lift to 2.25% in 2019 and 2020 and the unemployment rate to fall to 4.75% by end 2020.
The December quarter inflation report printed underlying inflation at 0.4% and headline inflation at 0.5%. These numbers were around market expectations although there was a "whisper" number in markets of somewhat lower. Importantly, the print for underlying inflation for 2018 was 1.7% – in line with the Reserve Bank's forecast from its November SOMP.
The November inflation forecasts for 2019 and 2020 are 2.25% – a marked lift from the 2018 actual of 1.7% but it is likely the Bank will persist with this confident signal in its February forecasts. Even if it decides to lower the 2019 forecast to 2.0% in recognition of a lower growth forecast for 2019 the number would still be in the target zone (2–3%) and the gradual progress would be emphasised by maintaining the forecast for 2020 at 2.25%.
Their views on the labour market have been cautious. The unemployment rate has already reached 5% while the Wage Price Index growth rate has lifted in recent quarters to 2.3%. Scrutiny of a chart which, for the first time, was provided in the November SOMP points to a cautious forecast of WPI annual growth reaching 2½ per cent by end 2020.
However, the September quarter GDP report has disrupted the RBA's comfortable position on the growth outlook. With growth only printing 0.3% in that quarter it would be necessary for the December quarter to print 1.2% to achieve the November forecast of 3.5%. The 2018 growth forecast is likely to be lowered from 3.5% to 3.0%. But what will this mean for the 2019 and 2020 forecasts?
We know that the Bank has assessed a minimal wealth effect on consumption and the Q3 growth report is unlikely to have changed that view. Even further negative evidence on house prices in Sydney and Melbourne is unlikely to change the qualitative assessment that the wealth effect was minimal while house prices were booming and therefore will be minimal in reverse. RBA Director Harper recently played down any evidence of a wealth effect in an interview with Dow Jones late last week.
Westpac differs in that regard pointing to a fall in the savings rates in NSW and Victoria over the year to September 2018 of 1.7 ppt's in NSW and 1.9 ppt's in Victoria. We expect some reversal of that effect in 2019 and 2020 pushing growth in consumer spending down from our previous forecast of 2.6% in each year to 2.4%. Our simulation work suggests that the impact on consumption of this negative wealth effect may be significantly larger. We expect the Bank will maintain its current view that consumption growth will run at 3% in both 2019 and 2020.
We also differ on the likely downtrend in residential construction in 2019 and 2020, "Dwelling investment has remained high and... should remain at a high level for the next year or so" (Nov SOMP). Based on the recent falls across the board in dwelling approvals (detached and multi) we look for a 8% fall in new dwelling construction in 2019 and 5% decline in 2020.
Westpac's growth forecasts are 2.6% in 2019 and 2.6% in 2020. Those forecasts are only slightly below trend and consistent with steady rates in 2019 and 2020.
We expect the RBA will forecast growth of 3% in 2019 and 3% in 2020. That higher growth will reflect a limited slowdown in housing construction and no meaningful wealth effect. Those growth forecasts are still above trend and likely to ensure the view that the next move in rates will be up.
Indeed, in his comments to Dow Jones, Director Harper repeated the expectation that the next move in rates will be up. While he emphasised these were his own views it is important to point out that Dr Harper has a distinguished past in the Research Department of the Bank. Some of the Bank's senior executives would have been colleagues. His comments carry much more weight than the personal observations of an outside director.
Of course we need to be mindful that the comments preceded the shock from the monthly NAB Business Survey that showed a collapse in business conditions (business confidence held around previous levels). Risks around business surveys that are taken in January must be recognised. Indeed that particular survey has shown some volatile movements around the Christmas period. It is doubtful that the Bank would change its longstanding rhetoric on the basis of a January Business Survey.
If, however, we thought the RBA was likely to lower its growth forecasts in 2019 and 2020 to 2.5% or less then we would certainly expect it to adopt an easing bias.
Other factors which may impact market thinking are the higher recent levels of BBSW and associated out of cycle hikes by some banks. The RBA will probably view those developments as likely to exacerbate housing price weakness but due to an insignificant wealth effect, will be unlikely to materially change their forecasts.
Accordingly, despite lowering its growth forecasts for 2018 and 2019, we expect the Bank will retain its current stance that the next move in rates will be up.
The week that was
This week, inflation and business conditions were the key points of interest for Australia. Offshore, the FOMC focused on the risks to the outlook.
With the market having shifted from pricing in the probability of a rate hike to a rate cut in recent months, there was considerable interest in Australia's Q4 2018 CPI report. While the headline reading did beat expectations (0.5% versus 0.4% consensus) for the first time in two years, the primary talking point remained the dearth of underlying inflation pressures. The average annual pace of the two core measures came in at just 1.8%, and the six–month annualized pace was weaker still at 1.5%. Both outcomes are a long way from troubling the 2.5% mid–point of the RBA's target band. The detail of this update confirms to us that this trend will persist hence.
Key to enduring weakness in aggregate inflation is housing. Disinflation in rents and house purchase costs continue to hold this key component of the CPI (15% of total) at multi–decade lows. Inflation for appliances and furniture has firmed over the past year, arguably owing to pass–through from the weaker Australian dollar, but inflation in this sector is still very soft at just 1.0%yr. The effect of competition in the retail sector is also on display in ongoing deflation for clothing and footwear. Come Q1 2019, headline inflation will be hit by oil price declines (0.1%; 1.4%yr). Annual underlying inflation is set to remain unchanged at 1.8%yr, on our preliminary forecasts.
The January update for the NAB business survey was certainly attention grabbing, with business conditions suffering their largest monthly decline since the GFC to +2 – the softest read since September 2014 and a long way below the +18 average of the first half of 2018. Business confidence was unchanged in the month at +3, but that reading is still below average and also well down from +9 in the first half of 2018. Admittedly, this survey can suffer from abnormal seasonal fluctuations, but if taken literally, these outcomes indicate policy makers' expectations for above–trend growth should be marked materially lower.
Shifting offshore, the FOMC's January meeting was the key event this week. In the decision statement and Chair Powell's press conference, caution over the outlook was paramount. This is not because their view of the US real economy has soured, but rather owing to the many cross–currents (risks) they perceive. Top of their list of concerns are decelerating growth in China and the broader global economy as well as the potential effect Brexit could have on the UK and Europe, and hence on the US. Also being watched carefully is US fiscal policy. While their Federal government has been reopened, it is only for three weeks. A lasting solution to this political malaise seems a long way off, so too the safe–guarding of confidence. We continue to see two further hikes from the FOMC in June and September 2019, but this is conditional on the above cross–currents abating and the US real economy asserting its strength.
In Europe, Q4 GDP met market expectations for a subdued 0.2% increase. Annual growth of 1.2% through the year saw the annual average for 2018 decline from 2.5% to 1.8%, slightly below the ECB's December projections of 1.9%. As this is only the initial flash estimate, detail is scarce, but national agency releases provide some information on the country breakdown. Here, France recorded 0.3% as exports offset stalling consumption; Spain surprised to the upside with 0.7% growth, continuing a robust trend; while the headline–grabber was Italy, a 0.2% contraction marking a technical recession. On a more positive note, employment data in the week showed the unemployment rate finished 2018 at 7.9%, continuing progress from the 8.6% recorded at the end of 2017, and consumer confidence readings edged up from earlier declines. Ultimately that paints a picture not too dissimilar from other global economies: a strong labour market counterpoised by fading growth momentum amidst a cloud of general geopolitical uncertainty.
Finally on China, the official NBS PMI remained below 50 for a second consecutive month in January as a result of continued weakness in external demand (new export orders remained at a low back to end–2015) and the backlog of work to be completed being depleted further. This clearly highlights the effect of softening global growth on China's economy. Pleasingly though, the services PMI strengthened in the month to be in line with the average of 2017 and 2018. This result highlights the robust health of their domestic economy in trying circumstances. With authorities having seen results from their drive for quality growth, and given cyclical momentum is now being encouraged, domestic momentum should remain robust in 2019.
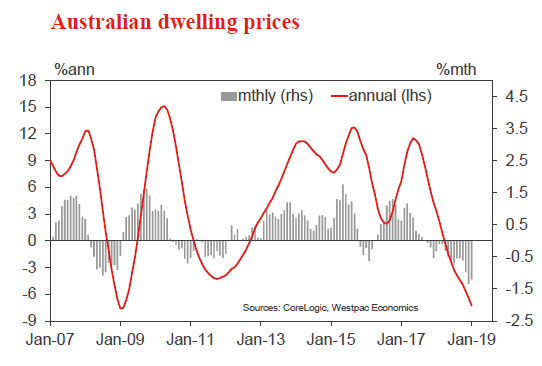
Chart of the week: Australia CoreLogic home value index
Australia's housing market correction broadened and accelerated through late 2018 and very early 2019. The CoreLogic home value index, covering the eight major capital cities, fell a further 1.2% in Jan following a 1.3% decline in Dec and a 0.9% fall in Nov. Prices nationally are down 6.9%yr and are now 7.8% below their Sep 2017 peak, eclipsing the (much slower) 2011–12 price correction but still milder than the price fall during the GFC.
While the result is for the first month of 2019, in practise it speaks more to the extent of weakness in late 2018. Markets are essentially closed from late Dec through to early Feb with turnover typically 25–30% below average (possibly lower given current market conditions). This pattern also generates some seasonal price weakness as sellers outnumber buyers although the effect is marginal – adding about 0.3ppts to monthly declines – and does not detract what is an unambiguously weak picture over the last 3mths.
New Zealand: week ahead & data wrap
A smaller and slowing boost to the economy
One of the key drivers of economic activity in recent years has been rapid population growth on the back of high levels of net migration. Strong inflows of new migrants and low departures of New Zealanders have provided a powerful boost to spending and also generated a strong need to build homes. At the same time, the related increases in the labour force have boosted the economy's productive capacity and helped to address skill shortages in some sectors.
Stats NZ has recently taken a closer look at movements in and out of the country over the past few years, and this has revealed some important trends. It turns out that a larger proportion of the people who arrived in recent years only came on a temporary basis. This means that the increase in permanent and long–term migration, and the related change in New Zealand's resident population, has been smaller than was thought. Earlier estimates had suggested that annual long–term migration had risen to a peak of 72,500 in mid–2017. However, Stats NZ's updated estimates have revealed that long–term migration actually peaked at a lower level of around 64,000 back in mid–2016. The latest estimates have also shown that net migration has now fallen to an annual rate of around 43,000 – a level that's around 20,000 lower than initially thought. Looking at the past four years as a whole, this means that around 47,000 fewer people settled in New Zealand on a long–term basis than had been estimated (that's close to 1% of New Zealand's total population).
The size of this revision may seem surprising given that New Zealand keeps tight control on the number of people crossing its borders. But while we have good information on the numbers of people entering and leaving the country, the duration of their stay can be harder to track. Some people who plan to visit for a temporary period may end up staying permanently. Alternatively, some of those who plan to stay on a long–term basis might end up departing sooner than expected. The difference is important. Permanent or long–term migrants (those who remain onshore for more than a year) will have a larger impact on the country in terms of their spending, employment, and their housing needs. Those who enter the country on a shorter–term basis (less than a year) still contribute to the economy, but the impact is likely to be smaller and less enduring.
Previously, Stats NZ used people's stated intentions on arrival and departure cards to estimate how long people planned to stay in the country (this is sometimes referred to as the 'intentions' approach). They are now using an 'outcomes' based approach that looks at actual movements in and out of the country. This is a bit more complex to estimate given the time needed to track people's movements across borders. But over time, it should give a more accurate estimate of what's actually happening to migration flows.
The updated migration estimates have shown that both long– term arrivals and long–term departures have been higher than previously thought. The revision to departures has been the bigger of the two, meaning that the level of net migration has been lower. The difference has been heavily centred on those aged 20 to 29. This age group will include a large proportion of international students, as well as those on temporary work or working holiday visas – all groups that tend to be highly mobile. In other words, more young foreign people have been leaving New Zealand than initially thought.
This still leaves us with a picture of strong overall inflows into the country in recent years. However, a greater proportion of those inflows were on a short–term or temporary basis. Those temporary arrivals will have added to demand and they still needed somewhere to stay, but have probably provided a smaller boost to economic conditions than permanent migrants would have.
Lower long–term migration will have a number of important implications for the economy and it reinforces our expectations for a cooling in GDP growth and the housing market over the next few years. This will also be important for the labour market.
Lower longer–term migration means that population growth has been slower than expected in recent years. Stats NZ's next update on the population level won't be out for a few weeks. When released, we expect that those figures will reveal New Zealand's population is currently smaller than previously believed. We estimate that annual population growth peaked at 2% in 2016 and has since slowed to 1.5%. Those are still solid rates of population growth, but would be a fair bit slower than was initially thought. Furthermore, with net migration continuing to trend down, it implies smaller increases in the nation's demand base over the next few years. That will be important for many businesses, meaning than an 'easy' source of demand growth that they've enjoyed in recent years is dissipating even faster than expected.
Lower net migration and population growth will also have a major impact on residential construction. For some time, we have been highlighting that the rate of dwelling construction was catching up with population growth. We predicted that as population growth slowed, housing shortages would begin to ease in the coming few years, and therefore the outlook was for moderate growth in construction activity. These data revisions reinforce that view. It now looks as though residential consent issuance is already at the level required to keep up with population growth. And with fewer migrants settling here on a long–term basis, the number of homes that will eventually be required is lower than previously thought.
These trends will be particularly important for Auckland which has experienced an especially large population cycle. However, their impact will be felt more widely. Many other regions are currently seeing high levels of home building, and the durability of those cycles looks increasingly doubtful, especially given the policy– induced slowdown in the housing market already in train. We'll take a closer look at the extent of changes in the construction outlook in our upcoming February Economic Update.
Data Previews
Aus Dec dwelling approvals
- Feb 4, Last: –9.1%, WBC f/c: 1.5%
- Mkt f/c: 2.0%, Range: 0.0% to 5.0%
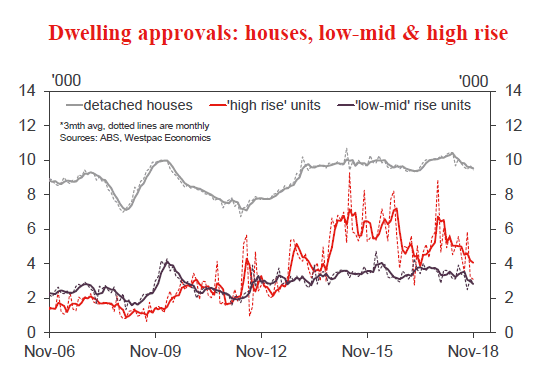
Dwelling approvals dropped 9.1% in Nov, a sharp fall following a 1.4% decline in Oct. 'Units' lead the fall, dropping 18% in the month, the detail suggesting weakness was across both 'high rise' and 'mid–rise'. Private detached house approvals were also down 2.6%, a sizeable decline for a more stable component.
High rise approvals are likely to show a 'technical' bounce in Dec simply from monthly noise. However, this is expected to be muted with activity in the segment still taking a sharp move lower – recent monthly levels are where we expect high rise approvals to eventually settle. Importantly, finance indicators suggest the weakness in the larger 'non high rise' segment is likely to continue. On balance, we expect only a modest 1.5% gain for total approvals in the Dec month, leaving a clear underlying downtrend firmly intact.
Aus Dec retail trade
- Feb 5, Last: 0.4%, WBC f/c: –0.2%
- Mkt f/c: 0.0%, Range: –0.5% to 0.4%
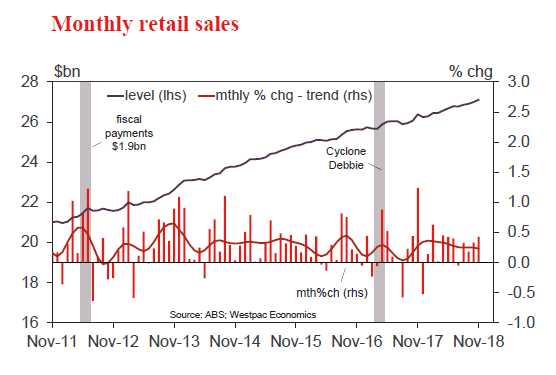
Retail sales rose 0.4% in Nov following steady gains averaging 0.3%mth through Aug–Oct and a flat result in July. Sales growth is tracking a 3.3% annual pace over the six months.
Some of the Nov gain looks to have been due to the increasingly popular 'Black Friday' sales event – our estimates suggest online retail sales were up over 6% in the month, implying retail ex online had a more subdued 0.1% gain. Some post event 'let down' is likely.
With consumers turning cautious late in the year – Christmas spending plans down on a year ago – and both anecdotes and private sector business surveys pointing to disappointing holiday sales for retailers, we expect total retail sales to show a 0.2% dip for the Dec month.
Aus Q4 real retail sales
- Feb 5, Last: 0.2%, WBC f/c: 0.2%
- Mkt f/c: 0.5%, Range: 0.0% to 0.9%
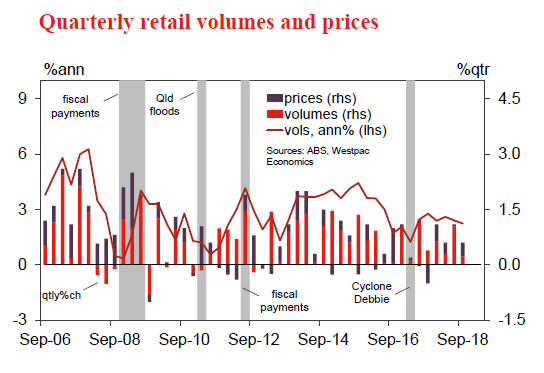
The Q3 retail report was soft with sales volumes rising just 0.2% compared to a 1% gain in Q2. Sales have been choppy quarter to quarter, annual growth slowing to a subdued 2.2%yr.
The Q4 update is likely to show another soft read. Nominal sales are tracking towards a reasonable 0.8% gain for the quarter, up from 0.6% in Q3. However, the Q4 CPI detail shows retail prices were firmer with food, meals out and household goods all recording notable rises.
Overall we expect the retail deflator to show a 0.6%qtr gain, vs +0.4% in Q3. That in turn points to retail volumes being up just 0.2% for the quarter. Back to back subdued results mark a break from the choppy quarterly profile over the last two years and will be the first confirmation of a more subdued growth trajectory for consumer demand.
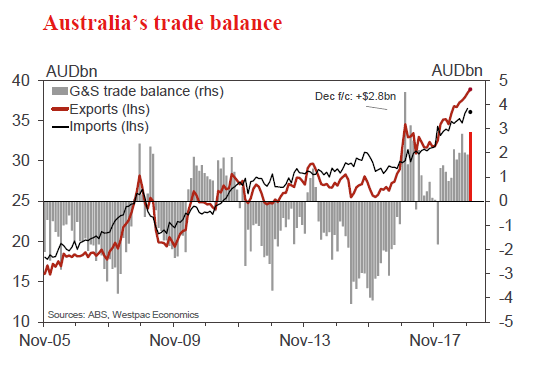
Aus Dec trade balance, AUDbn
- Feb 5, Last: 1.9, WBC f/c: 2.8
- Mkt f/c: 2.2, Range: 1.8 to 4.5
Australia's trade account remains firmly in surplus, with the December update expected to make it 12 from 12 for 2018.
The surplus is expected to move higher, to a forecast $2.8bn, following a $1.9bn outcome in November.
We anticipate a moderation in the import bill, down –1.2%, following strong showings over October (+3.4%) and November (+1.7%).
Export earnings are expected to rise, +1.2%, supported by a rise in coal (volumes and prices) and by the lower dollar – which was –0.8% vs USD and –1.3% on a TWI basis.
As to risks: global energy prices fell sharply late in 2018 but to date this is not evident in the official trade data – we may yet see an impact on imports and more so on exports.
Aus RBA policy announcement
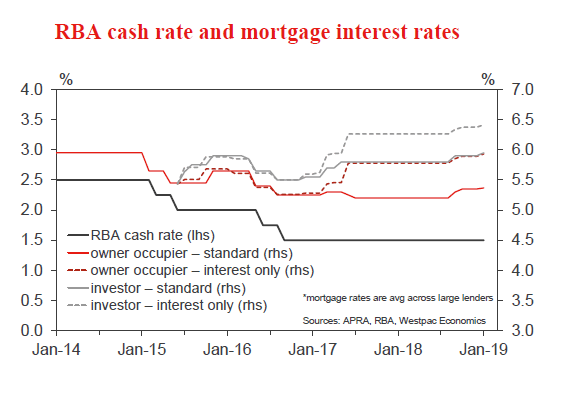
- Feb 5, Last: 1.50%, WBC f/c: 1.50%
- Mkt f/c: 1.50%, Range: 1.50% to 1.50%
The Reserve Bank last moved rates in August 2016 (a cut) and last raised rates in November 2010.
We expect the RBA to leave rates unchanged in 2019 and in 2020.
While markets widely expect no move at the February meeting, the first for the year, there is speculation as to whether the Bank will soften their stance.
As discussed above, on page 2, we expect the RBA to remain positive on the outlook, albeit marking down their growth forecasts somewhat.
The Bank will anticipate that further progress on inflation and unemployment will be (very) gradual – suggesting steady rates for some time yet.
NZ Dec residential building consents
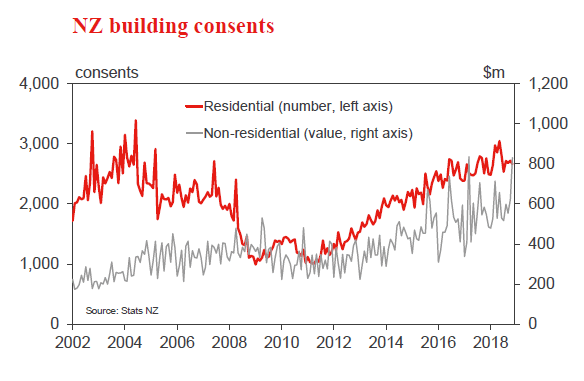
- Feb 4, Last: –2.0%, WBC f/c: +3.5%
Residential dwelling consent issuance fell by 2% in November. That decline related mainly to apartment consents, which can be lumpy on a month–to–month basis. The underlying level of consents remains elevated.
We expect to see a modest 3.5% gain in consent issuance in December with issuance in Auckland and other regions remaining firm, while activity in Canterbury continues its gradual downtrend.
We expect that building activity will remain at firm levels over the next few years. However, with consent issuance now running at levels commensurate with population growth, further increases are likely to be moderate.
NZ Q4 Household Labour Force
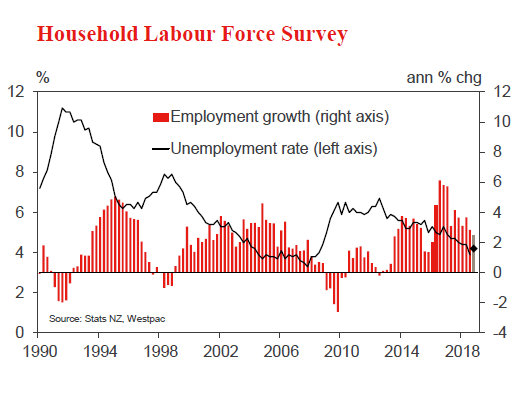
- Feb 7, Employment last: +1.1%, WBC f/c: +0.2%, Mkt f/c: +0.3%
- Unemployment last: 3.9%, WBC f/c: 4.2%, Mkt f/c: 4.1%
A range of evidence points to an increasingly tight labour market over 2018. Firms are having increasing difficulty in finding workers, and households' perceptions of job opportunities are at a ten–year high.
However, the drop in the unemployment rate from 4.4% to 3.9% in the September quarter was unusually large, and looks vulnerable to a correction. We're assuming a partial unwind to 4.2% in the December quarter, which would still be consistent with an improving trend.
Similarly, we expect that last quarter's 1.1% surge in employment (despite weak GDP growth of just 0.3%) will be followed by a subdued December quarter result.
NZ Q4 Labour Cost Index
- Feb 7, Private sector last: 0.5%, WBC f/c: 0.5%, Mkt f/c: 0.6%
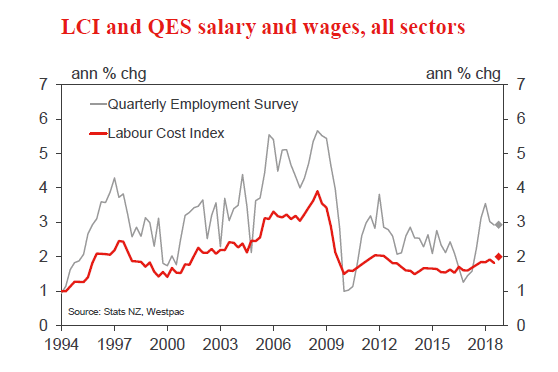
We expect a 0.5% increase in private sector wages for the December quarter, with the recent nurses' pay agreement boosting total wage growth to 0.6%.
Despite a tight labour market, there has been limited evidence of a pickup in wage growth so far, outside of government–mandated increases such as fair pay agreements and minimum wage hikes.
However, the LCI is by design a slow–moving series. The QES average hourly earnings measure tends to be more responsive, and has seen a more substantial pickup compared to the LCI in recent times.
UK Bank of England Bank Rate
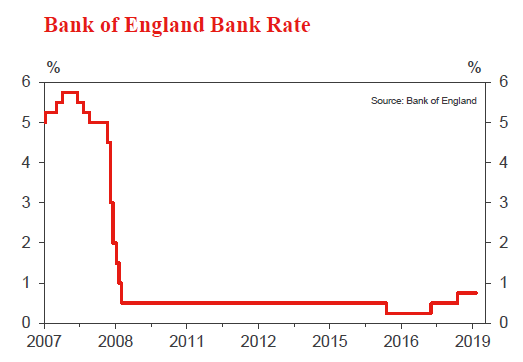
- Feb 7, Last: 0.75%, WBC f/c: 0.75%
With Brexit continuing to cast a long shadow over the economic outlook, there's no chance of a rate hike at the February MPC meeting.
Once again, the focus will be on the BOE's rhetoric and its description of the risks around the outlook. In December, the BOE maintained a very modest tightening bias, noting that a gradual and limited tightening in the Bank Rate would be appropriate if the economy evolved as expected. However, the Bank's assessment was contingent on a smooth Brexit transition – an outcome that looks increasingly doubtful. The global backdrop is also looking softer than in December. Given these developments, the Bank is likely to re–emphasise the conditionality of its forecasts, and its (very) mild tightening bias could be further diluted.
Week Ahead – BoE and RBA Next to Set Rates; Will They Turn Dovish Too?
The Bank of England and the Reserve Bank of Australia will be next in the central bank world to set monetary policy amid rising risks and uncertainty about the outlook. It will be relatively quiet on the data front as Chinese markets will be shut for the whole week for the Lunar New Year celebrations, while the US economic calendar will be void of top tier releases.
RBA to hold rates; may lower growth forecasts
The Australian dollar will take centre stage next week as a slew of data releases and an RBA policy meeting will be watched for possible clues about the direction of interest rates. The RBA has so far mostly stuck to its rosy growth outlook for 2019 but the markets don’t agree and are pricing in a small chance of a rate cut by year end. Investors think the soft inflation picture in Australia and the deepening slowdown in China will force the RBA to either delay a hike in the cash rate or to cut it.
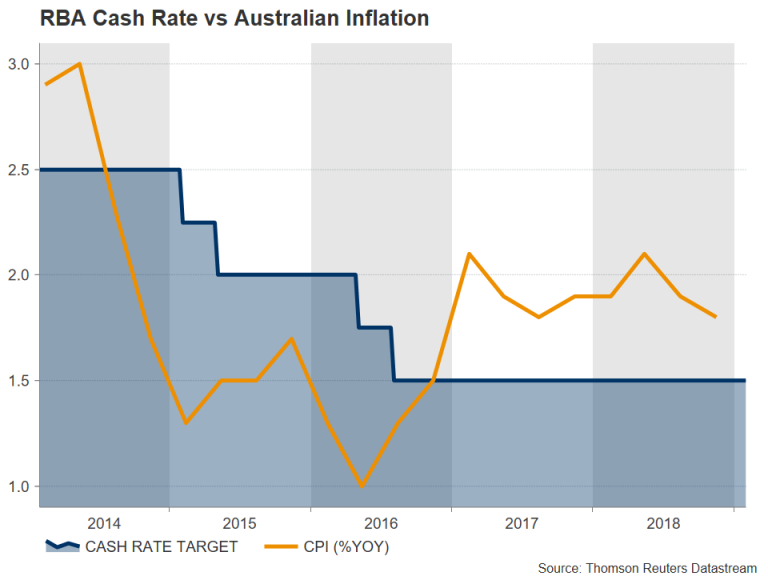 If the central bank tones down its optimism at Tuesday’s meeting and follows this up with downward revisions to its growth and inflation forecasts in its quarterly Monetary Policy Statement on Friday, odds that the next move in rates will be down could jump.
A dovish tilt could severely pressure the aussie, which has been rallying this week on the back of better-than-expected inflation in Q4 and a sell-off in the US dollar. The latest numbers on building approvals on Monday, and retail sales and international trade on Tuesday (all for December) could also create some volatility for the aussie.
Loonie looks to jobs figures to extend gains
Another currency benefiting from the greenback’s pullback is the Canadian dollar. Rising oil prices have also been lifting the loonie but next week’s data could prove significant in determining whether the rally has further room to run as GDP numbers this week showed the economy contracted slightly in November, pointing to sluggish growth in the final three months of 2018. The Bank of Canada has said further rate hikes will still be needed over the coming period but if growth remains weak, the BoC may follow the Fed and pause its tightening cycle.
The first data point to watch out of Canada next week are Tuesday’s trade figures for December, followed by the January Ivey PMI on Wednesday. The more important one though for investors will be Friday’s jobs report. Employment growth picked up substantially towards the end of 2018, but a lot of the growth was in part-time employment, which may explain why wage growth actually moderated during the year. A disappointing report could cast doubt on whether the BoC would be in a position to raise rates anytime soon, leading the loonie to pare back some of its recent gains.
Kiwi eyes labour market indicators
New Zealand will also publish its latest stats on the labour market next week. Fourth quarter numbers on the unemployment rate, jobs growth and wages are all due on Thursday. Like its aussie and loonie counterparts, the New Zealand dollar surged against the US currency during the past week, while recent domestic data has not been as gloomy as feared. If employment continued to expand in Q4 and wage increases did not slow, the kiwi should be able to hold on to its impressive gains.
Dollar unlikely to find much reprieve from US data
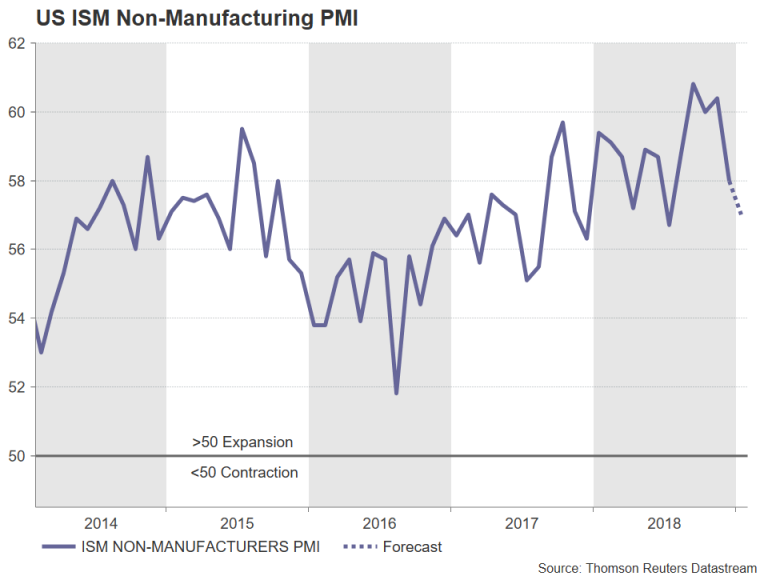
After the highly anticipated Fed meeting and all-important NFP report, US events will take a back seat next week, which means the sliding dollar could struggle to find much support in the markets. Nevertheless, any positive surprises could give the greenback a bit of a bump up, starting with Monday’s factory orders. They are forecast to have risen by 0.4% month-on-month in November after slumping by 2.1% in the prior month. The ISM non-manufacturing PMI will follow on Tuesday, with the closely-monitored activity gauge projected to ease to 57.0 in January from an upwardly revised 58.0 in December. Finally, on Wednesday, November trade figures and fourth quarter productivity numbers will be watched.
Bank of England meets amid Brexit chaos
With less than two months to go before the UK formally leaves the EU, the Bank of England will have the difficult task of setting monetary policy with no idea yet on whether or not there will be an orderly exit. Policymakers had already taken a more cautious stance at the last meeting in December as the Brexit uncertainty dragged on and given the heightened anxiety about the global growth outlook since then, the Bank could go one step further and signal fewer rate hikes than currently being projected for the next three years.
Bearing in mind that the BoE will also have updated quarterly forecasts at its disposal and there is a post-meeting press conference scheduled, some shift in policy is possible on Thursday.
Ahead of the BoE meeting though, investors will be keeping an eye on Monday’s Markit/CIPS construction PMI, as well as the services PMI on Tuesday. The UK’s dominant services sector is expected to have slowed slightly in January, with the PMI falling to 51.0 from 51.2.
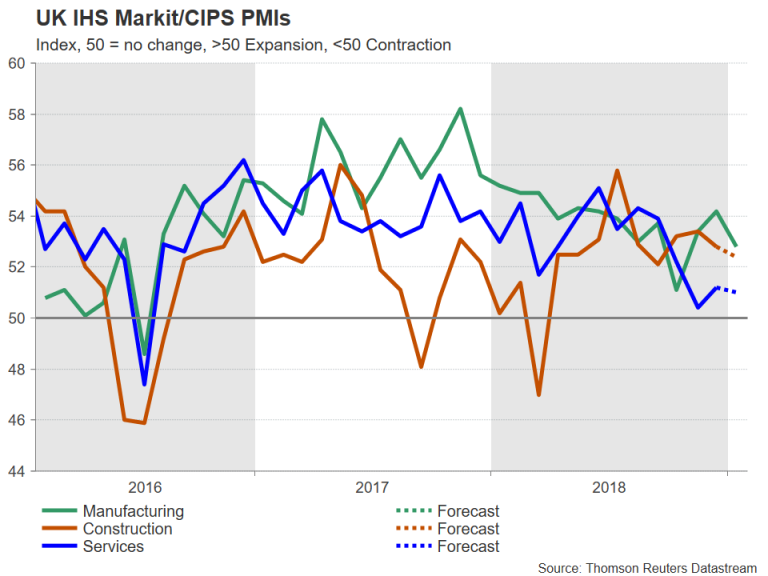
Any weakness in the data as well as a more dovish BoE would likely weigh on sterling, which has been on the retreat after Parliament failed to approve handing power to MPs to block a no-deal Brexit. A negative turn could make the $1.30 level an easy target for the pound next week.
Lacklustre week for the euro
With both the dollar and the pound getting onto a negative footing over the past week, the euro hasn’t been able to capitalize on their weakness particularly well as economic data from the Eurozone continues to disappoint. The single currency might find some upside from next week’s numbers, however, as some of the releases are forecast to show an improvement.
First up is the Eurozone sentix index on Monday, with the economic sentiment gauge expected to rise to -0.6 in February from -1.5 previously. Producer prices are also due on Monday, while on Tuesday, the final January prints of the IHS Markit services and composite PMIs are released along with retail sales for December. Retail sales are forecast to have declined by 1.6% m/m in December. German indicators in the following days should be more positive though. German industrial orders, out on Wednesday, are forecast to have risen by 0.3% m/m in December, while Thursday’s industrial output data is expected to show an increase of 0.7% m/m for the same period. Trade figures due on Friday could produce a hat trick as exports are anticipated to have increased by 0.6% m/m in December.
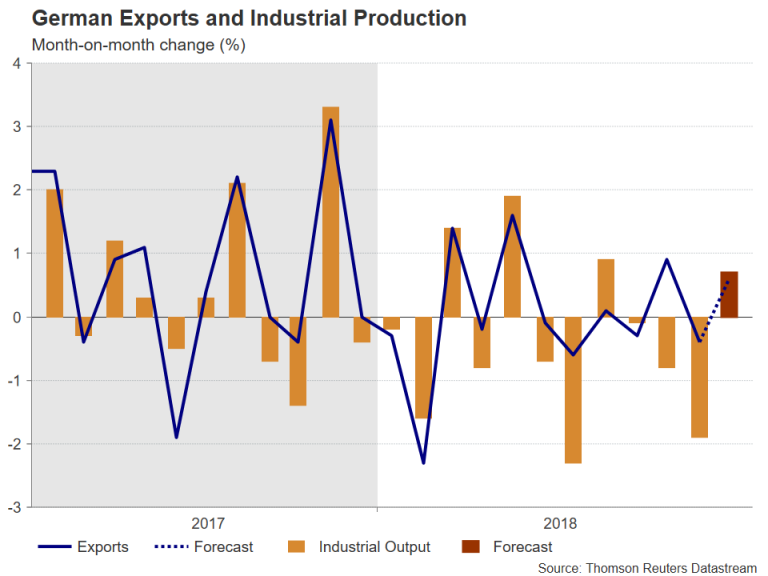
A set of positive readings from Germany could ease concerns of a sharper slowdown in the euro area’s largest economy. But more poor numbers could keep the euro stuck below the $1.15 handle for a while longer.
Weekly Focus: Brexit Wrestling Enters Next Round
Market Movers ahead
- In the US, the flow of economic data releases begins again after the shutdown with trade data and the ISM non-manufacturing index.
- Keep an eye on FOMC speeches for hints on the future pace of the Fed's balance sheet reduction.
- Brexit negotiations will still be in focus as Prime Minister Theresa May battles for concessions from the EU.
- We do not expect the Bank of England to change its policy before November.
- A further pickup in Japanese cash earnings will be a key ingredient for the inflation outlook to brighten.
- Swedish December industrial production is heading for a drop, while Norwegian GDP growth should have accelerated in Q4 18.
- Danmarks Nationalbank's currency reserves data for January will be scrutinised for further FX interventions.
Weekly wrap-up
- The jury is out on the global economy after a dismal end to 2018.
- The FOMC struck a more cautious tone, causing USD to weaken and boosting risk sentiment in markets.
- The Brexit drama continues relentlessly as PM May heads back to Brussels.
- China and the US have laid the groundwork for a trade deal in H1 19 .
MARKET WRAP: US Jobs Number Pushed Stocks Higher
US Jobs data disappointed and markets moved higher because the Fed cannot move the interest rate needle if it continues like this. US-China trade war will remain the focus for the upcoming week.
Stocks
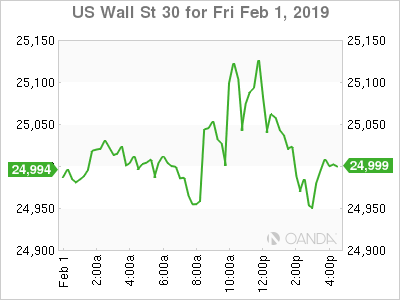
- The S&P 500 Index traded up by 0.3 percent as of 15:30m. in London but likely to close the week higher
- The Stoxx Europe 600 Index jumped 0.1 percent, on US-China trade hopes.
- The MSCI Emerging Market Index dropped 0.1 percent.
Currencies
- The Dollar Spot Index jumped 0.2 percent despite weak jobs number
- The Euro pushed higher 0.1 percent to $1.1455 on the back of a positive set of economic number.
- The British pound dropped further 0.3 percent to $1.307 as Brexit takes over again.
- The Japanese Yen is still not picking up any steam and dropped 0.2 percent to 109.1 per dollar.
Bonds
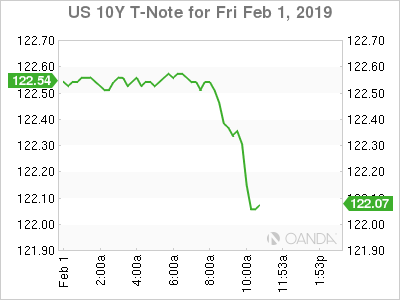
- The yield on 10-year Treasuries dropped two basis points to 2.65 percent.
- Germany’s 10-year yield didn’t move much and stayed at 0.15 percent.
- Britain’s 10-year yield reacted to Brexit and jumped one basis point to 1.22 percent.
Commodities
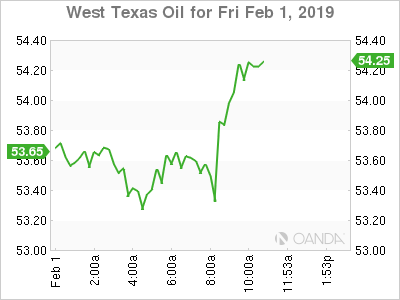
- West Texas Intermediate crude moved higher by 1 percent to $54.29 a barrel, thanks to OPEC curbing supply.
- Gold erased its gains and moved lower by 0.3 percent to $1,317.25 an ounce, but we maintain our upward bias.
Dollar Trades Mixed after a Strong Payrolls Beat and Soft Wages
The greenback is trading lower against the high-beta currencies despite a strong headline payroll reading of 304,000, much higher than the economists’ forecast of 165,000. The employment report showed that the prior month was revised lower by 90,000 jobs to 222,000 and that shutdown may have affected the part-time numbers, which saw a rise of almost half a million. The wage data also came out softer than expected with a 0.1% gain, much lower than the analysts’ forecast of 0.3% and the smallest gain since the fourth quarter of 2017.
The overall picture on the US labor market remains very strong and while Wall Street expects job growth to start to average readings closer to the 160,000 area, it will be hard for the Fed to avoid raising rates at least once if we do not see softness in labor.
The current implied probabilities for rate increases saw hike expectations tick higher for the September, October, and December meetings. The market still sees the probability much higher for the next move to be a rate cut. The 10-year Treasury yield rose 2.6 basis points to 2.656%.
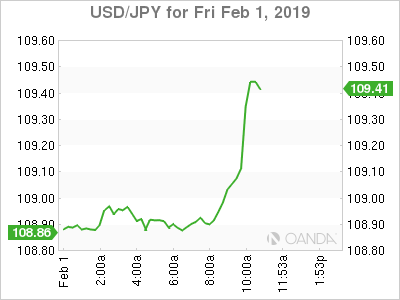
The dollar rose 0.2% against the Japanese yen, but still trades in the middle of this week’s trading range.
Oil prices also erased earlier losses following the strong NFP release.
Sunset Market Commentary
Markets
Global core bonds mostly lost ground today. German Bunds cautiously edged lower at EU openings ahead of the euro-area CPI release . EU equity markets were in no hurry to follow US/Asian equities higher and balanced between gains and losses. Risk sentiment deteriorated through the day. The January core CPI printed little higher than expected (1.1% vs 1.0%), while headline inflation decreased to 1.4% due to the decline in oil prices. The German yield curve is steepening with changes varying between -1.2 bps (2-yr) to +1.0 bp (30-yr). After yesterday’s rally, US Treasuries hardly moved in the run-up to the payrolls release and the US opening . The change in Nonfarm Payrolls printed way above expectations, pushing the Treasuries south. The US yield curve edged higher with gains up to +3.2 bps (5-yr). Peripheral spreads vs. the German 10-yr yield remain stable today with the exception of Italy (+16 bps) and Greece (+6bps). Italian BTP’s are falling as local news reported that the government is discussing the possible need for budget adjustments since the country is officially in a technical recession. Greece on its turn is said to fall behind on post-bailout commitments.
Swings in the EUR/USD cross rate were modest compared to the previous days. On Wednesday evening, the dollar declined on a soft Fed. Yesterday, most of Wednesday’s EUR/USD decline was reversed due to euro weakness driven by ongoing disappointing news from the EU. This morning, EUR/USD bottomed in the 1.1434/40 area and even succeeded a cautious technical rebound. EMU eco data (Final PMI’s and EMU CPI’s) were again soft, but close to expectations. In the US, the payrolls remain very strong. The report caused a very brief EUR/USD down-tick, but then move had no strong legs. EUR/USD is currently trading in the 1.1465/70 area, awaiting the ISM non-manufacturing report. We conclude from today’s price action that yesterday’s euro selling has eased. USD/JPY is gaining marginal ground and hovers in the 109 area.
Sterling fell prey to further profit taking. There was little high profile news on Brexit. However, after the votes in Parliament earlier this week, investors are still pondering the remaining chances on a Brexit delay. A lower chance for such a delay scenario is seen as (tentative) negative for sterling. EUR/GBP started a gradual intraday uptrend this morning in Europe. The EUR/GBP rebound accelerated as the UK January manufacturing PMI dropped more than expected. UK firms are building stockpiles, but production and orders are slowing. A scenario of soft growth, whatever the outcome of Brexit, gives the BoE also time to be patient on a next rate hike. EUR/GBP is trading in the high 0.86 area. Cable (1.3060 area) declines both on sterling softness and post-payrolls USD strength.
News Headlines
US payrolls showed net job growth of 304k in January, significantly beating 165k forecast and recording a best ever 100 straight month of gains. The December reading faced a big downward revision though, from 312k to 222k. The unemployment rate unexpectedly increased from 3.9% to 4%, but this was accompanied by an uptick in the participation rate from 63.1% to 63.2%, the highest since 2013. Average hourly earnings disappointed, rising only by 0.1% M/M (& 3.2%Y/Y) vs 0.3% M/M forecast.
Headline EMU inflation slowed as expected from 1.6% Y/Y to 1.4% Y/Y, but underlying core inflation picked up from 1% Y/Y to 1.1% Y/Y. Services inflation stood at 1.6% Y/Y with package holidays air fares probably playing a role. The final January EMU manufacturing PMI was confirmed at 50.5.
ISM manufacturing rose to 56.6, reversing December’s weak expansion
US ISM manufacturing rose to 56.6 in January, up from 54.1 and beat expectation of 54.3. Price paid index dropped to 49.6, below expectation of 58.0. Employment component dropped slightly to 55.5. Of the 18 manufacturing industries, 14 reported growth.
ISM noted that "Comments from the panel reflect continued expanding business strength, supported by strong demand and output. Demand expansion improved with the New Orders Index reading returning to the high 50s, the Customers' Inventories Index remaining too low, and the Backlog of Orders remaining at a near-zero-expansion level. Consumption continued to strengthen, with production expanding strongly and employment continuing to expand at previous-month levels. Inputs — expressed as supplier deliveries, inventories and imports — continued to improve, but are negative to PMI® expansion. Inputs reflect an easing business environment, confirmed by Prices Index contraction.
"Exports continue to expand, but at the lowest level since the fourth quarter of 2016. Prices contracted for the first time since the first quarter of 2016. The manufacturing sector continues to expand, reversing December's weak expansion, but inputs and prices indicate fundamental changes in supply chain constraints."