Week beginning 4 February 2019
- RBA forecasts to be consistent with on hold policy.
- RBA: policy meeting, Governor Lowe speaks, Statement on Monetary Policy.
- Australia: dwelling approvals, retail sales, trade balance, Banking Inquiry Report.
- NZ: residential building consents, labour force, labour cost index.
- China: Caixin services PMI.
- UK: BOE policy decision.
- Europe: retail sales, Sentix investor confidence.
- US: Fed Chair Powell speaks, factory orders.
- Key economic & financial forecasts.
Information contained in this report current as at 1 February 2019.
RBA Forecasts to be Consistent With On Hold Policy
After the usual summer recess the Reserve Bank will conduct its Board meeting on February 5, followed by a speech from Governor Lowe on February 6 and the February Statement on Monetary Policy which will print on February 8.
Of course there will be no rate change following the Board meeting but there will be considerable interest in the Governor’s Statement and the subsequent communications.
Recall that the minutes of board meetings have usually contained words along the lines of “members continued to agree that the next move in the cash rate was more likely to be an increase rather than a decrease.” Alternatively the November Statement on Monetary Policy noted “further reducing unemployment and ensuring inflation is consistent with the target. If that progress is made higher interest rates are likely to be appropriate at some point.”
But those sentiments were expressed when markets had been anticipating rate hikes. At the beginning of 2018 when Westpac was predicting the cash rate would remain on hold in both 2018 and 2019, markets had priced–in a full 25bps rate hike by end 2018. Today, markets are assessing that the next move in the cash rate will be down by 25 basis points with a probability of 60% (15bps) by year’s end.
In defence of the economists, only 11 of the 20 forecasters (Bloomberg Survey, January 12, 2018) predicted a hike or hikes in 2018 but this group did include the other three major banks, AMP, and most major investment banks. There is no survey evidence to check how many of the “no–change nine” supported the Westpac view that rates would remain on hold through 2019 as well. Since that survey in January last year Westpac has extended its “on hold view” through 2020. Turning to today, there is also, at this stage, little support from the economists for the “market view” which is pricing rates to be cut by end 2019.
The key as to whether the Reserve Bank will placate markets and adopt a pure neutral bias by eliminating the “next move up” in its commentary will hinge on how it reassesses its forecasts which will be released with the February Statement on Monetary Policy (SOMP) on February 8.
Recall that, based on its forecasts in the November SOMP, the conclusion that the cash rate would eventually rise was reasonable.
Growth was forecast at 3.5% in 2018; 3.25% in 2019; and 3% in 2020. Trend growth is assessed by the RBA as 2.75% (1 ppt for productivity growth and 1.75 ppts for labour force growth).
Three consecutive years of comfortably above trend growth could be expected to erode significant excess capacity and boost employment growth so that inflation would lift into the 2–3% target range and the unemployment rate would approach the NAIRU. Accordingly, the Bank forecast core inflation to lift to 2.25% in 2019 and 2020 and the unemployment rate to fall to 4.75% by end 2020.
The December quarter inflation report printed underlying inflation at 0.4% and headline inflation at 0.5%. These numbers were around market expectations although there was a “whisper” number in markets of somewhat lower. Importantly, the print for underlying inflation for 2018 was 1.7% – in line with the Reserve Bank’s forecast from its November SOMP.
The November inflation forecasts for 2019 and 2020 are 2.25% – a marked lift from the 2018 actual of 1.7% but it is likely the Bank will persist with this confident signal in its February forecasts. Even if it decides to lower the 2019 forecast to 2.0% in recognition of a lower growth forecast for 2019 the number would still be in the target zone (2–3%) and the gradual progress would be emphasised by maintaining the forecast for 2020 at 2.25%.
Their views on the labour market have been cautious. The unemployment rate has already reached 5% while the Wage Price Index growth rate has lifted in recent quarters to 2.3%. Scrutiny of a chart which, for the first time, was provided in the November SOMP points to a cautious forecast of WPI annual growth reaching 2½ per cent by end 2020.
However, the September quarter GDP report has disrupted the RBA’s comfortable position on the growth outlook. With growth only printing 0.3% in that quarter it would be necessary for the December quarter to print 1.2% to achieve the November forecast of 3.5%. The 2018 growth forecast is likely to be lowered from 3.5% to 3.0%. But what will this mean for the 2019 and 2020 forecasts?
We know that the Bank has assessed a minimal wealth effect on consumption and the Q3 growth report is unlikely to have changed that view. Even further negative evidence on house prices in Sydney and Melbourne is unlikely to change the qualitative assessment that the wealth effect was minimal while house prices were booming and therefore will be minimal in reverse. RBA Director Harper recently played down any evidence of a wealth effect in an interview with Dow Jones late last week.
Westpac differs in that regard pointing to a fall in the savings rates in NSW and Victoria over the year to September 2018 of 1.7 ppt’s in NSW and 1.9 ppt’s in Victoria. We expect some reversal of that effect in 2019 and 2020 pushing growth in consumer spending down from our previous forecast of 2.6% in each year to 2.4%. Our simulation work suggests that the impact on consumption of this negative wealth effect may be significantly larger. We expect the Bank will maintain its current view that consumption growth will run at 3% in both 2019 and 2020.
We also differ on the likely downtrend in residential construction in 2019 and 2020, “Dwelling investment has remained high and… should remain at a high level for the next year or so” (Nov SOMP). Based on the recent falls across the board in dwelling approvals (detached and multi) we look for a 8% fall in new dwelling construction in 2019 and 5% decline in 2020.
Westpac’s growth forecasts are 2.6% in 2019 and 2.6% in 2020. Those forecasts are only slightly below trend and consistent with steady rates in 2019 and 2020.
We expect the RBA will forecast growth of 3% in 2019 and 3% in 2020. That higher growth will reflect a limited slowdown in housing construction and no meaningful wealth effect. Those growth forecasts are still above trend and likely to ensure the view that the next move in rates will be up.
Indeed, in his comments to Dow Jones, Director Harper repeated the expectation that the next move in rates will be up. While he emphasised these were his own views it is important to point out that Dr Harper has a distinguished past in the Research Department of the Bank. Some of the Bank’s senior executives would have been colleagues. His comments carry much more weight than the personal observations of an outside director.
Of course we need to be mindful that the comments preceded the shock from the monthly NAB Business Survey that showed a collapse in business conditions (business confidence held around previous levels). Risks around business surveys that are taken in January must be recognised. Indeed that particular survey has shown some volatile movements around the Christmas period. It is doubtful that the Bank would change its longstanding rhetoric on the basis of a January Business Survey.
If, however, we thought the RBA was likely to lower its growth forecasts in 2019 and 2020 to 2.5% or less then we would certainly expect it to adopt an easing bias.
Other factors which may impact market thinking are the higher recent levels of BBSW and associated out of cycle hikes by some banks. The RBA will probably view those developments as likely to exacerbate housing price weakness but due to an insignificant wealth effect, will be unlikely to materially change their forecasts.
Accordingly, despite lowering its growth forecasts for 2018 and 2019, we expect the Bank will retain its current stance that the next move in rates will be up.
The week that was
This week, inflation and business conditions were the key points of interest for Australia. Offshore, the FOMC focused on the risks to the outlook.
With the market having shifted from pricing in the probability of a rate hike to a rate cut in recent months, there was considerable interest in Australia’s Q4 2018 CPI report. While the headline reading did beat expectations (0.5% versus 0.4% consensus) for the first time in two years, the primary talking point remained the dearth of underlying inflation pressures. The average annual pace of the two core measures came in at just 1.8%, and the six–month annualized pace was weaker still at 1.5%. Both outcomes are a long way from troubling the 2.5% mid–point of the RBA’s target band. The detail of this update confirms to us that this trend will persist hence.
Key to enduring weakness in aggregate inflation is housing. Disinflation in rents and house purchase costs continue to hold this key component of the CPI (15% of total) at multi–decade lows. Inflation for appliances and furniture has firmed over the past year, arguably owing to pass–through from the weaker Australian dollar, but inflation in this sector is still very soft at just 1.0%yr. The effect of competition in the retail sector is also on display in ongoing deflation for clothing and footwear. Come Q1 2019, headline inflation will be hit by oil price declines (0.1%; 1.4%yr). Annual underlying inflation is set to remain unchanged at 1.8%yr, on our preliminary forecasts.
The January update for the NAB business survey was certainly attention grabbing, with business conditions suffering their largest monthly decline since the GFC to +2 – the softest read since September 2014 and a long way below the +18 average of the first half of 2018. Business confidence was unchanged in the month at +3, but that reading is still below average and also well down from +9 in the first half of 2018. Admittedly, this survey can suffer from abnormal seasonal fluctuations, but if taken literally, these outcomes indicate policy makers’ expectations for above–trend growth should be marked materially lower.
Shifting offshore, the FOMC’s January meeting was the key event this week. In the decision statement and Chair Powell’s press conference, caution over the outlook was paramount. This is not because their view of the US real economy has soured, but rather owing to the many cross–currents (risks) they perceive. Top of their list of concerns are decelerating growth in China and the broader global economy as well as the potential effect Brexit could have on the UK and Europe, and hence on the US. Also being watched carefully is US fiscal policy. While their Federal government has been reopened, it is only for three weeks. A lasting solution to this political malaise seems a long way off, so too the safe–guarding of confidence. We continue to see two further hikes from the FOMC in June and September 2019, but this is conditional on the above cross–currents abating and the US real economy asserting its strength.
In Europe, Q4 GDP met market expectations for a subdued 0.2% increase. Annual growth of 1.2% through the year saw the annual average for 2018 decline from 2.5% to 1.8%, slightly below the ECB’s December projections of 1.9%. As this is only the initial flash estimate, detail is scarce, but national agency releases provide some information on the country breakdown. Here, France recorded 0.3% as exports offset stalling consumption; Spain surprised to the upside with 0.7% growth, continuing a robust trend; while the headline–grabber was Italy, a 0.2% contraction marking a technical recession. On a more positive note, employment data in the week showed the unemployment rate finished 2018 at 7.9%, continuing progress from the 8.6% recorded at the end of 2017, and consumer confidence readings edged up from earlier declines. Ultimately that paints a picture not too dissimilar from other global economies: a strong labour market counterpoised by fading growth momentum amidst a cloud of general geopolitical uncertainty.
Finally on China, the official NBS PMI remained below 50 for a second consecutive month in January as a result of continued weakness in external demand (new export orders remained at a low back to end–2015) and the backlog of work to be completed being depleted further. This clearly highlights the effect of softening global growth on China’s economy. Pleasingly though, the services PMI strengthened in the month to be in line with the average of 2017 and 2018. This result highlights the robust health of their domestic economy in trying circumstances. With authorities having seen results from their drive for quality growth, and given cyclical momentum is now being encouraged, domestic momentum should remain robust in 2019.
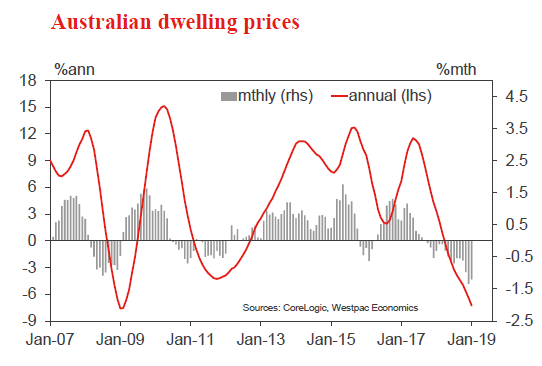
Chart of the week: Australia CoreLogic home value index
Australia’s housing market correction broadened and accelerated through late 2018 and very early 2019. The CoreLogic home value index, covering the eight major capital cities, fell a further 1.2% in Jan following a 1.3% decline in Dec and a 0.9% fall in Nov. Prices nationally are down 6.9%yr and are now 7.8% below their Sep 2017 peak, eclipsing the (much slower) 2011–12 price correction but still milder than the price fall during the GFC.
While the result is for the first month of 2019, in practise it speaks more to the extent of weakness in late 2018. Markets are essentially closed from late Dec through to early Feb with turnover typically 25–30% below average (possibly lower given current market conditions). This pattern also generates some seasonal price weakness as sellers outnumber buyers although the effect is marginal – adding about 0.3ppts to monthly declines – and does not detract what is an unambiguously weak picture over the last 3mths.
New Zealand: week ahead & data wrap
A smaller and slowing boost to the economy
One of the key drivers of economic activity in recent years has been rapid population growth on the back of high levels of net migration. Strong inflows of new migrants and low departures of New Zealanders have provided a powerful boost to spending and also generated a strong need to build homes. At the same time, the related increases in the labour force have boosted the economy’s productive capacity and helped to address skill shortages in some sectors.
Stats NZ has recently taken a closer look at movements in and out of the country over the past few years, and this has revealed some important trends. It turns out that a larger proportion of the people who arrived in recent years only came on a temporary basis. This means that the increase in permanent and long–term migration, and the related change in New Zealand’s resident population, has been smaller than was thought. Earlier estimates had suggested that annual long–term migration had risen to a peak of 72,500 in mid–2017. However, Stats NZ’s updated estimates have revealed that long–term migration actually peaked at a lower level of around 64,000 back in mid–2016. The latest estimates have also shown that net migration has now fallen to an annual rate of around 43,000 – a level that’s around 20,000 lower than initially thought. Looking at the past four years as a whole, this means that around 47,000 fewer people settled in New Zealand on a long–term basis than had been estimated (that’s close to 1% of New Zealand’s total population).
The size of this revision may seem surprising given that New Zealand keeps tight control on the number of people crossing its borders. But while we have good information on the numbers of people entering and leaving the country, the duration of their stay can be harder to track. Some people who plan to visit for a temporary period may end up staying permanently. Alternatively, some of those who plan to stay on a long–term basis might end up departing sooner than expected. The difference is important. Permanent or long–term migrants (those who remain onshore for more than a year) will have a larger impact on the country in terms of their spending, employment, and their housing needs. Those who enter the country on a shorter–term basis (less than a year) still contribute to the economy, but the impact is likely to be smaller and less enduring.
Previously, Stats NZ used people’s stated intentions on arrival and departure cards to estimate how long people planned to stay in the country (this is sometimes referred to as the ‘intentions’ approach). They are now using an ‘outcomes’ based approach that looks at actual movements in and out of the country. This is a bit more complex to estimate given the time needed to track people’s movements across borders. But over time, it should give a more accurate estimate of what’s actually happening to migration flows.
The updated migration estimates have shown that both long– term arrivals and long–term departures have been higher than previously thought. The revision to departures has been the bigger of the two, meaning that the level of net migration has been lower. The difference has been heavily centred on those aged 20 to 29. This age group will include a large proportion of international students, as well as those on temporary work or working holiday visas – all groups that tend to be highly mobile. In other words, more young foreign people have been leaving New Zealand than initially thought.
This still leaves us with a picture of strong overall inflows into the country in recent years. However, a greater proportion of those inflows were on a short–term or temporary basis. Those temporary arrivals will have added to demand and they still needed somewhere to stay, but have probably provided a smaller boost to economic conditions than permanent migrants would have.
Lower long–term migration will have a number of important implications for the economy and it reinforces our expectations for a cooling in GDP growth and the housing market over the next few years. This will also be important for the labour market.
Lower longer–term migration means that population growth has been slower than expected in recent years. Stats NZ’s next update on the population level won’t be out for a few weeks. When released, we expect that those figures will reveal New Zealand’s population is currently smaller than previously believed. We estimate that annual population growth peaked at 2% in 2016 and has since slowed to 1.5%. Those are still solid rates of population growth, but would be a fair bit slower than was initially thought. Furthermore, with net migration continuing to trend down, it implies smaller increases in the nation’s demand base over the next few years. That will be important for many businesses, meaning than an ‘easy’ source of demand growth that they’ve enjoyed in recent years is dissipating even faster than expected.
Lower net migration and population growth will also have a major impact on residential construction. For some time, we have been highlighting that the rate of dwelling construction was catching up with population growth. We predicted that as population growth slowed, housing shortages would begin to ease in the coming few years, and therefore the outlook was for moderate growth in construction activity. These data revisions reinforce that view. It now looks as though residential consent issuance is already at the level required to keep up with population growth. And with fewer migrants settling here on a long–term basis, the number of homes that will eventually be required is lower than previously thought.
These trends will be particularly important for Auckland which has experienced an especially large population cycle. However, their impact will be felt more widely. Many other regions are currently seeing high levels of home building, and the durability of those cycles looks increasingly doubtful, especially given the policy– induced slowdown in the housing market already in train. We’ll take a closer look at the extent of changes in the construction outlook in our upcoming February Economic Update.
Data Previews
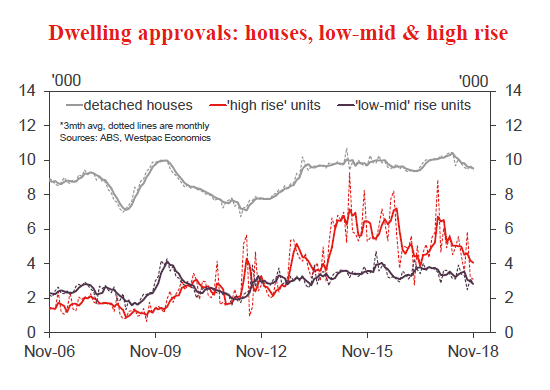
Aus Dec dwelling approvals
- Feb 4, Last: –9.1%, WBC f/c: 1.5%
- Mkt f/c: 2.0%, Range: 0.0% to 5.0%
Dwelling approvals dropped 9.1% in Nov, a sharp fall following a 1.4% decline in Oct. ‘Units’ lead the fall, dropping 18% in the month, the detail suggesting weakness was across both ‘high rise’ and ‘mid–rise’. Private detached house approvals were also down 2.6%, a sizeable decline for a more stable component.
High rise approvals are likely to show a ‘technical’ bounce in Dec simply from monthly noise. However, this is expected to be muted with activity in the segment still taking a sharp move lower – recent monthly levels are where we expect high rise approvals to eventually settle. Importantly, finance indicators suggest the weakness in the larger ‘non high rise’ segment is likely to continue. On balance, we expect only a modest 1.5% gain for total approvals in the Dec month, leaving a clear underlying downtrend firmly intact.
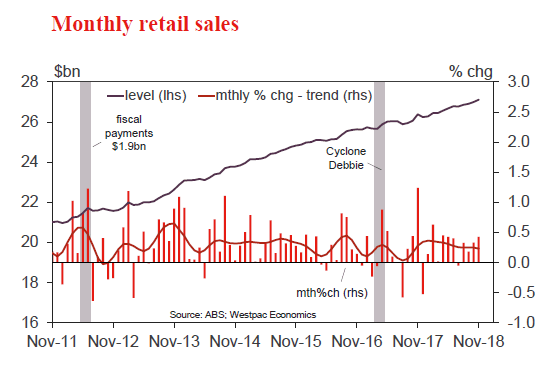
Aus Dec retail trade
- Feb 5, Last: 0.4%, WBC f/c: –0.2%
- Mkt f/c: 0.0%, Range: –0.5% to 0.4%
Retail sales rose 0.4% in Nov following steady gains averaging 0.3%mth through Aug–Oct and a flat result in July. Sales growth is tracking a 3.3% annual pace over the six months.
Some of the Nov gain looks to have been due to the increasingly popular ‘Black Friday’ sales event – our estimates suggest online retail sales were up over 6% in the month, implying retail ex online had a more subdued 0.1% gain. Some post event ‘let down’ is likely.
With consumers turning cautious late in the year – Christmas spending plans down on a year ago – and both anecdotes and private sector business surveys pointing to disappointing holiday sales for retailers, we expect total retail sales to show a 0.2% dip for the Dec month.
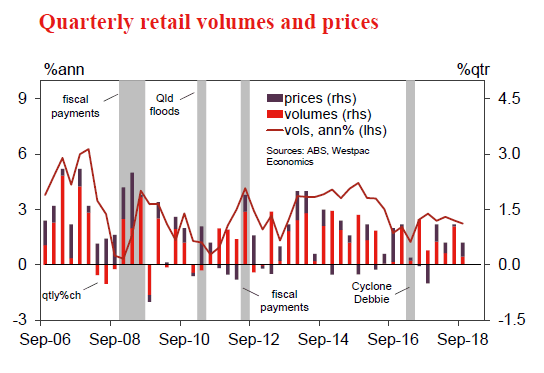
Aus Q4 real retail sales
- Feb 5, Last: 0.2%, WBC f/c: 0.2%
- Mkt f/c: 0.5%, Range: 0.0% to 0.9%
The Q3 retail report was soft with sales volumes rising just 0.2% compared to a 1% gain in Q2. Sales have been choppy quarter to quarter, annual growth slowing to a subdued 2.2%yr.
The Q4 update is likely to show another soft read. Nominal sales are tracking towards a reasonable 0.8% gain for the quarter, up from 0.6% in Q3. However, the Q4 CPI detail shows retail prices were firmer with food, meals out and household goods all recording notable rises.
Overall we expect the retail deflator to show a 0.6%qtr gain, vs +0.4% in Q3. That in turn points to retail volumes being up just 0.2% for the quarter. Back to back subdued results mark a break from the choppy quarterly profile over the last two years and will be the first confirmation of a more subdued growth trajectory for consumer demand.
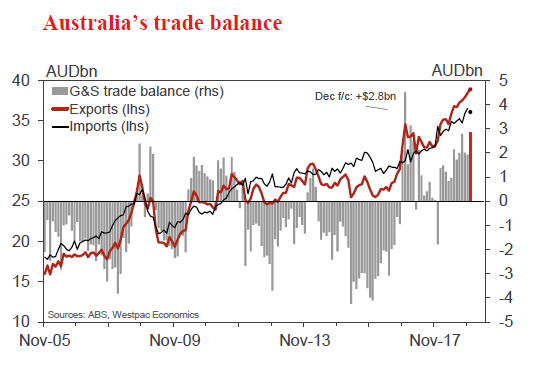
Aus Dec trade balance, AUDbn
- Feb 5, Last: 1.9, WBC f/c: 2.8
- Mkt f/c: 2.2, Range: 1.8 to 4.5
Australia’s trade account remains firmly in surplus, with the December update expected to make it 12 from 12 for 2018.
The surplus is expected to move higher, to a forecast $2.8bn, following a $1.9bn outcome in November.
We anticipate a moderation in the import bill, down –1.2%, following strong showings over October (+3.4%) and November (+1.7%).
Export earnings are expected to rise, +1.2%, supported by a rise in coal (volumes and prices) and by the lower dollar – which was –0.8% vs USD and –1.3% on a TWI basis.
As to risks: global energy prices fell sharply late in 2018 but to date this is not evident in the official trade data – we may yet see an impact on imports and more so on exports.
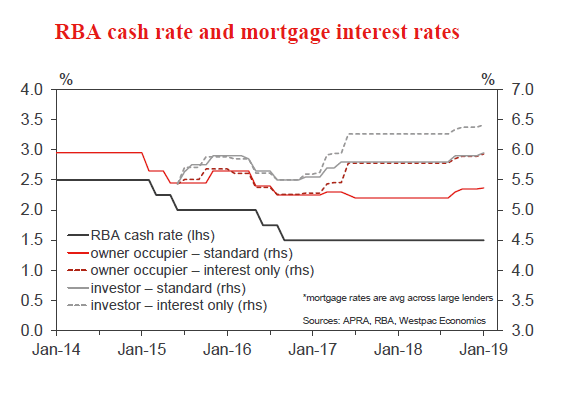
Aus RBA policy announcement
- Feb 5, Last: 1.50%, WBC f/c: 1.50%
- Mkt f/c: 1.50%, Range: 1.50% to 1.50%
The Reserve Bank last moved rates in August 2016 (a cut) and last raised rates in November 2010.
We expect the RBA to leave rates unchanged in 2019 and in 2020.
While markets widely expect no move at the February meeting, the first for the year, there is speculation as to whether the Bank will soften their stance.
As discussed above, on page 2, we expect the RBA to remain positive on the outlook, albeit marking down their growth forecasts somewhat.
The Bank will anticipate that further progress on inflation and unemployment will be (very) gradual – suggesting steady rates for some time yet.
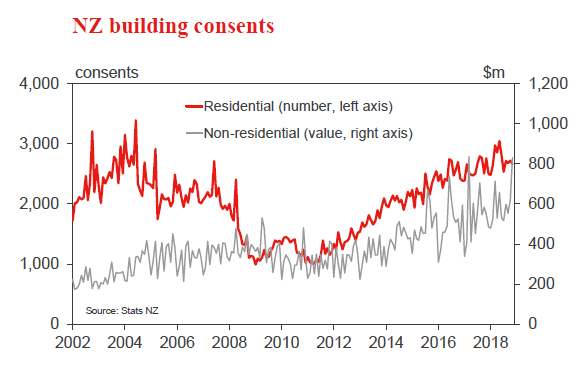
NZ Dec residential building consents
- Feb 4, Last: –2.0%, WBC f/c: +3.5%
Residential dwelling consent issuance fell by 2% in November. That decline related mainly to apartment consents, which can be lumpy on a month–to–month basis. The underlying level of consents remains elevated.
We expect to see a modest 3.5% gain in consent issuance in December with issuance in Auckland and other regions remaining firm, while activity in Canterbury continues its gradual downtrend.
We expect that building activity will remain at firm levels over the next few years. However, with consent issuance now running at levels commensurate with population growth, further increases are likely to be moderate.
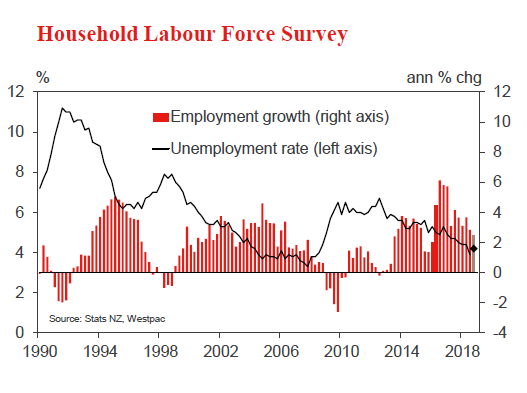
NZ Q4 Household Labour Force
- Feb 7, Employment last: +1.1%, WBC f/c: +0.2%, Mkt f/c: +0.3%
- Unemployment last: 3.9%, WBC f/c: 4.2%, Mkt f/c: 4.1%
A range of evidence points to an increasingly tight labour market over 2018. Firms are having increasing difficulty in finding workers, and households’ perceptions of job opportunities are at a ten–year high.
However, the drop in the unemployment rate from 4.4% to 3.9% in the September quarter was unusually large, and looks vulnerable to a correction. We’re assuming a partial unwind to 4.2% in the December quarter, which would still be consistent with an improving trend.
Similarly, we expect that last quarter’s 1.1% surge in employment (despite weak GDP growth of just 0.3%) will be followed by a subdued December quarter result.
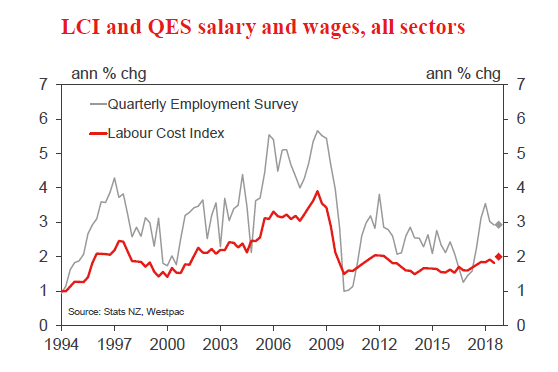
NZ Q4 Labour Cost Index
- Feb 7, Private sector last: 0.5%, WBC f/c: 0.5%, Mkt f/c: 0.6%
We expect a 0.5% increase in private sector wages for the December quarter, with the recent nurses’ pay agreement boosting total wage growth to 0.6%.
Despite a tight labour market, there has been limited evidence of a pickup in wage growth so far, outside of government–mandated increases such as fair pay agreements and minimum wage hikes.
However, the LCI is by design a slow–moving series. The QES average hourly earnings measure tends to be more responsive, and has seen a more substantial pickup compared to the LCI in recent times.
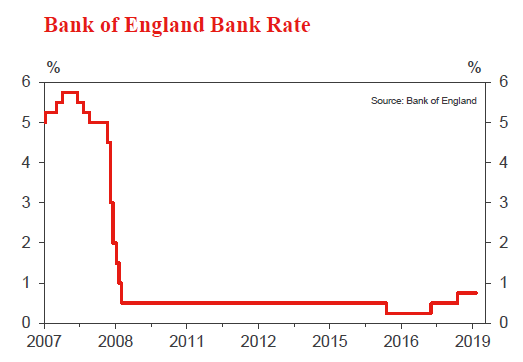
UK Bank of England Bank Rate
- Feb 7, Last: 0.75%, WBC f/c: 0.75%
With Brexit continuing to cast a long shadow over the economic outlook, there’s no chance of a rate hike at the February MPC meeting.
Once again, the focus will be on the BOE’s rhetoric and its description of the risks around the outlook. In December, the BOE maintained a very modest tightening bias, noting that a gradual and limited tightening in the Bank Rate would be appropriate if the economy evolved as expected. However, the Bank’s assessment was contingent on a smooth Brexit transition – an outcome that looks increasingly doubtful. The global backdrop is also looking softer than in December. Given these developments, the Bank is likely to re–emphasise the conditionality of its forecasts, and its (very) mild tightening bias could be further diluted.