Sample Category Title
Elliott Wave Expects Limited Pullback In Oil
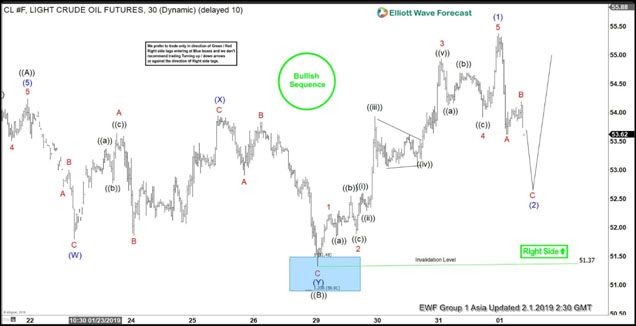
Elliott Wave view calls the rally in Oil to $54.24 ending wave ((A)). From there, the pullback ended with wave ((B)) at $51.37. Internal of wave ((B)) takes the form of a double three Elliott Wave structure. Down from$54.24, wave (W) ended at $51.80, wave (X) ended at $53.94, and wave (Y) of ((B)) ended at $51.37. From there, Oil has resumed higher and broke above wave ((A)) at $54.24. This signals that wave ((C)) has likely started.
The rally from $51.37 is proposed to take the form of a 5 waves Elliott Wave impulse. Up from $51.37, wave 1 ended at $52.24, wave 2 ended at $51.89, wave 3 ended at $54.93, and wave 4 ended at $53.92. The last move higher in wave 5 also ended wave (1) of larger degree at $55.37. Oil is now correcting the entire 5 waves rally within wave (2). The pullback takes the form of a zigzag Elliott Wave where wave A ended at $53.62 and wave B ended at $54.19.
Expect Oil to continue the pullback within wave C of (2) but the pullback should hold above $51.37 for the next leg higher. Potential area for wave (2) is $52 – $52.44 which is 100% – 123.6% Fibonacci extension of A-B. As far as pivot at $51.37, we expect Oil to resume higher. If pivot at $51.37 fails, then Oil is doing a Flat Elliott Wave structure from wave ((A)) high on January 21, 2019.
CL_F 1 Hour Elliott Wave Chart
Positive Signs From US And China Trade Talks
Market movers today
Markets are set to digest the results of the US-China trade negotiations this morning after the two sides agreed to continue talks in February.
On the data front, we have some interesting numbers today to finish off a busy week. PMIs are due to be released in many countries before noon and should give more input into the slowdown in the global economy.
We expect euro area preliminary inflation for January to decline to 1.3% y/y (consensus 1.4% y/y) down from 1.6% y/y in December. However, this is driven entirely by energy prices. Focus is instead set to be on the core inflation number, which we expect to stay unchanged at 1.0% y/y.
Later today all eyes turn to the US employment report and ISM manufacturing. We expect unemployment to rise due to the government shutdown. When it comes to payrolls, it is unclear whether the shutdown affects this, so focus is likely to be on private employment, which should be unaffected. Wage growth is also likely to draw attention. We look for a decline from 3.2% y/y to 3.1% y/y, which would cement the view that the Fed is firmly on hold now.
The ISM manufacturing index took a big dive in December. We expect it to fall a bit further in January from 54.3 to 54.0.
Selected market news
Asian stocks are mostly flat this morning, weighing up the positive signs from the trade talks between the US and China against a further fall in the Chinese Caixin PMI manufacturing index. On the trade talks, the Chinese side said in a statement that the negotiations had made 'important progress' and described the discussions as 'candid, specific and constructive'. On the US side, both Donald Trump and his top negotiator Robert Lighthizer reported substantial progress. Trump also said that he and Chinese president Xi Jinping would meet soon to try to seal a comprehensive deal. Steven Mnuchin and US Trade Representative Lighthizer are scheduled to visit China in mid-February to hold the next round of talks. We see the developments as a further sign the two sides are keen to make a deal and continue to expect a deal by the end of Q2 (75% probability). That we have not yet met any major roadblocks in the talks - even after negotiations about the most thorny issues - suggests to us that it is indeed possible to make a deal. In our view, it will still be difficult to meet the 1 March deadline but it seems increasingly likely that Xi and Trump will sign a deal at a meeting at some point in March.
Overnight, the Chinese Caixin PMI manufacturing index fell more than expected from 49.7 in December to 48.3 in January. This is the lowest reading since February 2016. However, we see the index stabilising soon in line with the official PMI index, which increased slightly yesterday on a small pickup in the export order index.
AUD/USD And NZD/USD Remain In Solid Uptrend
AUD/USD traded higher recently and broke the 0.7180 and 0.7220 resistance levels. Similarly, NZD/USD gained bullish momentum and rallied above the 0.6880 resistance.
Important Takeaways for AUD/USD and NZD/USD
- The Aussie Dollar gained traction and moved above the 0.7200 resistance against the US Dollar.
- There is a major bullish trend line in place with support at 0.7220 on the hourly chart of AUD/USD.
- NZD/USD broke many hurdles and surged above the 0.6900 resistance level.
- There is a key connecting bullish trend line formed with support at 0.6875 on the hourly chart.
AUD/USD Technical Analysis
After trading towards the 0.7080 support, the Aussie Dollar found a strong buying interest against the US Dollar. The AUD/USD pair started a solid upward move and traded above the 0.7150 and 0.7200 resistance levels.
Buyers even pushed the pair above the 0.7250 resistance and the 50 hourly simple moving average. A high was formed at 0.7295 on FXOpen and later the pair started a downside correction. It traded below the 0.7260 support and the 38.2% Fib retracement level of the recent wave from the 0.7180 low to 0.7295 high.
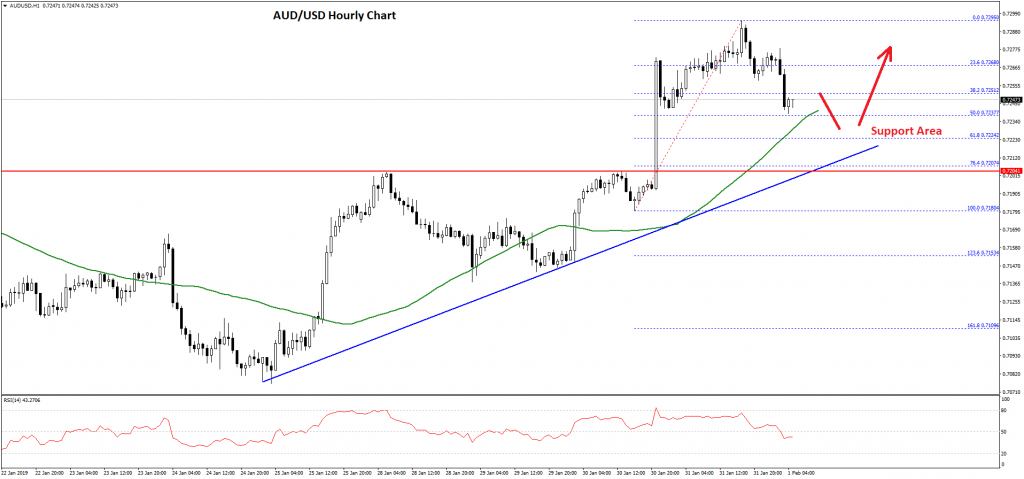
However, there are many supports on the downside near the 0.7220 level. An initial support is the 50% Fib retracement level of the recent wave from the 0.7180 low to 0.7295 high.
Moreover, the 50 hourly simple moving average is near the 0.7235 level. Finally, there is a major bullish trend line in place with support at 0.7220 on the hourly chart of AUD/USD. Therefore, if there is a downside correction, the pair is likely to find a strong buying interest near the 0.7230 and 0.7220 levels.
On the upside, an initial resistance is near the 0.7265 level, above which the pair could retest the 0.7295 swing high. Above 0.7295, the pair is likely to gain momentum above the 0.7300 and 0.7320 resistance levels in the near term.
NZD/USD Technical Analysis
The New Zealand Dollar also followed a similar structure and started a solid upward move from the 0.6750 support against the US Dollar. The NZD/USD pair broke the 0.6800 and 0.6850 resistance levels to move into a bullish zone.
During the rise, the pair also broke the 0.6880 resistance and the 50 hourly simple moving average. Finally, the pair climbed above the 0.6900 and 0.6920 levels before sellers appeared near the 0.6935 level.
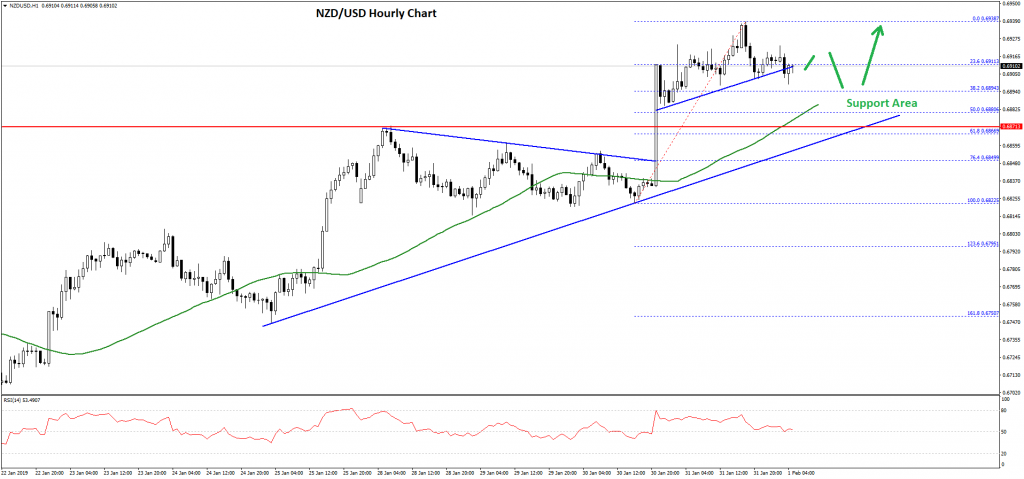
A high was formed at 0.6938 and later the pair corrected lower. It broke a connecting bullish trend line a 0.6915 on the hourly chart and the 23.6% Fib retracement level of the recent wave from the 0.6822 low to 0.6938 high.
However, there are many supports on the downside near the 0.6890 and 0.6880 levels. The 50% Fib retracement level of the recent wave from the 0.6822 low to 0.6938 high is near the 0.6880 to act as a solid support along with the 50 hourly simple moving average.
Finally, there is a key connecting bullish trend line formed with support at 0.6875 on the hourly chart. Therefore, if NZD/USD corrects lower in the short term, it is likely to find a strong buying interest near the 0.6890 and 0.6880 levels.
Euro-Zone’s Economy Expanded At Its Weakest Pace Since 2014 In 4Q 2018
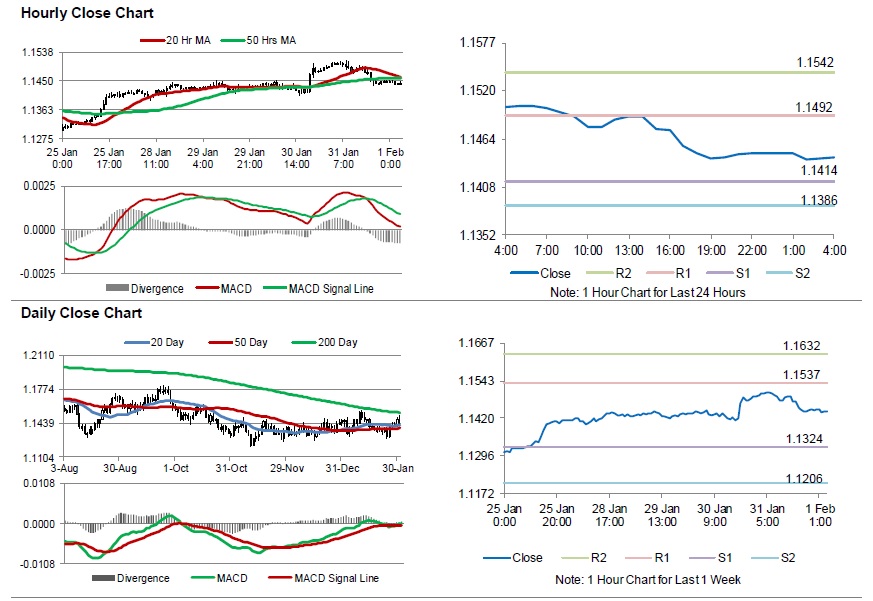
For the 24 hours to 23:00 GMT, the EUR declined 0.32% against the USD and closed at 1.1447.
On the macro front, the Euro-zone's seasonally adjusted preliminary gross domestic product (GDP) expanded at its slowest pace since 2014 by 0.2% on quarterly basis in 4Q 2018, at par with market consensus and compared to a similar rise in the prior quarter. Meanwhile, the region's unemployment rate remained unchanged at 7.9% in December, in line with market expectations.
Separately, in Germany, seasonally adjusted unemployment rate remained unchanged at 5.0% in January. Meanwhile, the nation's retail sales unexpectedly slid 2.1% on an annual basis in December, declining at its quickest pace in 11 years and defying market expectations for a rise of 1.5%. Retail sales had recorded a gain of 1.1% in the prior month.
In the US, data indicated that the US Chicago Fed purchasing managers' index dropped to a level of 56.7 in January, more than market expectations for a fall to a level of 61.5. In the prior month, the index had registered a revised reading of 63.8. Moreover, the nation's seasonally adjusted initial jobless claims advanced to a level of 253.0K in the week ended 26 January 2019, compared to a revised reading of 200.0K in the prior week. Market participants had expected the initial jobless claims to climb to a level of 215.0K.
On the contrary, the US new home sales rose to an 8-month high level of 16.9% on monthly basis, to a level of 657.0K in November. Market participants had envisaged new home sales to advance to a level of 570.0K.
In the Asian session, at GMT0400, the pair is trading at 1.1442, with the EUR trading slightly lower against the USD from yesterday's close.
The pair is expected to find support at 1.1414, and a fall through could take it to the next support level of 1.1386. The pair is expected to find its first resistance at 1.1492, and a rise through could take it to the next resistance level of 1.1542.
Moving ahead, traders would keep an eye on the Euro-zone's consumer price index for January, along with Markit manufacturing PMI for January, set to release across the euro bloc in a few hours. Later in the day, the US non-farm payrolls, unemployment rate, average hourly earnings, the Markit manufacturing PMI, the ISM manufacturing and the Michigan consumer sentiment index, all for January, followed by construction spending for December, will keep traders on their toes.
The currency pair is trading below its 20 Hr and 50 Hr moving averages.
UK’s Nationwide House Prices Index Advanced In January
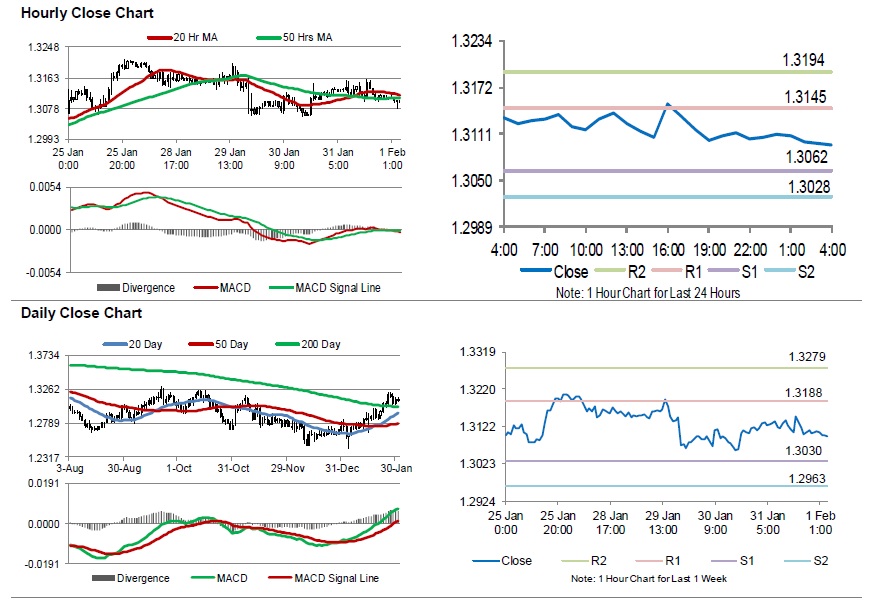
For the 24 hours to 23:00 GMT, the GBP declined 0.08% against the USD and closed at 1.3107.
In economic news, UK's seasonally adjusted Nationwide house prices index rebounded 0.3% on a monthly basis in January, compared to a fall of 0.7% in the previous month. Market participants had anticipated the index to advance 0.2%.
In the Asian session, at GMT0400, the pair is trading at 1.3096, with the GBP trading 0.08% lower against the USD from yesterday's close.
The pair is expected to find support at 1.3062, and a fall through could take it to the next support level of 1.3028. The pair is expected to find its first resistance at 1.3145, and a rise through could take it to the next resistance level of 1.3194.
Looking ahead, investors would await UK's Markit manufacturing PMI for January, scheduled to release in a few hours.
The currency pair is trading below its 20 Hr and 50 Hr moving averages.
Japan’s Unemployment Rate Unexpectedly Fell To A 26-Year Low Level In December
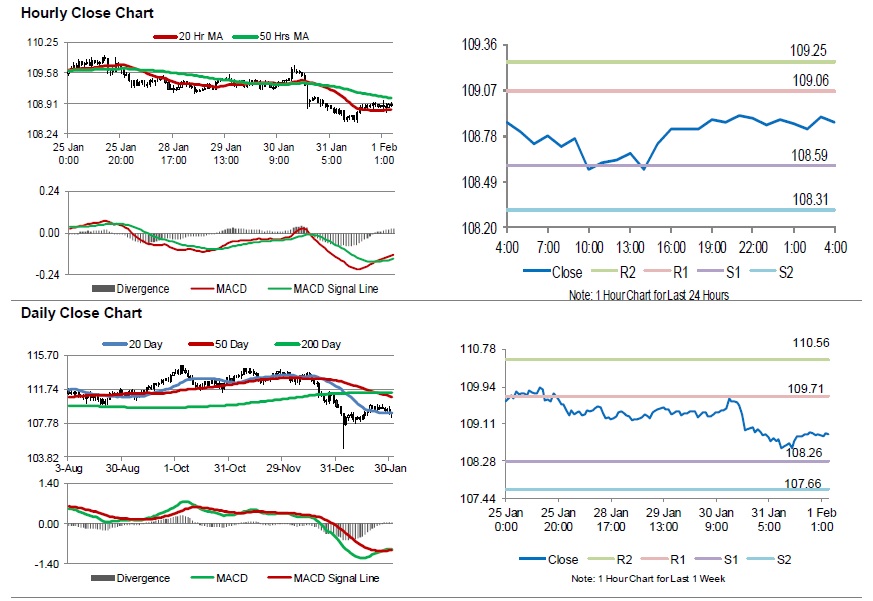
For the 24 hours to 23:00 GMT, the USD declined 0.17% against the JPY and closed at 108.85.
In the Asian session, at GMT0400, the pair is trading at 108.87, with the USD trading a tad higher against the JPY from yesterday's close.
Overnight data showed that Japan's final manufacturing PMI fell to a level of 50.3 in January, compared to a reading of 52.6 in the previous month. The preliminary figures had indicated a drop to a level of 50.0. Additionally, the nation's unemployment rate unexpectedly eased to 2.4% in December, marking its lowest level in 26-years and defying market expectations for a steady reading. Unemployment rate had registered a reading of 2.5% in the previous month.
The pair is expected to find support at 108.59, and a fall through could take it to the next support level of 108.31. The pair is expected to find its first resistance at 109.06, and a rise through could take it to the next resistance level of 109.25.
Going ahead, traders would await Japan's Nikkei services PMI and trade balance data, set to release next week.
The currency pair is trading in between its 20 Hr and 50 Hr moving average.
Swiss Franc Trading A Tad Lower In The Asian Session
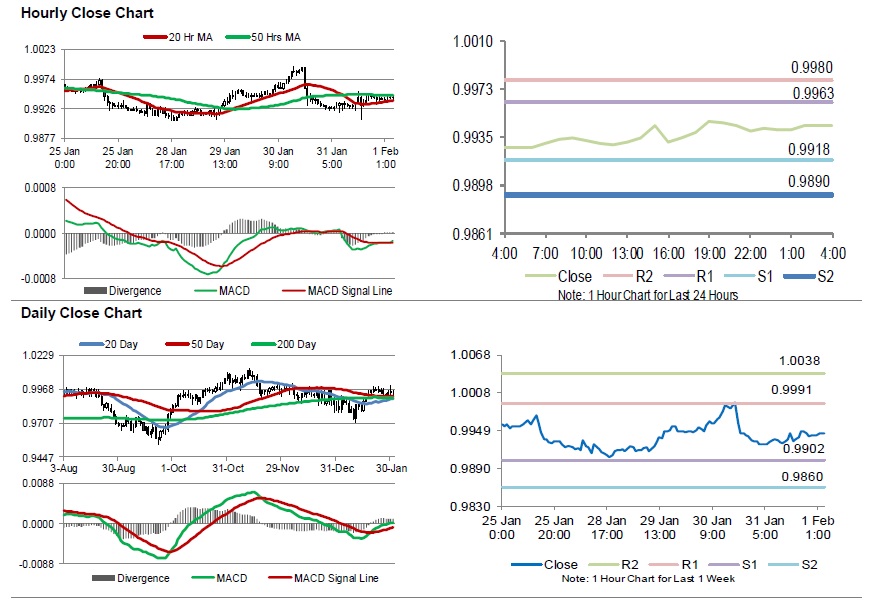
For the 24 hours to 23:00 GMT, the USD slightly rose against the CHF and closed at 0.9942.
In the Asian session, at GMT0400, the pair is trading at 0.9945, with the USD trading marginally higher against the CHF from yesterday’s close.
The pair is expected to find support at 0.9918, and a fall through could take it to the next support level of 0.9890. The pair is expected to find its first resistance at 0.9963, and a rise through could take it to the next resistance level of 0.9980.
Looking forward, investors would closely monitor Switzerland’s SECO consumer confidence index and manufacturing PMI, both for January along real retail sales for December, slated to release in a while.
The currency pair is showing convergence with its 20 Hr and 50 Hr moving averages.
Canada’s Gross Domestic Product Rose More-Than-Estimated In November
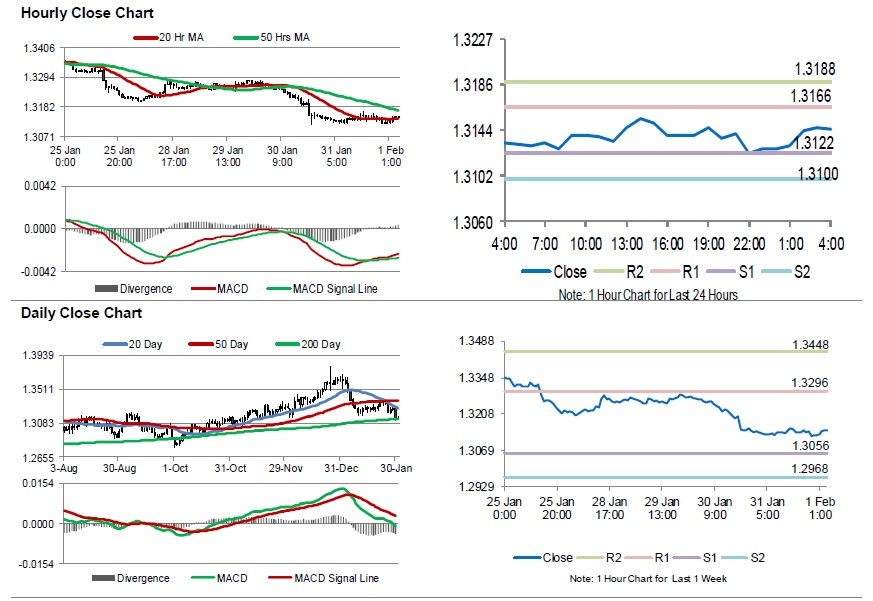
For the 24 hours to 23:00 GMT, the USD declined 0.15% against the CAD and closed at 1.3127.
Data indicated that Canada's gross domestic product advanced 1.7% on an annual basis in November, beating market expectations for a gain of 1.6%. The GDP had recorded a rise of 2.2% in the prior month. Moreover, the nation's CFIB business barometer rose to a level of 56.1 in January, following a reading of 53.6 in the preceding month.
In the Asian session, at GMT0400, the pair is trading at 1.3145, with the USD trading 0.14% higher against the CAD from yesterday's close.
The pair is expected to find support at 1.3122, and a fall through could take it to the next support level of 1.3100. The pair is expected to find its first resistance at 1.3166, and a rise through could take it to the next resistance level of 1.3188.
Trading trend in the Loonie today, is expected to be determined by Canada's MLI leading indicator for December and the RBC manufacturing PMI for January, scheduled to release later in the day.
The currency pair is showing convergence with its 20 Hr moving average and trading below its 50 Hr moving average.
Aussie Reverses Its Gains In The Asian Session
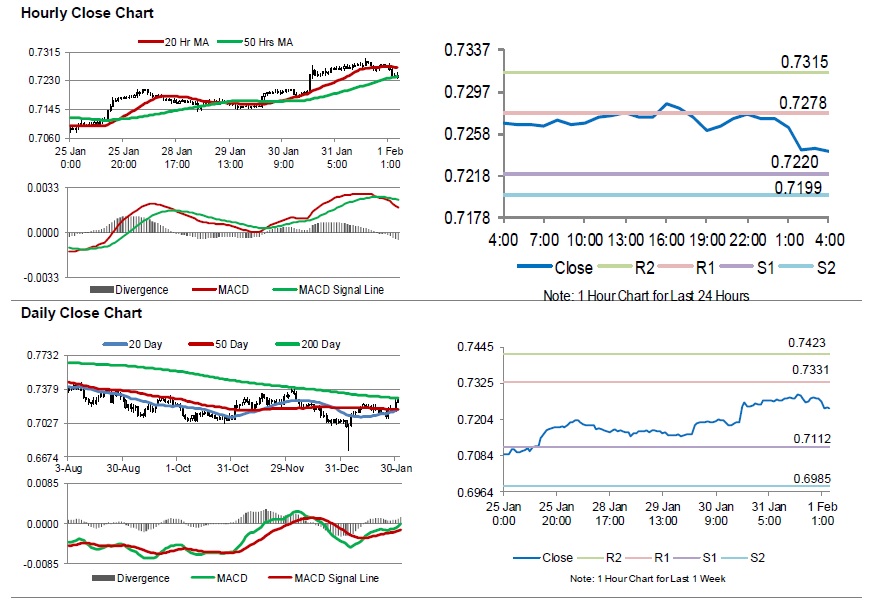
For the 24 hours to 23:00 GMT, the AUD rose 0.32% against the USD and closed at 0.7272.
LME Copper prices rose 1.2% or $71.0/MT to $6148.0/MT. Aluminium prices rose 0.5% or $9.5/MT to $1880.5/MT.
In the Asian session, at GMT0400, the pair is trading at 0.7240, with the AUD trading 0.44% lower against the USD from yesterday’s close.
Overnight data revealed that Australia’s AIG performance of manufacturing index jumped to a level of 52.5 in January, following a revised level of 50.0 in the prior month. Moreover, the nation’s producer price index advanced 2.0% on an annual basis in 4Q 2018, compared to a rise of 2.1% in the previous quarter.
The pair is expected to find support at 0.7220, and a fall through could take it to the next support level of 0.7199. The pair is expected to find its first resistance at 0.7278, and a rise through could take it to the next resistance level of 0.7315.
The currency pair is trading below its 20 Hr moving average and showing convergence with its 50 Hr moving average.
Gold: Yellow Metal Reverses Its Gains In The Asian Session
For the 24 hours to 23:00 GMT, Gold rose 0.05% against the USD and closed at USD1325.70 per ounce, following the US Federal Reserve’s decision to pause interest rate hikes in future.
In the Asian session, at GMT0400, the pair is trading at 1323.50, with gold trading 0.17% lower against the USD from yesterday’s close.
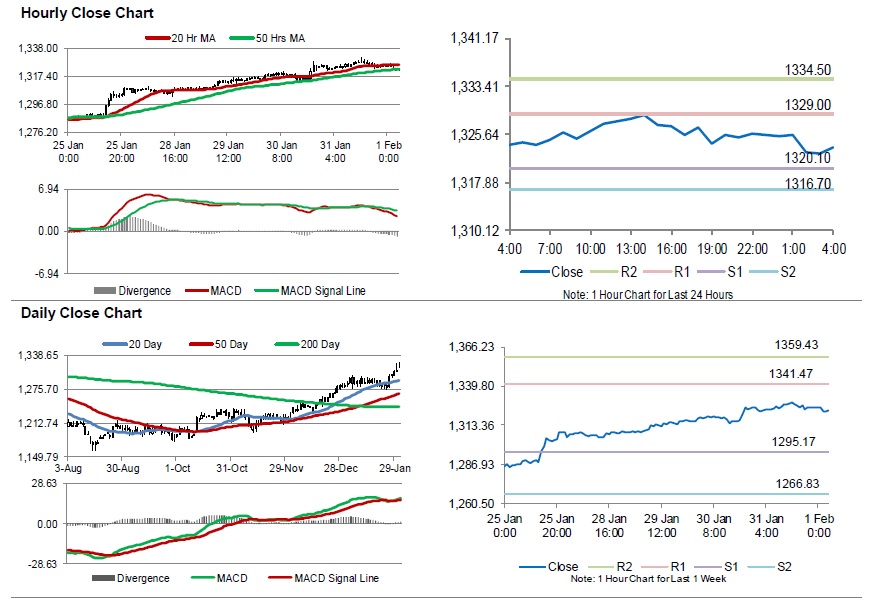
The pair is expected to find support at 1320.10, and a fall through could take it to the next support level of 1316.70. The pair is expected to find its first resistance at 1329.00, and a rise through could take it to the next resistance level of 1334.50.
The yellow metal is trading below its 20 Hr moving average and showing convergence with its 50 Hr moving average.