

Sample Category Title
Silver: White Metal Extends Its Losses In The Morning Session
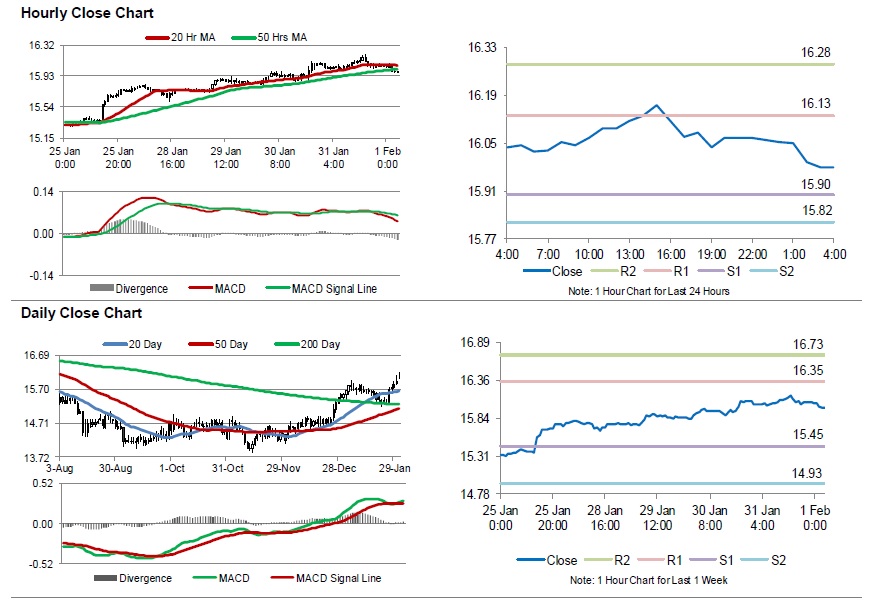
For the 24 hours to 23:00 GMT, Silver declined 0.12% against the USD and closed at USD16.06 per ounce.
In the Asian session, at GMT0400, the pair is trading at 15.98, with silver trading 0.50% lower against the USD from yesterday’s close.
The pair is expected to find support at 15.90 and a fall through could take it to the next support level of 15.82. The pair is expected to find its first resistance at 16.13, and a rise through could take it to the next resistance level of 16.28.
The white metal is trading below its 20 Hr and 50 Hr moving averages.
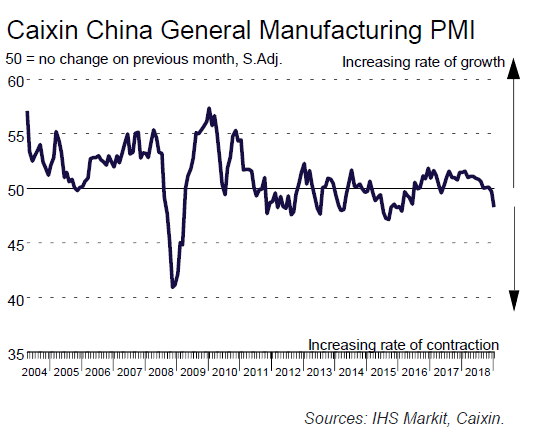
China Caixin PMI manufacturing dropped to 48.3, no significant effect from countercyclical economic policy
China Caixin PMI manufacturing dropped to 48.3 in January, down from 49.7 and missed expectation of 49.7. That's the lowest reading since February 2016 and points to continued softening in the health of China's manufacturing sector. Markit also noted that underlying trend in production weakens. Export sales increase slightly, but overall new work softens. Though, a positive note is that business confidence rose to eight-month high.
Commenting on the China General Manufacturing PMI™ data, Dr. Zhengsheng Zhong, Director of Macroeconomic Analysis at CEBM Group said:
"The Caixin China General Manufacturing PMI fell further to 48.3 in January, the lowest since February 2016.
"The subindex for new orders dipped further into contractionary territory, pointing to a moderate contraction in demand across the manufacturing sector. Yet the gauge for new export orders rose notably above the 50 level, the dividing line that separates contraction from expansion, reaching its highest point since March 2018, showing that companies' export orders have obviously rebounded since the truce in the China-U.S. trade war.
"The output subindex dropped, highlighting the drag effect of softer demand on production. The employment subindex continued to rise moderately despite staying in negative territory, which could be due to the effect of government policies to stabilize the job market. The measure for stocks of finished goods fell into contractionary territory, while the subindex for stocks of purchased items dropped further, suggesting that manufacturers tended to reduce their inventories. The subindex for suppliers' delivery times returned to negative territory, indicating that pressure on capital turnover, though less than in the months before December, still existed.
"Both gauges for input costs and output charges dropped only slightly. While companies have reduced their inventories, prices of domestic industrial products have since the start of the month recovered some of the losses seen in December. We expect that year-on-year growth in the producer price index is likely to slide closer to zero.
"On the whole, countercyclical economic policy hasn't had a significant effect. While domestic manufacturing demand shrank, external demand turned positive and became a bright spot amid positive progress in Sino-U.S. trade talks. As companies were more willing to reduce their inventories, their output declined, indicating notable downward pressure on China's economy. China is likely to launch more fiscal and monetary measures and speed up their implementation. Yet the stance of stabilizing leverage and strict regulation hasn't changed, which means the weakening trend of China's economy will continue."
Crude Oil: Oil Trading Lower, Ahead Of Baker Hughes Weekly Rig Count Data
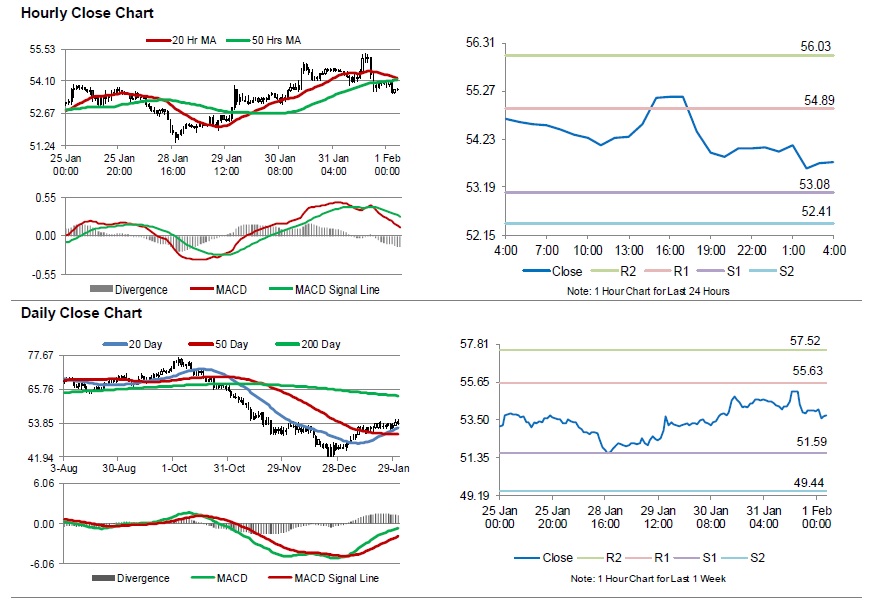
For the 24 hours to 23:00 GMT, Crude Oil declined 0.72% against the USD and closed at USD54.05 per barrel, amid renewed concerns over global economic growth.
In the Asian session, at GMT0400, the pair is trading at 53.74, with oil trading 0.57% lower against the USD from yesterday’s close.
The pair is expected to find support at 53.08, and a fall through could take it to the next support level of 52.41. The pair is expected to find its first resistance at 54.89, and a rise through could take it to the next resistance level of 56.03.
Crude oil is trading below its 20 Hr and 50 Hr moving averages.
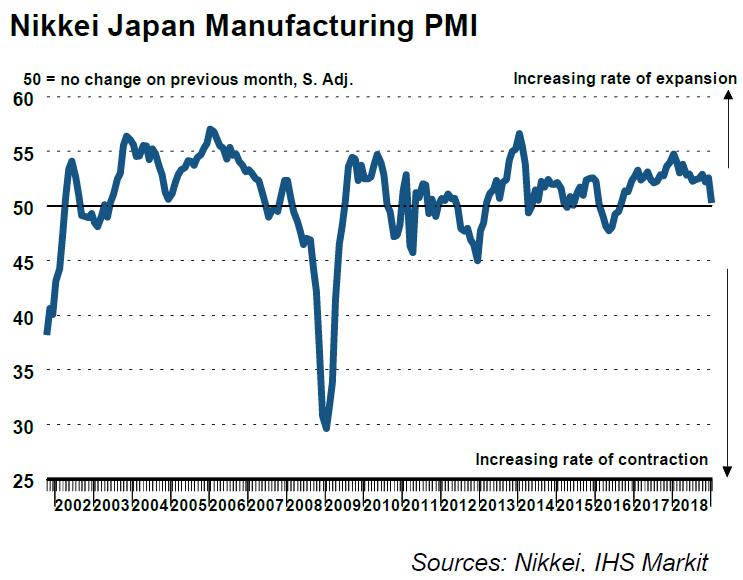
Japan PMI manufacturing finalized at 29-month low, bad news for global trade cycle
Japan PMI manufacturing was finalized at 50.3 in January, revised up from 50.0. But that's still the lowest level in 29 months. And, new export orders decline at sharpest pace since July 2016. Also, business confidence falls for the eighth month running.
Commenting on the Japanese Manufacturing PMI survey data, Joe Hayes, Economist at IHS Markit, which compiles the survey, said:
"Japan Manufacturing PMI data brought bad news for the global trade cycle at the start of 2019, with new export orders falling at the sharpest rate in two-and-a-half years. Anecdotal evidence suggested that sales of goods relating to semi-conductors had particularly suffered, which bodes ill for other Asian exporters. Meanwhile, domestic markets also showed signs of frailty as total demand declined for the first time since September 2016.
"With Abe set to levy the consumption tax this year, and Sino-US trade tensions still lurking, domestic weakness in Japan further adds to already existing challenges. Business sentiment continued to drop, with survey data registering an eighth straight month where confidence has slipped. Falling inventories and cut backs to production suggest that manufacturers are bracing for further economic difficulty."
Also from Japan, jobless rate dropped to 2.4% in December, below expectation of 2.5%.
Trump: Not quite at the stage to meet Xi to seal trade deal yet
Trump met with Chinese Vice Premier Liu He in the oval office yesterday as the two-day top level US-China trade talks concluded. Trump said in during the meeting that "we're not quite at that stage yet", referring to the meeting with Chinese President Xi JinPing. He noted the representatives of both sides were "coming to a conclusion, except for certain very important points." When he and Xi meets, "we want to have it down so that we have certain points that we can discuss and, I would say, agree to." For now the meeting wasn't set up yet.
Nevertheless, Trump hailed that Liu's promise to buy five millions tons of soybeans per days. He said " it really is a sign of good faith for China to buy that much of our soybeans and other product that they've just committed to us prior to the signing of the deal — is something that makes us very proud to be dealing with them."
On the March 1 negotiation dead line, Trump said it has stayed and "we haven't talked about extending the deadline." But he added that "at a certain point, you're going to have — this is a very complex, and a very large — it's the largest transaction ever made, to be perfectly straight." Regarding Huawei's case Trump said "it will be discussed" at some point. And it's "very small compared to the overall deal, but that will be discussed."
US Trade Representative Robert Lighthizer reiterated in the meeting that " We focused on the most important issues, which are the structural issues and the protection of U.S. intellectual property, stopping forced technology transfer, intellectual property protection, agriculture and services issues, and enforcement, enforcement, enforcement." And, "both sides agree this agreement is worth nothing — if we can get an agreement, it's worth nothing without enforcement." Lighthizer will go to China shortly, after Chinese Year Year.
During the meeting, Liu also noted the need to establish three key themes, including "enforcement or implementation."
Market Morning Briefing: Euro Has Come Off From 1.1514
STOCKS
Dow Jones (24999.67, -15.19, 0.061%) dipped down few points below the crucial resistance 25000. If the resistance holds well, then the earlier negated bearishness towards 24000 could still be possible. While a break above it could be very bullish in the coming sessions.
Dax (11173.10, -8.56, -0.077%) saw a slight dip, but continues to trade well above the immediate support at 11000. Chances of a fall to 10900 could be negated for now. Whereas the 21-MA at 11400 looks as a strong resistance on the Weekly line chart which could bring bearishness in the coming week.
Shanghai (2604.65, +20.07, +0.78%) rallied above 2580 against our expectations yesterday. It may test the resistance at 2650 followed by a fall at 2575 in the coming 2-3 session. Thus it could range sideways between 2650-2575 for some days.
Nikkei (20797.24, +23.75, +0.11%) saw a rally towards the immediate resistance 21000. While that holds the index could be pushed towards 20400 and lower in the medium-term in line with expectation.
Contrary to our expectation both Sensex (36256.69, +665.44, +1.87%) and Nifty (10830.95, +179.15, +1.68) saw a rally upwards above the support turned resistance at 35600 and 10670 respectively. Rise till 36600 and 11000 could be seen followed by bearishness in next few sessions.
COMMODITIES
Overall commodities are stable today after a sharp rise seen yesterday. Although there is more scope on the upside for Gold, silver and Copper, we could see some interim dips before an eventual rise. Crude prices could spend some time in a sideways range while immediate resistances hold.
Gold (1323) and Silver (15.99) are almost stable today and has not seen follow through after the rise yesterday. Gold could gradually head towards 1330-1350/60 in the medium term while Silver could test immediate resistance near 16.50/55. Near term looks fairly bullish but we may expect some interim dips early next week.
Copper (2.7680) has come off a bit but has scope for a rise towards 2.80/85 while above 2.75. Only if a sharp fall back to levels below 2.75 would delay the rise in the medium term.
Brent (60.90) has dipped from levels near 62.02 seen yesterday and WTI (53.75) has also come off from 54.60. There is a possibility of seeing some sideways ranged movement below 64 on Brent and 56 on WTI.
Brent could spend some time within 64-59 while WTI could range in the 50-54 region.
FOREX
Dollar Index (95.61) recovered a bit from 95.16 itself and while the support near 95 holds, the current bounce could take the index towards 96.15. The current rise is probably an interim corrective upmove before another fall is seen in the medium term.
Euro (1.1442) has come off from 1.1514 itself on corrective rise seen in the dollar Index. However, we have immediate support now at 1.14 and while that holds, we could see another leg of a rise above 1.15 in the near term.
Euro-Yen (124.59) could trade above 124.0-124.2 in the near term attempting to rise towards 125-126 levels in the near term. View is bullish for Euro-Yen.
Dollar Yen (108.89) has scope for a fall towards 107.70 on the downside but we may not expect a fall below 108 just now. The pair could soon bounce back towards 109.50-110.0 in the near term.
Pound (1.3097) has dipped and could test 1.30 support on the downside before rising back from there. A dip below 1.30, if seen and sustained could possibly turn negative for the longer term.
Aussie (0.7244) tested 0.73 yesterday and has dipped from there as expected. A fall towards 0.72 could be seen. While other currencies could appreciate against the US Dollar, Aussie could attempt a rise towards 0.7350-0.7400 in the medium term.
USD-CNY (6.7288) rose back contrary to our expectation of falling towards 6.65. Although near term support is visible at 6.65, the sharp recovery seen today could keep the upside momentum intact for a few sessions taking the pair higher towards 6.74-6.76.
Dollar Rupee (71.0850) could trade lower today aided by a lower 10Yr GOI (7.4829%) yesterday and a stronger Brent crude (60.90). A re-test of 70.90/80 could be seen while upside could be limited to 71.25.
INTEREST RATES
As expected, there has been a further decline in US yields yesterday. 2Yr down to 2.47% from 2.50%; 5Yr down to 2.45% from 2.48%; 10yr down to 2.64% from 2.68% and 30Yr down to 3.01% from 3.03%.
The 5Yr (2.45%) has broken below the rising trendline coming up from 0.9% in Jul-16 and may now move further lower towards 2.40%. The Curve has steepened at the Far end with the 30-5 Spread (0.56%) rising 1bp more from 0.55% on Wednesday. It may soon find Resistance near 0.60%. The 30-10 Spread (0.37%) also may find Resistance near 0.39% and the 10-5 Spread (0.19%) may find Resistance near 0.22%.
What this means is that the Far end of the Curve may also start falling faster in another few days.
Finally, Indian yields have come down along with US yields with the 10Yr GOI down to 7.4829%, down from 7.5515% the day before. This can help the Rupee to strengthen.
Northern Exposure: Cross-Currents Call for Patience from FOMC
The FOMC has begun 2019 on a much more cautious footing, with global risks front of mind. Further out, rate hikes are still expected.
The FOMC’s January post-meeting communications carried a much more cautious assessment of the outlook. This was not because their core view of the US’ real economy has changed materially, but rather owing to greater concern over global “cross-currents” – how Chair Powell and the Committee refer to risks.
In January, their characterisation of the US’ real economy remained robust. On the back of “strong” job gains and a “low” unemployment rate, household incomes continue to strengthen, supporting “strongly” growing household spending. Though “business fixed investment has moderated”, this is from the “rapid pace” of early 2018 – hence current momentum is still best regarded as robust.
Looking ahead, the “Committee continues to view sustained expansion of economic activity, strong labor market conditions, and inflation near the Committee’s symmetric 2 percent objective as the most likely outcomes”. With slack in the labour market very low and the federal funds rate range mid-point just below the Committee’s estimated neutral range of 2.5%–3.5%, an expectation of continued above-trend growth arguably justifies a further tightening of policy.
At present however, for the FOMC, so-called “cross-currents” (risks) are a barrier to doing so.
These risks to the central view are many and varied, and their potential combined effect on the US economy is highly uncertain. By and large, for the FOMC, these risks remain global in nature.
First port of call for Chair Powell in the press conference was the deceleration in growth seen in China and other emerging markets. Lingering trade tensions between the US and China are a factor here, one that could spark a further deterioration in conditions if ongoing negotiations fail to find a lasting solution.
The other key global risk currently in focus for the Committee is the uncertainty surrounding the UK and Europe owing to Brexit. The Committee is aware that a hard Brexit would have direct economic and financial impacts on the US, and indirect secondary consequences via confidence in the global economy. A ‘soft’ Brexit could also be negative for the US, depending on its terms.
On domestic risks, while the government shutdown of December and January has ended, the terms and timing of a lasting solution to this issue are a long way from being agreed. The re-emergence of the debt ceiling in mid-2019 and the need to decide on a new level for government spending from 1 October 2019 (after 2018/19’s extraordinary fiscal stimulus ends) means that ‘US fiscal risk’ could remain abnormally elevated through 2019.
It is therefore unsurprising that the FOMC is taking a “patient”, wait-and-see approach with policy. Rate hikes are not off the agenda for 2019, but they will have to be justified by the data flow. In the press conference, Chair Powell made clear that inflation (actual and expected) will be pivotal in any decision to hike, given above-trend growth and a tight labour market is already built into their base expectation.
Like the FOMC, we see both global and US-specific risks as likely to recede through the first half of 2019 while US growth holds above trend. Combined with an expectation that the latter will persist in 2020, this should justify a shift in the stance of policy to within the FOMC’s neutral range. 25bp hikes in June and September 2019 would take the federal funds rate to the middle of that neutral range. This stance shouldn’t impede materially on GDP growth, but would provide the Committee capacity to react to any and all eventualities. We must stress again though that this policy view is dependent on current risks dissipating and no new shocks emerging. The data and political flow will prove critical for the timing and direction of US monetary policy in 2019.
Cliff Notes: Cross-Currents Near and Far
Key insights from the week that was.
This week, inflation and business conditions were the key points of interest for Australia. Offshore, the FOMC focused on the risks to the outlook.
With the market having shifted from pricing in the probability of a rate hike to a rate cut in recent months, there was considerable interest in Australia’s Q4 2018 CPI report. While the headline reading did beat expectations (0.5% versus 0.4% consensus) for the first time in two years, the primary talking point remained the dearth of underlying inflation pressures. The average annual pace of the two core measures came in at just 1.8%, and the six-month annualized pace was weaker still at 1.5%. Both outcomes are a long way from troubling the 2.5% mid-point of the RBA’s target band. The detail of this update confirms to us that this trend will persist hence.
Key to enduring weakness in aggregate inflation is housing. Disinflation in rents and house purchase costs continue to hold this key component of the CPI (15% of total) at multi-decade lows. Inflation for appliances and furniture has firmed over the past year, arguably owing to pass-through from the weaker Australian dollar, but inflation in this sector is still very soft at just 1.0%yr. The effect of competition in the retail sector is also on display in ongoing deflation for clothing and footwear. Come Q1 2019, headline inflation will be hit by oil price declines (0.1%; 1.4%yr). Annual underlying inflation is set to remain unchanged at 1.8%yr, on our preliminary forecasts.
The January update for the NAB business survey was certainly attention grabbing, with business conditions suffering their largest monthly decline since the GFC to +2 – the softest read since September 2014 and a long way below the +18 average of the first half of 2018. Business confidence was unchanged in the month at +3, but that reading is still below average and also well down from +9 in the first half of 2018. Admittedly, this survey can suffer from abnormal seasonal fluctuations, but if taken literally, these outcomes indicate policy makers’ expectations for above-trend growth should be marked materially lower.
On that point, ahead of the RBA’s first meeting for 2019 next Tuesday and the subsequent release of their February Statement on Monetary policy on 8 February, Chief Economist Bill Evans this week provided his view on likely changes to the RBA’s forecasts. While we see the RBA marking down their growth forecast to 3.0% for 2019 and 2020, this will still imply they believe the Australian economy can and will grow above trend. In line with the deterioration in the NAB business survey, Westpac instead see growth slowing below trend to 2.6%yr in 2019 and remaining there in 2020. This will occur as a result of a weak consumer and declining housing investment, both affected by ongoing declines in house prices. On the back of their optimism, Westpac continues to believe that the RBA will remain on hold through 2019 and 2020.
Shifting offshore, the FOMC’s January meeting was the key event this week. In the decision statement and Chair Powell’s press conference, caution over the outlook was paramount. This is not because their view of the US real economy has soured, but rather owing to the many cross-currents (risks) they perceive. Top of their list of concerns are decelerating growth in China and the broader global economy as well as the potential effect Brexit could have on the UK and Europe, and hence on the US. Also being watched carefully is US fiscal policy. While their Federal government has been reopened, it is only for three weeks. A lasting solution to this political malaise seems a long way off, so too the safe-guarding of confidence. We continue to see two further hikes from the FOMC in June and September 2019, but this is conditional on the above cross-currents abating and the US real economy asserting its strength.
In Europe, Q4 GDP met market expectations for a subdued 0.2% increase. Annual growth of 1.2% through the year saw the annual average for 2018 decline from 2.5% to 1.8%, slightly below the ECB’s December projections of 1.9%. As this is only the initial flash estimate, detail is scarce, but national agency releases provide some information on the country breakdown. Here, France recorded 0.3% as exports offset stalling consumption; Spain surprised to the upside with 0.7% growth, continuing a robust trend; while the headline-grabber was Italy, a 0.2% contraction marking a technical recession. On a more positive note, employment data in the week showed the unemployment rate finished 2018 at 7.9%, continuing progress from the 8.6% recorded at the end of 2017, and consumer confidence readings edged up from earlier declines. Ultimately that paints a picture not too dissimilar from other global economies: a strong labour market counterpoised by fading growth momentum amidst a cloud of general geopolitical uncertainty.
Finally on China, the official NBS PMI remained below 50 for a second consecutive month in January as a result of continued weakness in external demand (new export orders remained at a low back to end-2015) and the backlog of work to be completed being depleted further. This clearly highlights the effect of softening global growth on China’s economy. Pleasingly though, the services PMI strengthened in the month to be in line with the average of 2017 and 2018. This result highlights the robust health of their domestic economy in trying circumstances. With authorities having seen results from their drive for quality growth, and given cyclical momentum is now being encouraged, domestic momentum should remain robust in 2019.
USD/JPY Forms Key Top Ahead Of US NFP
Key Highlights
- The US Dollar failed to break the 110.00 resistance and declined against the Japanese Yen.
- There is a major bearish trend line formed with resistance near 109.40 on the daily chart of USD/JPY.
- The US Initial Jobless Claims for the week ending Jan 26, 2019 increased from 200K to 253K.
- The US Nonfarm Payrolls figure for Jan 2019 will be released today, which could decline from 312K to 166K.
USDJPY Technical Analysis
The US Dollar struggled a lot this week and failed to break the 110.00 resistance against the Japanese Yen. As a result, the USD/JPY started a fresh decline and traded below the 109.20 support.
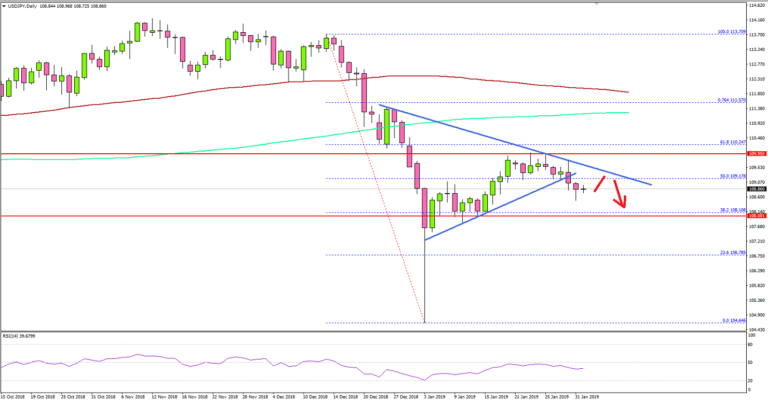
Looking at the daily chart, the pair recovered nicely from the 104.60 swing low (formed on 3rd Jan 2019). It broke the 108.00 resistance and the 50% Fib retracement level of the last crucial decline from the 113.70 high to 104.64 low.
However, the pair failed to break the 110.00 barrier and it even struggled to test the 61.8% Fib retracement level of the last crucial decline from the 113.70 high to 104.64 low.
As a result, the pair carved a crucial top and started a downward move below 109.50 and 109.00. It broke a connecting bullish trend line with support at 109.20 to move into a bearish zone. If sellers gain pace below the 108.10 support, there could be heavy losses in USD/JPY in the coming days.
On the upside, there is a major bearish trend line formed with resistance near 109.40 on the same chart. A daily close above the trend line followed by a break above 110.00 is must for an upside extension.
Fundamentally, the US Initial Jobless Claims figure for the week ending Jan 26, 2019 was released recently. The market was looking for an increase in claims from the last reading of 199K to 215K.
The actual result was lower than the forecast as the US Initial Jobless Claims increased to 253K and the last reading was revised up from 199K to 200K. The report stated:
The 4-week moving average was 220,250, an increase of 5,000 from the previous week’s revised average. The previous week’s average was revised up by 250 from 215,000 to 215,250.
Overall, the US Dollar is clearly under pressure and pairs like EUR/USD, GBP/USD and AUD/USD are gaining traction. Besides, crude oil price and gold price also gained bullish momentum in the past few days. However, all this could change with today’s nonfarm payrolls release. A better than forecast figure may perhaps help the greenback in the near term.
Economic Releases to Watch Today
- Germany’s Manufacturing PMI for Jan 2019 – Forecast 49.9, versus 49.9 previous.
- Euro Zone Manufacturing PMI Jan 2019 – Forecast 50.5, versus 50.5 previous.
- UK Manufacturing PMI for Jan 2019 – Forecast 53.5, versus 54.2 previous.
- US ISM Manufacturing Index for Jan 2019 – Forecast 54.2, versus 54.3 previous.
- US nonfarm payrolls Jan 2019 – Forecast 166K, versus 312K previous.
- US Unemployment Rate Jan 2019 – Forecast 3.9%, versus 3.9% previous.
Daily Markets Broadcast
Wall Street extends rally on trade hopes
While there was no concrete deal announced, the mood coming out of the two-day US-China was positive, with US President Trump announcing he will meet with China Xi “in the near future” to finalise details.
US30USD Weekly Chart
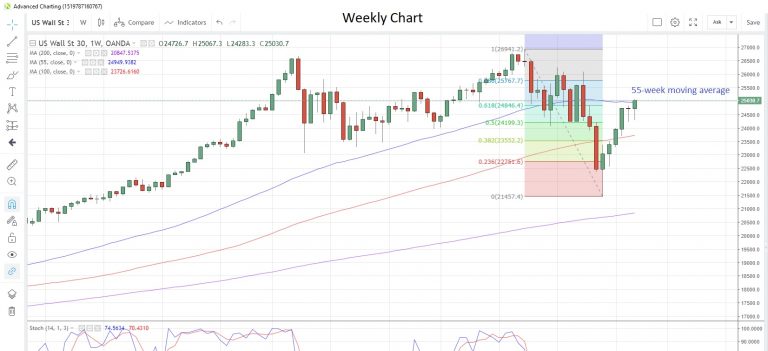
January saw the US30 index post the biggest monthly gain since Oanda records began in 2003. A dovish Fed and hopes for progress in the US-China trade talks continue to support
The index looks poised for a weekly close above the 55-week moving average at 24,950 for the first time since the week of November 26
The US payroll report is due today and an add of 165k jobs is expected, lower than December’s 312k. Unemployment is expected to hold at 3.9%. The ISM manufacturing PMI is also due, with forecasts of a dip to 54.2 in January from 54.3 the previous month.
DE30EUR Daily Chart
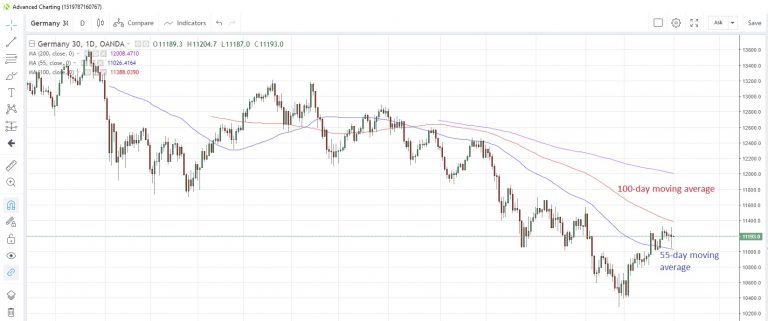
It was a volatile session for the Germany30 index yesterday before closing slightly in the red. Despite the weaker close, the index recorded its first monthly advance in six months in January
The index remains confined between 100-day moving average resistance at 11,388 and 55-day moving average support at 11,026
Euro-zone consumer prices are expected to rise 1.4% y/y in January, according to the forecasts for today’s preliminary reading. That’s a slower pace than December’s +1.6%.
XAUUSD Daily Chart
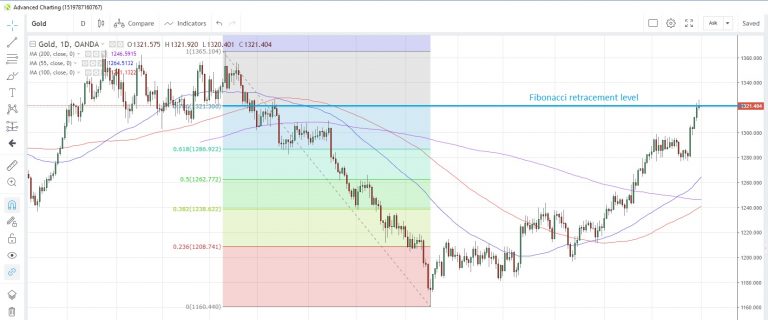
Gold advanced versus the US dollar for the fourth consecutive month in January, bringing total gains from the October low to more than 12%. The metal touched the highest since April 26 yesterday
Gold is straddling the 78.6% Fibonacci retracement level of the April to August drop at 1,321.30
Gold spent most of January attempting to break above the psychological 1,300 level, which eventually fell on January 25. The metal is looking to consolidate and extend this move amid a broadly bearish outlook for the US dollar.