Sample Category Title
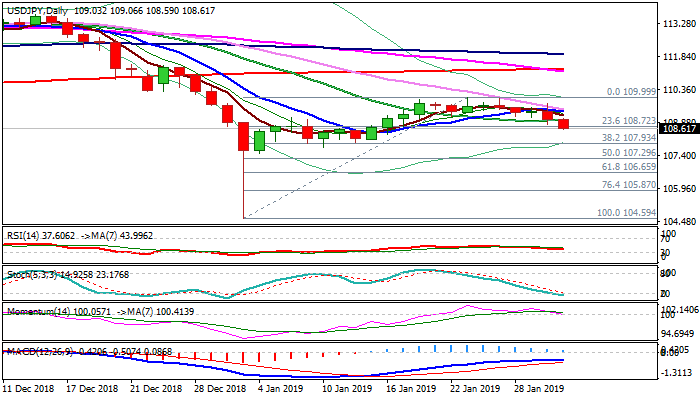
USD/JPY Outlook: Bears Eye Daily Kijun-Sen / Fibo Support At 108.00/107.93
The pair extends weakness after more dovish than expected Fed and eventually broke out of multi-day congestion.
Fresh bearish signal was generated on break below 20SMA (109.00) today, with further easing through 108.72 (Fibo 23.6% of 104.59/109.99 upleg) maintaining negative near-term outlook.
Daily MA’s are now in full bearish setup and south-heading momentum cracks the border of negative territory, adding to negative signals.
Bears could extend towards 108.00 (daily Kijun-sen) and 107.93 (Fibo 38.2% of 104.59/109.99), violation of which would generate strong bearish signal.
Caution on oversold slow stochastic which could slow bears.
Broken 20SMA marks solid resistance at 109.00, followed by converging 10/30 SMA’s (109.38/47), break above which is needed to neutralize bears.
Res: 109.00, 109.38, 109.47, 109.74
Sup: 108.00, 107.93, 107.76, 107.29
Elliott Wave Analysis: S&P500 Unfolding A Five-Wave Recovery
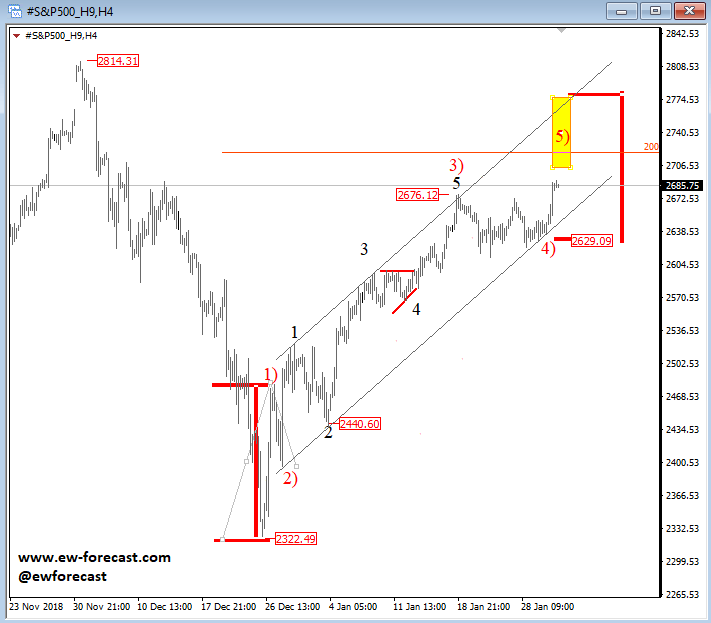
S&P500 is recovering in impulsive fashion, now unfolding final wave 5) as part of a bigger impulse. A possible top and resistance for current wave 5) can be found near the Fibonacci ratio of 200.0 and higher near the 2800 level, where also the upper Elliott wave channel line can react as a turning point.
A reversal in minimum three-waves can later be seen from the highs, below the 2630 level.
S&P500, 4h
The Analytical Overview Of The Main Currency Pairs
The EUR/USD currency pair
Technical indicators of the currency pair:
Prev Open: 1.14303
Open: 1.14782
% chg. over the last day: +0.47
Day's range: 1.14781 – 1.15141
52 wk range: 1.1214 – 1.2557
Yesterday USD was weakened against the other world currencies. The Federal Reserve, as expected, kept the key interest range at 2.25-2.50%. The regulator noted the they do not expect to increase the rate soon and will base their decision on the future economic reports. Right now the quotes are consolidating around 1.14750-1.15100. EUR has decent growth prospects. You should open positions from the key leveles.
The Economic News Feed for 31.01.2019:
Labour Market Report (GER) – 10:55 (GMT+2:00);
GDP Report (EU) – 12:00 (GMT+2:00);
Primary Retail Sales (US) – 17:00 (GMT+2:00).
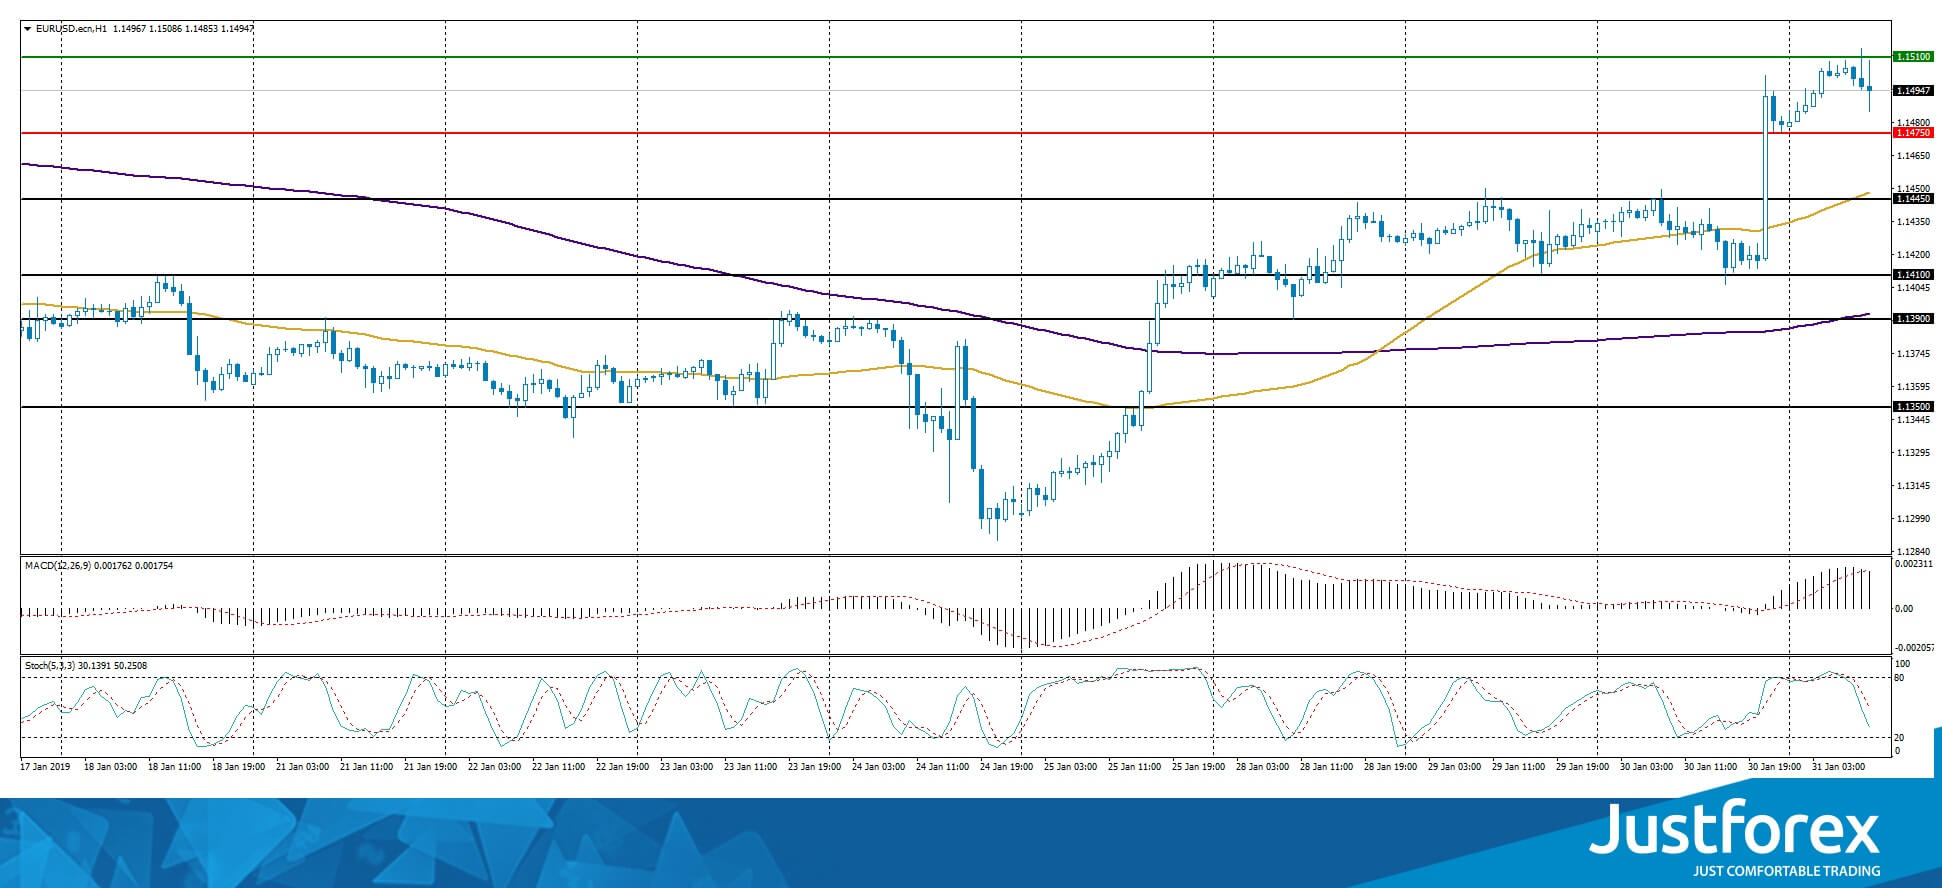
The price fixed above 50 MA and 200 MA which points to the power of the buyers.
The MACD histogram is in the positive zone but below the signal line which gives a weak signal to buy EUR/USD.
The Stochastic Oscillator is in the neutral zone, the %K line is below the %D line which points to the corrective movement of the EUR/USD quotes.
Trading recommendations
Support levels: 1.14750, 1.14450, 1.14100
Resistance levels: 1.15100, 1.15500
If the price fixes above1.15100 expect the quotes can grow toward 1.15500-1.15700.
Alternatively the quotes can correct toward 1.14500-1.14300.
The GBP/USD currency pair
Technical indicators of the currency pair:
Prev Open: 1.30638
Open: 1.31067
% chg. over the last day: +0.36
Day's range: 1.30983 – 1.31562
52 wk range: 1.30983 – 1.31562
GBP/USD keeps consolidating. There is no single defined trend. The investors are waiting for the new data regarding the Brexit process. USD remains under pressure after the Federal Reserve meeting. The local support and resistance levels are 1.30900 and 1.31350. You should open positions from these levels.
The Economic News Feed for 31.01.2019 is calm.
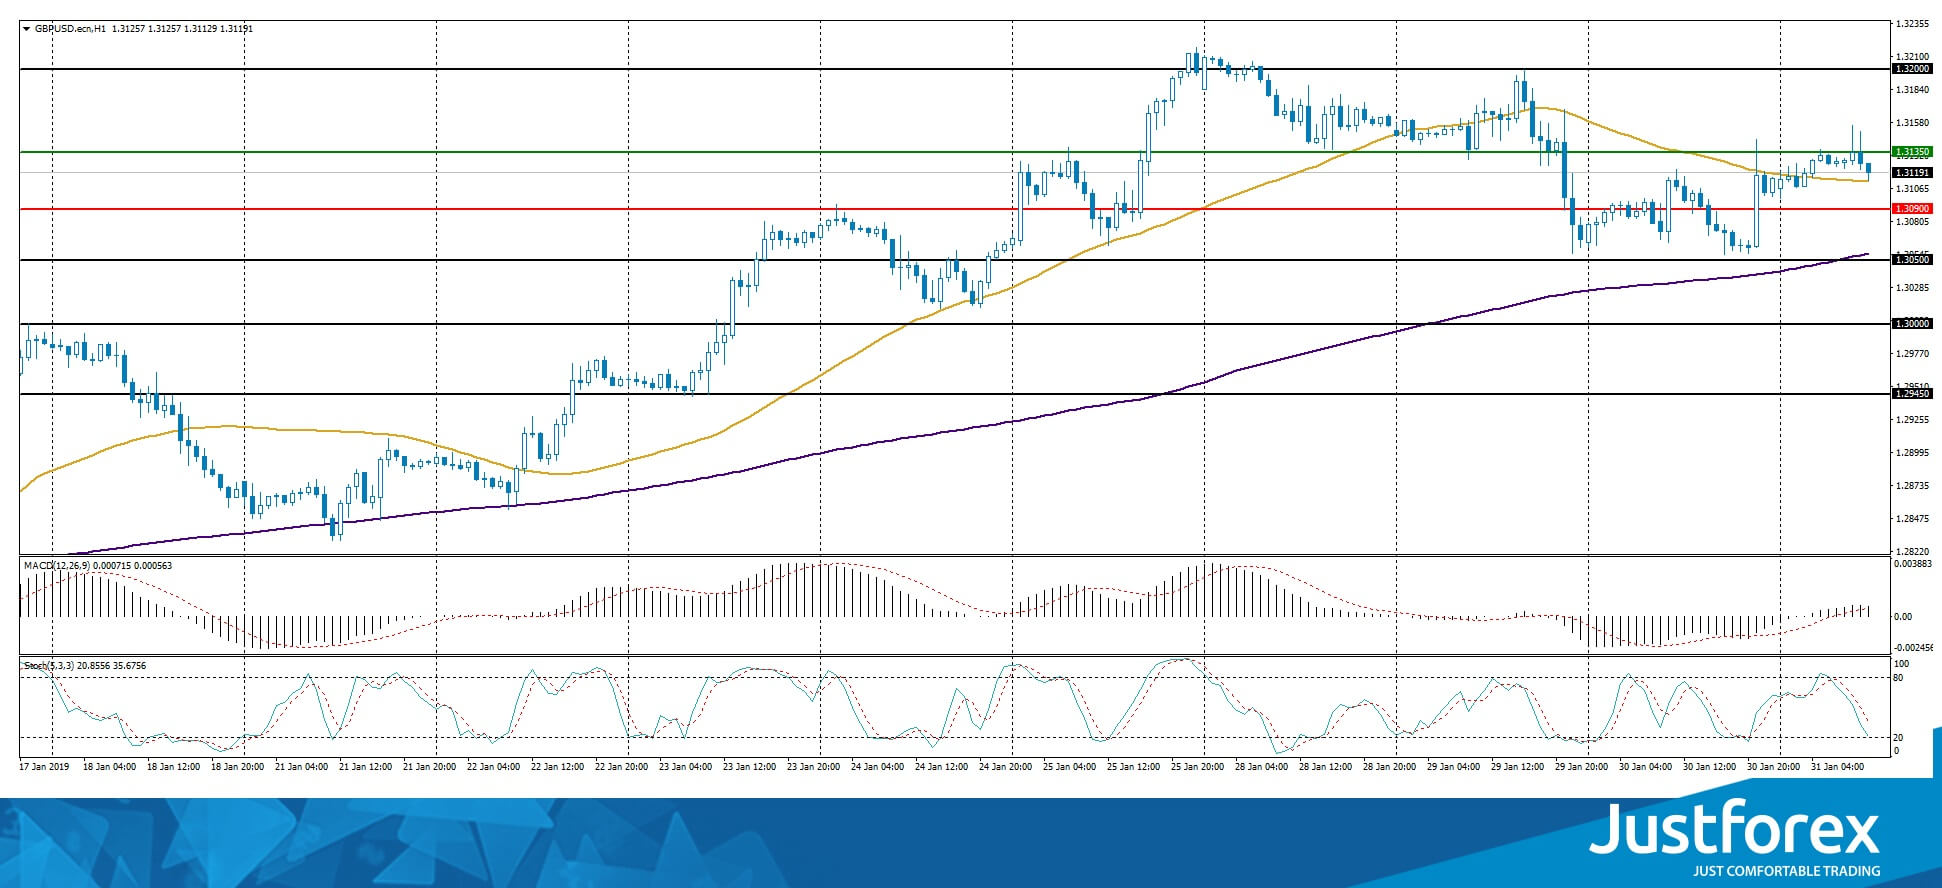
The indicators do not provide precise signals, the price has crossed 50 MA.
The MACD histogram is in the positive zone and keeps rising, which gives a strong signal to buy GBP/USD.
The Stochastic Oscillator is in the neutral zone, the %K line is below the %D line which points to a bearish mood.
Trading recommendations
Support levels: 1.30900, 1.30500, 1.30000
Resistance levels: 1.31350, 1.32000
If the price fixes below 1.3000 consider looking for the market entry points to open short positions. The movement will tend to 1.30500-1.30200.
Alternatively, the quotes can grow toward 1.31750-1.32200.
The USD/CAD currency pair
Technical indicators of the currency pair:
Prev Open: 1.32669
Open: 1.31473
% chg. over the last day: -0.96
Day's range: 1.31203 – 1.31527
52 wk range: 1.2248 – 1.3664
USD/CAD began to descend again after aggressive sell-offs yesterday. The CAD is strengthened against the USD by more than 100 points and is consolidating around 1.31200-1.31550. It is additionally upported by the positive oil quotes dynamics. The trading instrument has a tendency to descend. We are waiting for important economic reports.
The Economic News Feed for 31.01.2019:
GDP Report (CAD) – 15:30 (GMT+2:00);
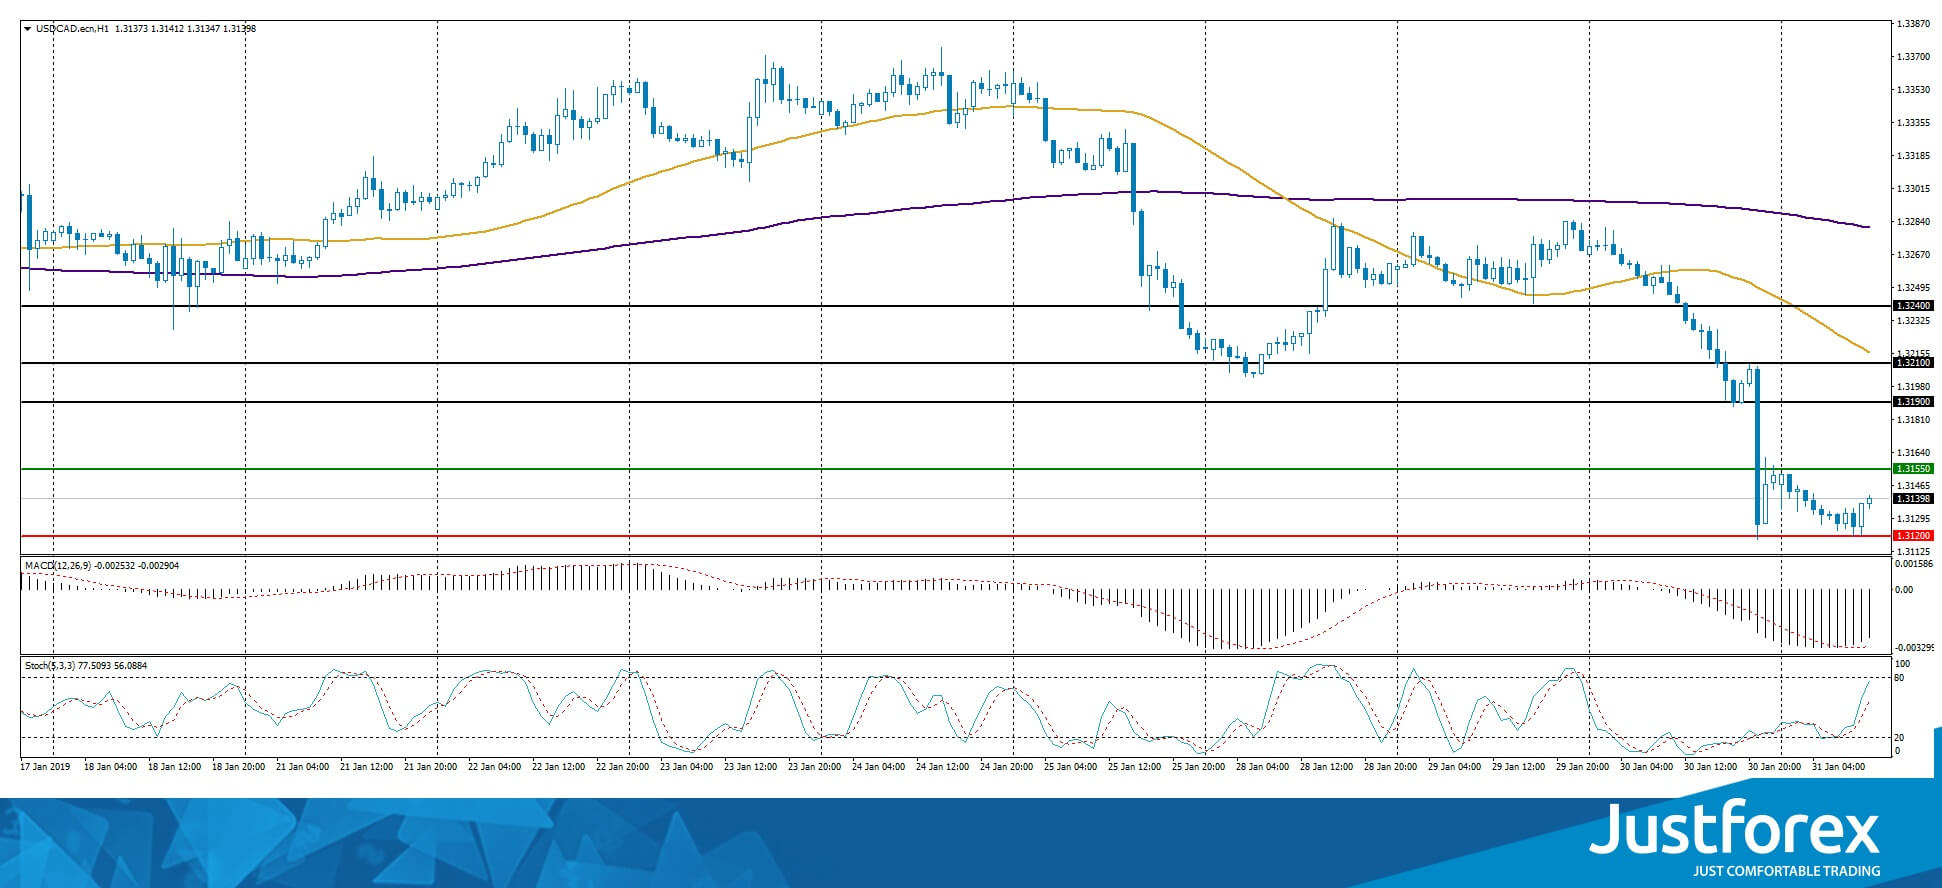
The price fixed below 50 MA and 200 MA which points to the power of the sellers.
The MACD histogram is in the negative zone but above the signal line which gives a weak signal to sell USD/CAD.
The Stochastic Oscillator is in the neutral zone, the %K line is above the %D line which points towards a corrective movement.
Trading recommendations
Support levels: 1.31200, 1.30750
Resistance levels: 1.31550, 1.31900, 1.32100
If the price fixes below 1.31200 expect the quotes to descend toward 1.30700-1.30500.
Alternatively the quotes can recover toward 1.31800-1.32000.
The USD/JPY currency pair
Technical indicators of the currency pair:
Prev Open: 109.254
Open: 109.035
% chg. over the last day: -0.38
Day's range: 108.591 – 109.066
52 wk range: 104.56 – 114.56
USD/JPY is showing an aggressive sell-off and updating the local minimums. The demand for the USD is significantly weakened after the Federal Reserve meeting and decision not to increase the insterest rates. The quotes are testing the local support at 108.600 and resistance at 108.900. USD/JPY has prospects to descend lower.
The Economic News Feed for 31.01.2019 is calm.
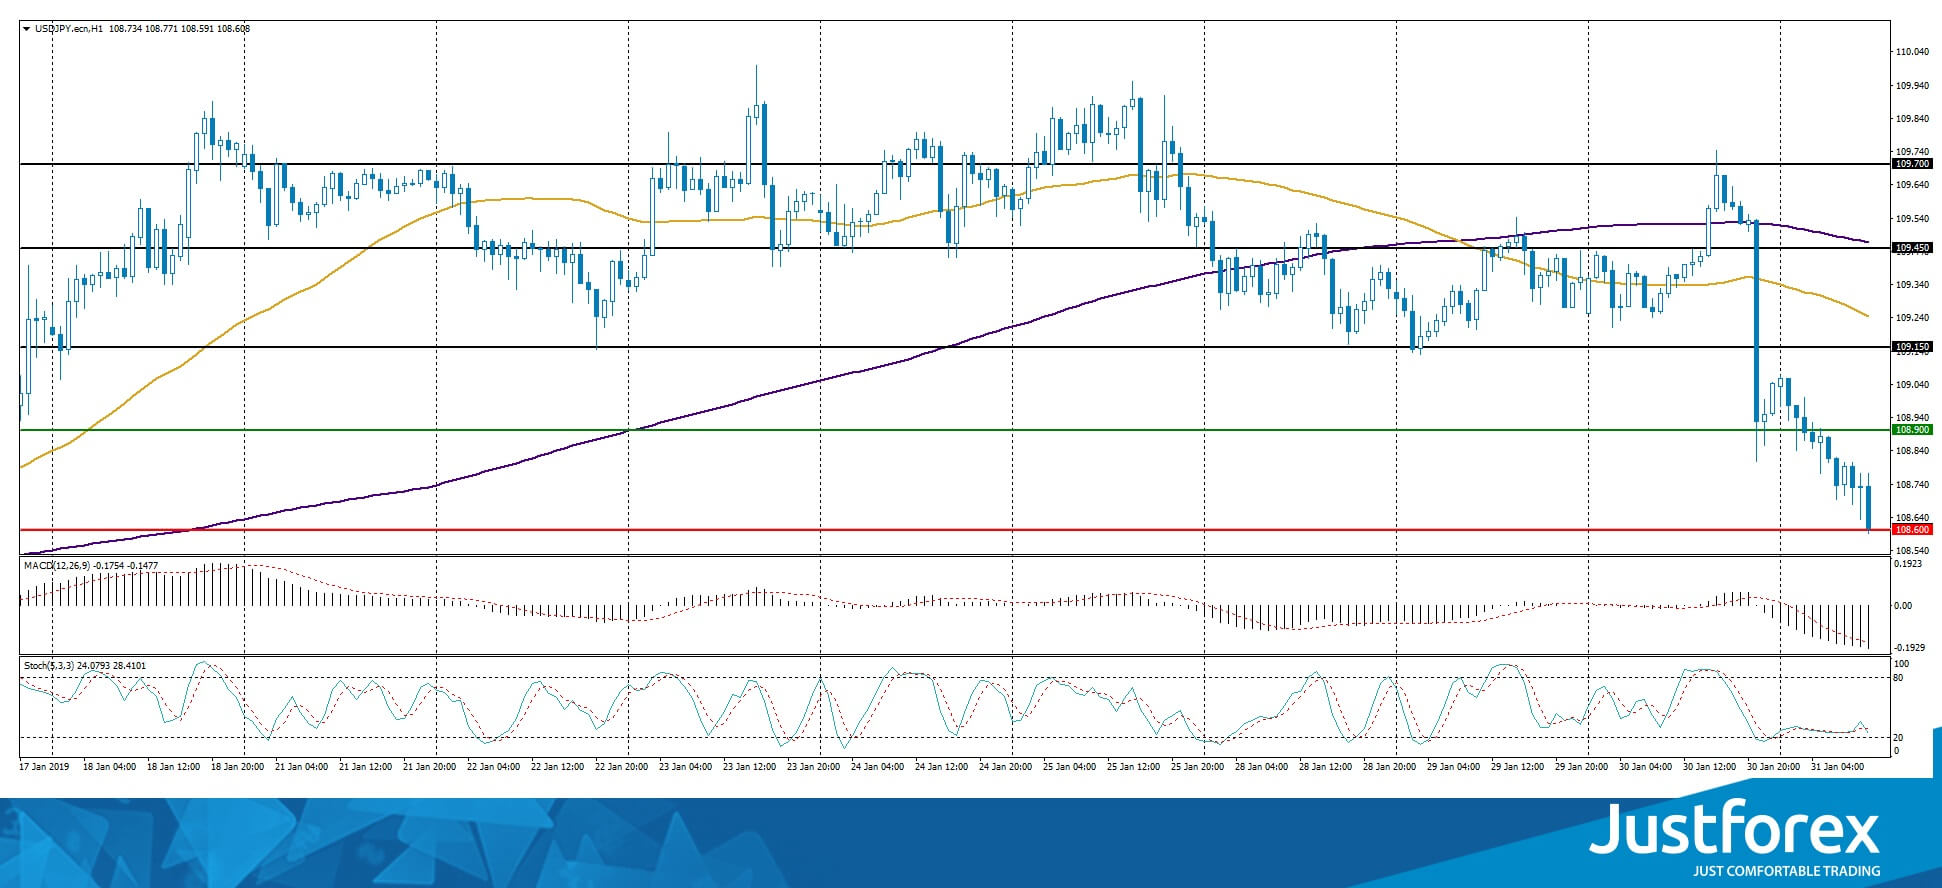
The indicators point to the power of the sellers, the price has fixed below 50 MA and 200 MA.
The MACD histogram is in the negative zone and below the signal line which gives a strong signal to sell USD/JPY.
The Stochastic Oscillator is in the neutral zone, the %K line is crossing the %D line. There are no signals at the moment.
Trading recommendations
Support levels: 108.600, 108.300, 108.000
Resistance levels: 108.900, 109.150, 109.450
If the price fixes below 108.600 the quotes can fall futher toward 108.300-108.000.
Alternatively the quotes can recover toward 109.000-109.150.
FOMC Remains Dovishly On Hold And The USD Tumbles
The FOMC remained on hold at +2.5% as was widely expected and maintained a clear dovish tone in the accompanying statement. The highlights of the accompanying statement included a alteration from previously intended “gradual rate hikes” towards being “patient” on future moves. On the flip side the bank stated that it will continue to unwind its balance sheet program. In the following press conference, Fed Chair Jerome Powell acknowledged the growing risks in the global economy as China and Europe's growth slows down. Also the Fed Chair noted the effect of the US government shutdown and implied a weakening US outlook. The USD weakened on the release and throughout the Asian session and the implications of the Fed switching to a more neutral stance regarding rate hikes could imply a more bearish outlook for the greenback. EUR/USD rallied yesterday breaking consecutively all of our resistance lines, landing just above the 1.1495 (S1) resistance line (now turned to support). We could see the pair weakening today as a number of financial releases could weaken the common currency. Should the pair come under the selling interest of the market, we could see the pair breaking the 1.1495 (S1) support line and aim for the 1.1460 (S2) support level. Should on the other hand the pair find fresh buying orders along its path, we could see it breaking the 1.1525 (R1) resistance line.
GBP stabilizes, as UK seeks new Brexit deal
GBP corrected somewhat higher yesterday after the initial shock of UK parliament's vote and stabilised. Analysts point out that investors may still expect that the UK government would be able to avoid a hard Brexit. Never the less, the EU's negative stance to any change in the Irish backstop in contrast to Theresa May's goals. On other news the renewed uncertainty has also caused the market to reduce expectations of a possible rate hike by the BoE in 2019. We see the case for the pound to remain under pressure as Brexit clouds the UK outlook. Cable maintained a rather sideways movement yesterday testing the 1.3070 (S1) support line and getting a lift from FOMC's interest rate decision yesterday. We could see the pair remaining under pressure in the next two days, however please note that the pair could prove sensitive to any Brexit headlines as well as any financial releases (for example UK's manufacturing PMI for January or the US employment report for January). Should the bulls dictate the pair's direction, we could see cable breaking the 1.3175 (R1) resistance line and aim for the 1.3280 (R2) resistance level. Should the bears take over, we could see the pair breaking the 1.3070 (S1) support line and aim for the 1.2960 (S2) support barrier.
Today's other economic highlights
In today's European session, we get from Germany the retail sales growth rate for December and the unemployment data for January, from France the preliminary CPI (EU Normalised) for January and from Eurozone the preliminary GDP for Q4 and unemployment rate for January. In the American session, we get the US Core PCE price index growth rate and the personal consumption growth rate, both for December, while from Canada, we get the GDP growth rate for November. As for speakers, ECB's Yves Mersch and Benoit Coeure as well as Germany's BuBa president Jens Weidmann speak.
GBP/USD H4
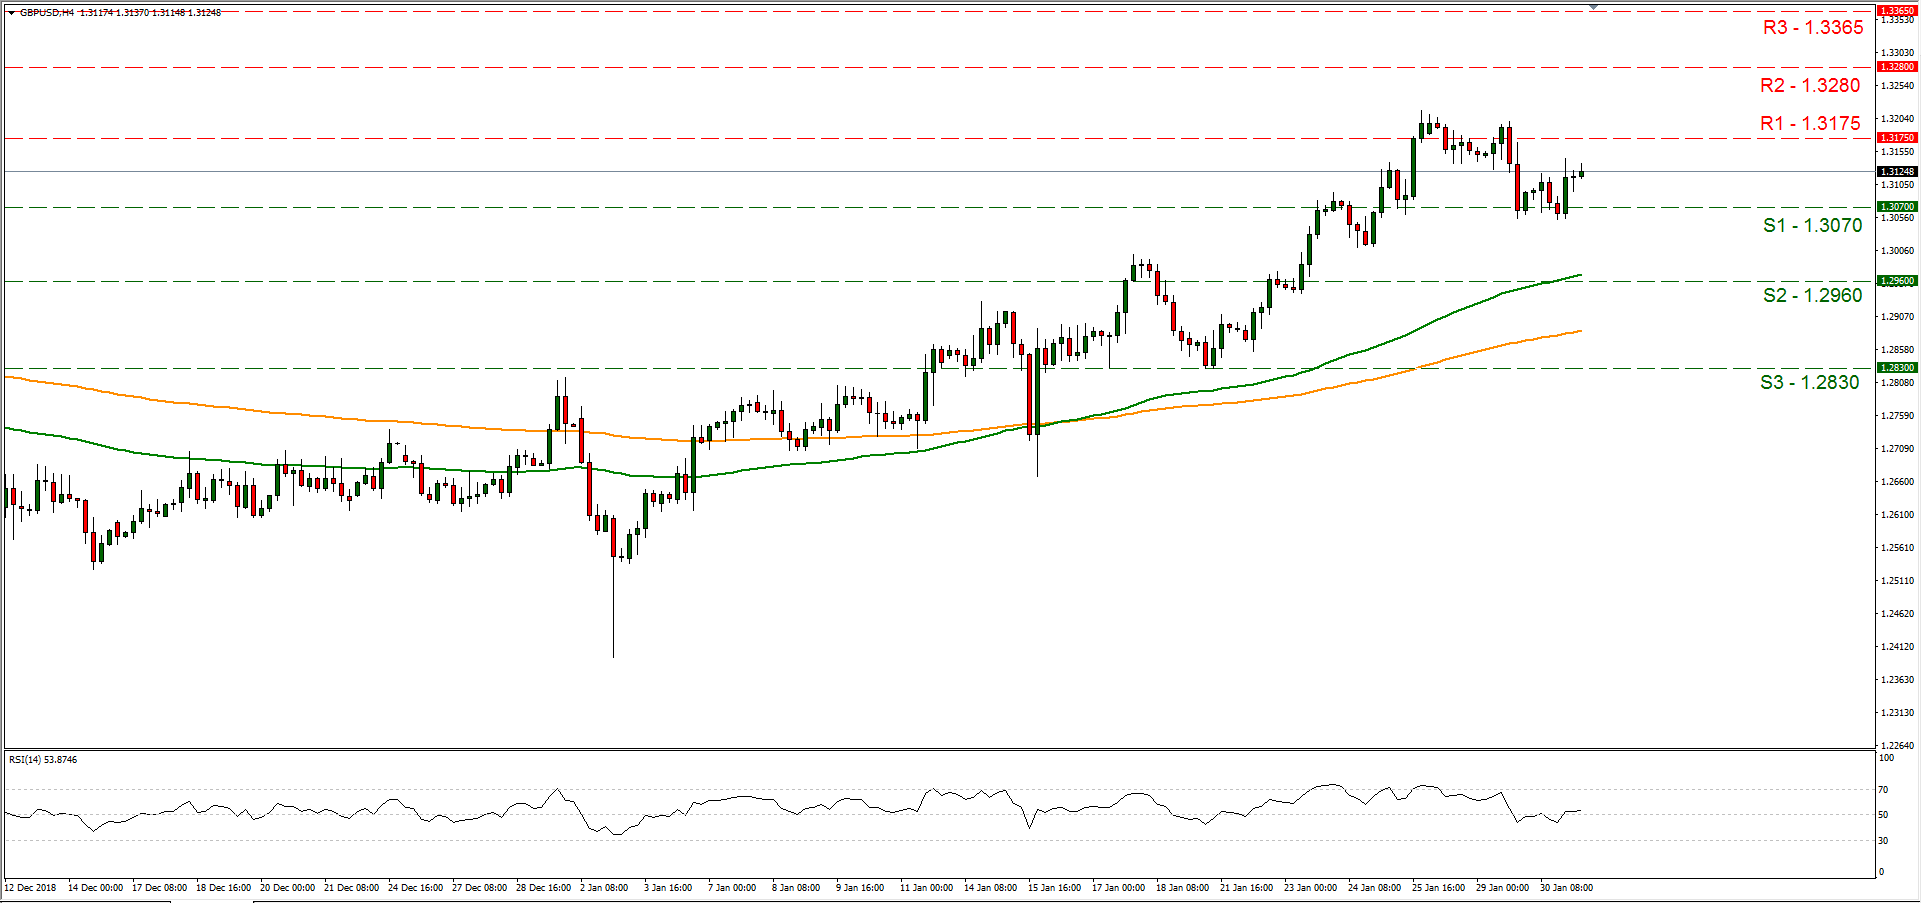
Support: 1.3070 (S1), 1.2960 (S2), 1.2830 (S3)
Resistance: 1.3175 (R1), 1.3280 (R2), 1.3365 (R3)
EUR/USD H4
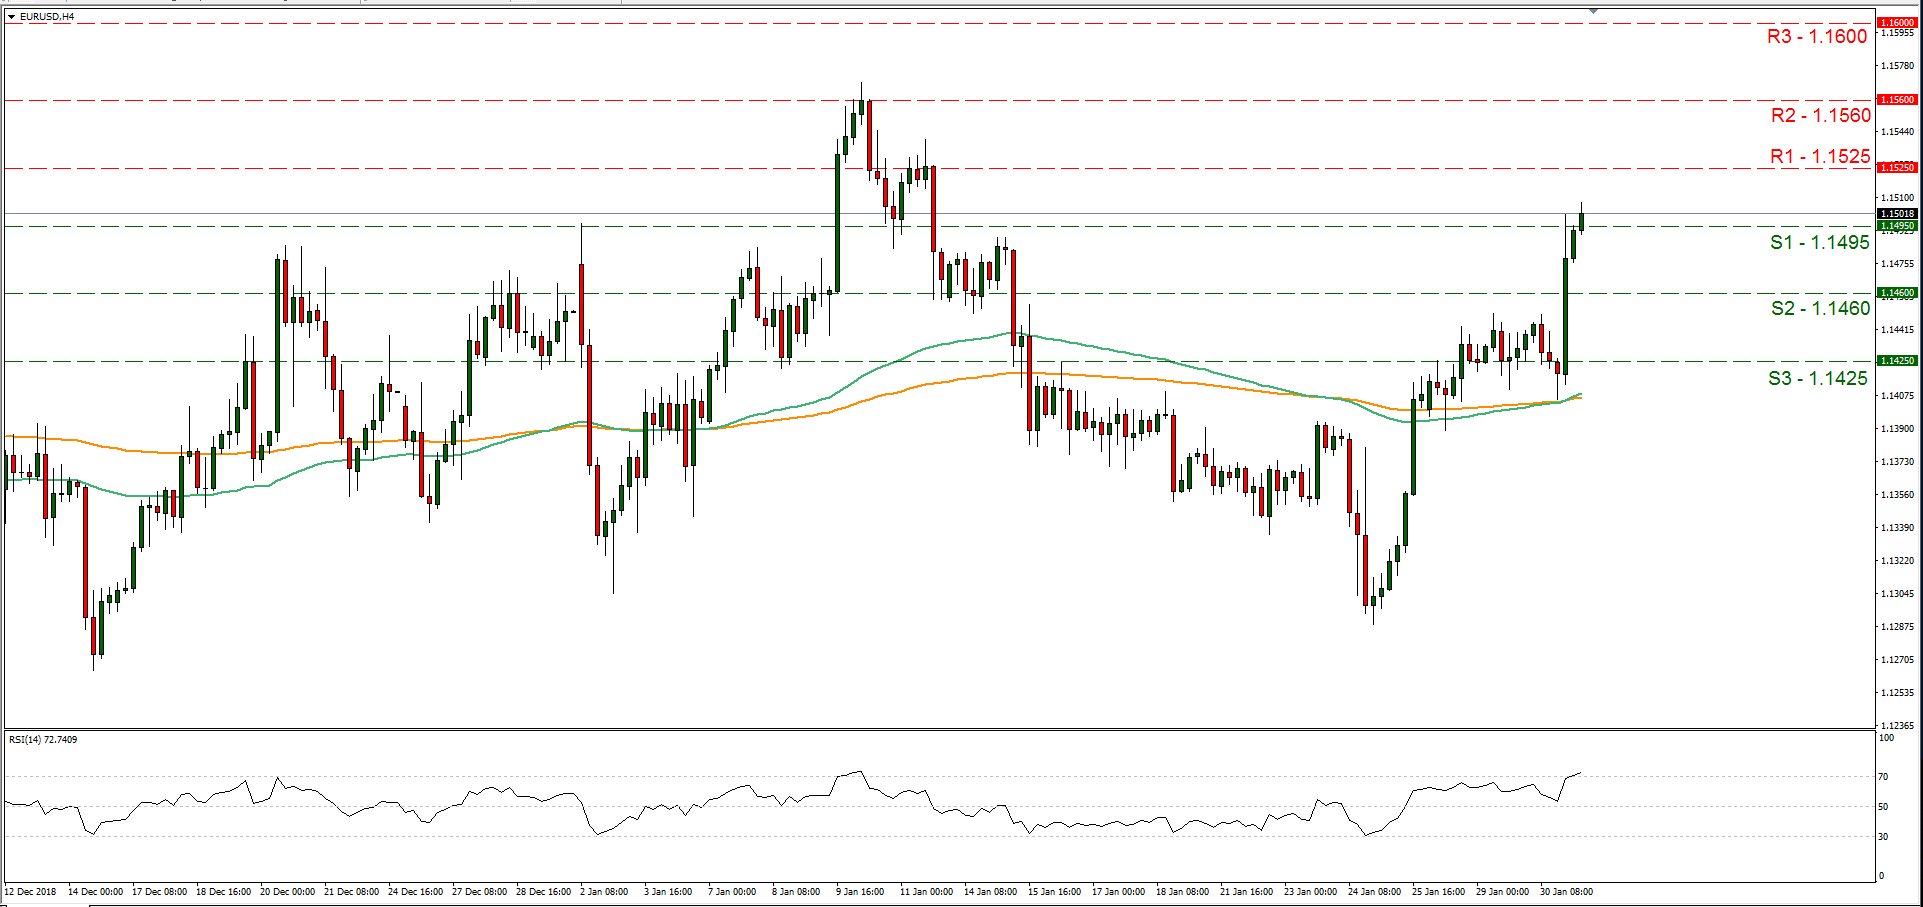
Support: 1.1495 (S1), 1.1460 (S2), 1.1425 (S3)
Resistance: 1.1525 (R1), 1.1560 (R2), 1.1600 (R3)
Dollar Is Declining After The Fed Meeting
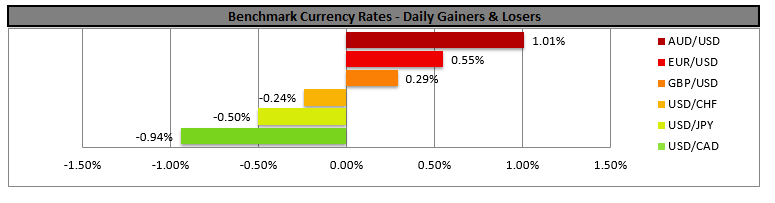
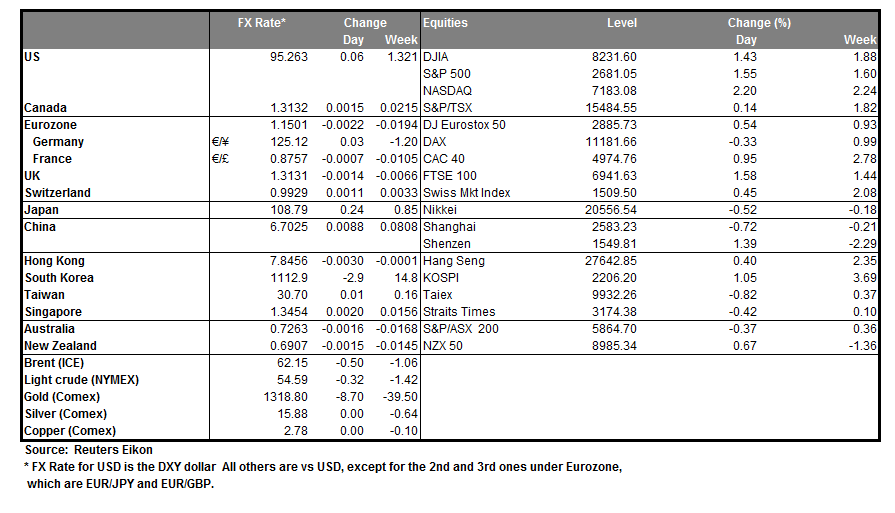
The US dollar weakened against a basket of major currencies after the Fed meeting. The US Federal Reserve kept the key interest rate range at 2.25-2.50% and said it would be patient with its possible increase this year. Fed Chairman, Jerome Powell, also confirmed signals that the regulator would take into account future economic reports and would not rush into a further tightening of monetary policy. The US dollar index (#DX) closed in the negative zone (-0.51%).
Also yesterday, ambiguous statistics from the US were published. Thus, the ADP nonfarm employment change increased to 213K in January, while experts expected 180K. However, data for January were revised downward from 271K to 263K. The pending home sales index declined by 2.2% in December, while investors expected an increase of 0.8%.
The bullish sentiment is prevailing in the "black gold" market. At the moment, futures for the WTI crude oil are testing the mark of $54.50 per barrel. Positive data on economic activity in the manufacturing sector in China also support oil quotes.
Market Indicators
- Yesterday, the aggressive purchases were observed in the US stock market: #SPY (+1.58%), #DIA (+1.82%), #QQQ (+2.54%).
- The 10-year US government bonds yield fell significantly. Currently, the indicator is at the level of 2.67-2.68%.
Economic Data on 31.01.2019:
- Statistics on the German labor market at 10:55 (GMT+2:00);
- Eurozone GDP data at 12:00 (GMT+2:00);
- Report on Canada GDP at 15:30 (GMT+2:00);
- New home sales in the US at 17:00 (GMT+2:00).
NZDUSD Reaches 8-Week High Near Upper Boundary Of Bullish Channel
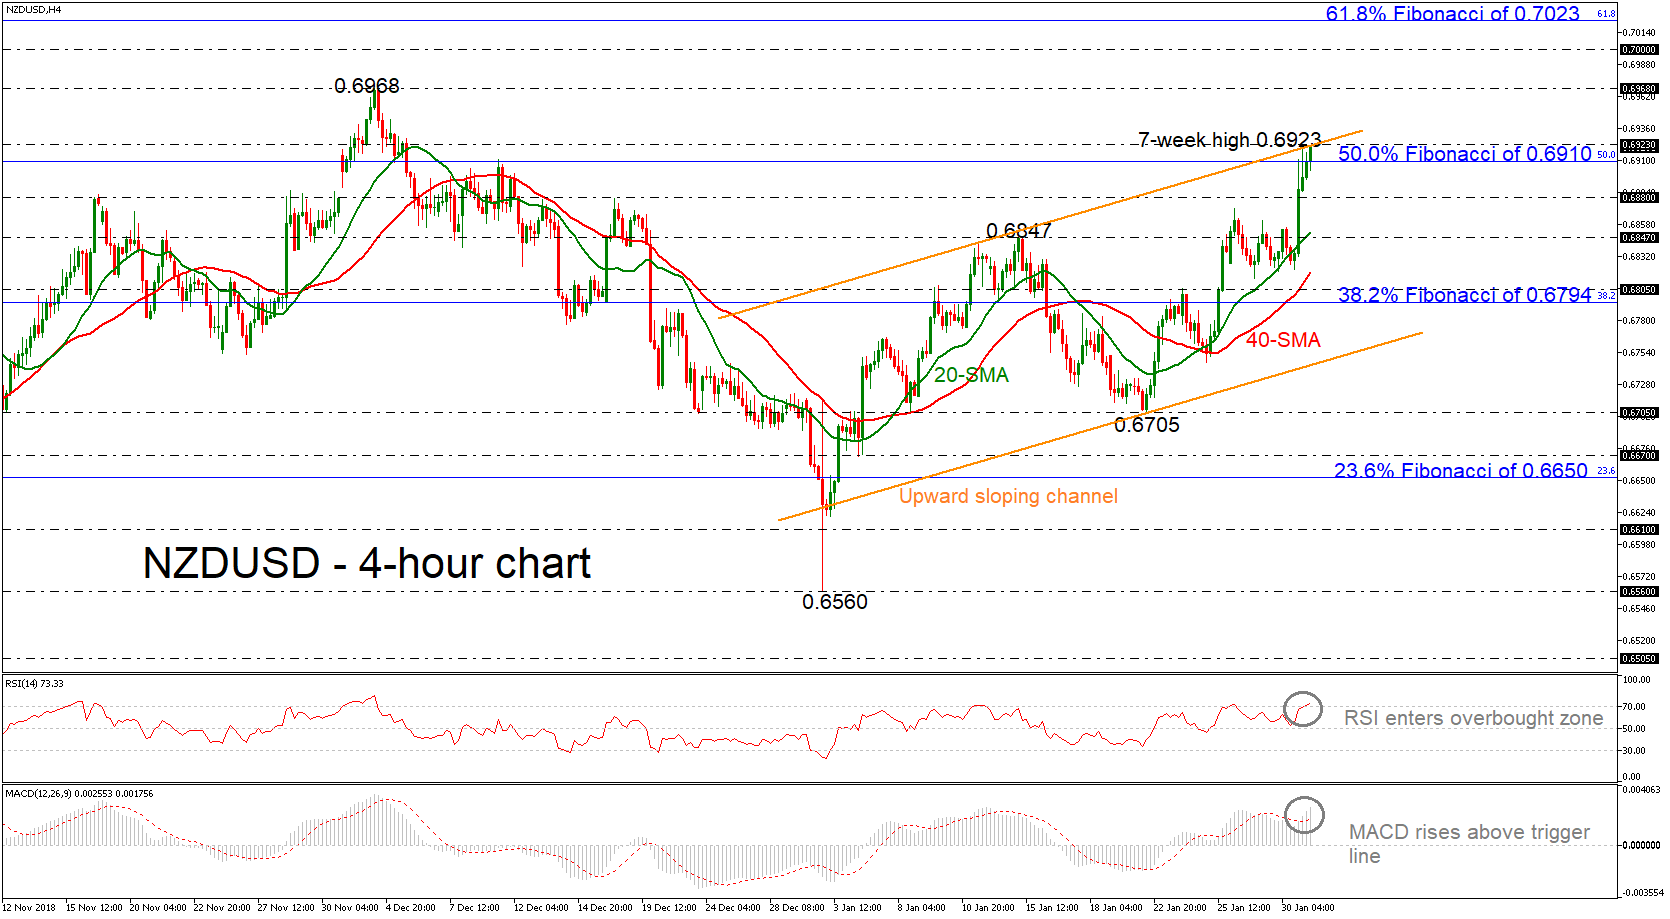
NZDUSD continues to rise above the 50.0% Fibonacci retracement level of the downward movement from 0.7390 to 0.6423, around 0.6910, remaining inside a bullishly aligned channel, stretching its upward pattern to a fresh seven-week high of 0.6923.
According to the MACD, positive momentum could push for further gains in the short-term as the indicator picks up steam above its red signal line. The RSI is also advancing, though, it is slightly above the 70 overbought threshold, therefore, negative corrections cannot be excluded.
In case the pair extends its gains above the aforementioned new high, resistance could be faced around the 0.6968 hurdle, identified by the peak on December 4. A break higher could see prices flirting with the significant psychological level of 0.7000 before touching the 61.8% Fibonacci mark of 0.7023.
In case the price changes its near-term direction to the downside, the bears will probably challenge the 0.6880 support, if there is a drop below the 50.0% Fibonacci of 0.6910. Additional declined may drive the market towards the 20-simple moving average (SMA) in the 4-hour chart, which stands around the 0.6847 support.
Overall, NZDUSD has been holding within an upward sloping channel since January 3 and any increases above the 61.8% Fibonacci would confirm the positive outlook in the medium-term as well.
EURJPY Steadily Rises To 1-Month High, Neutral In Short-Term
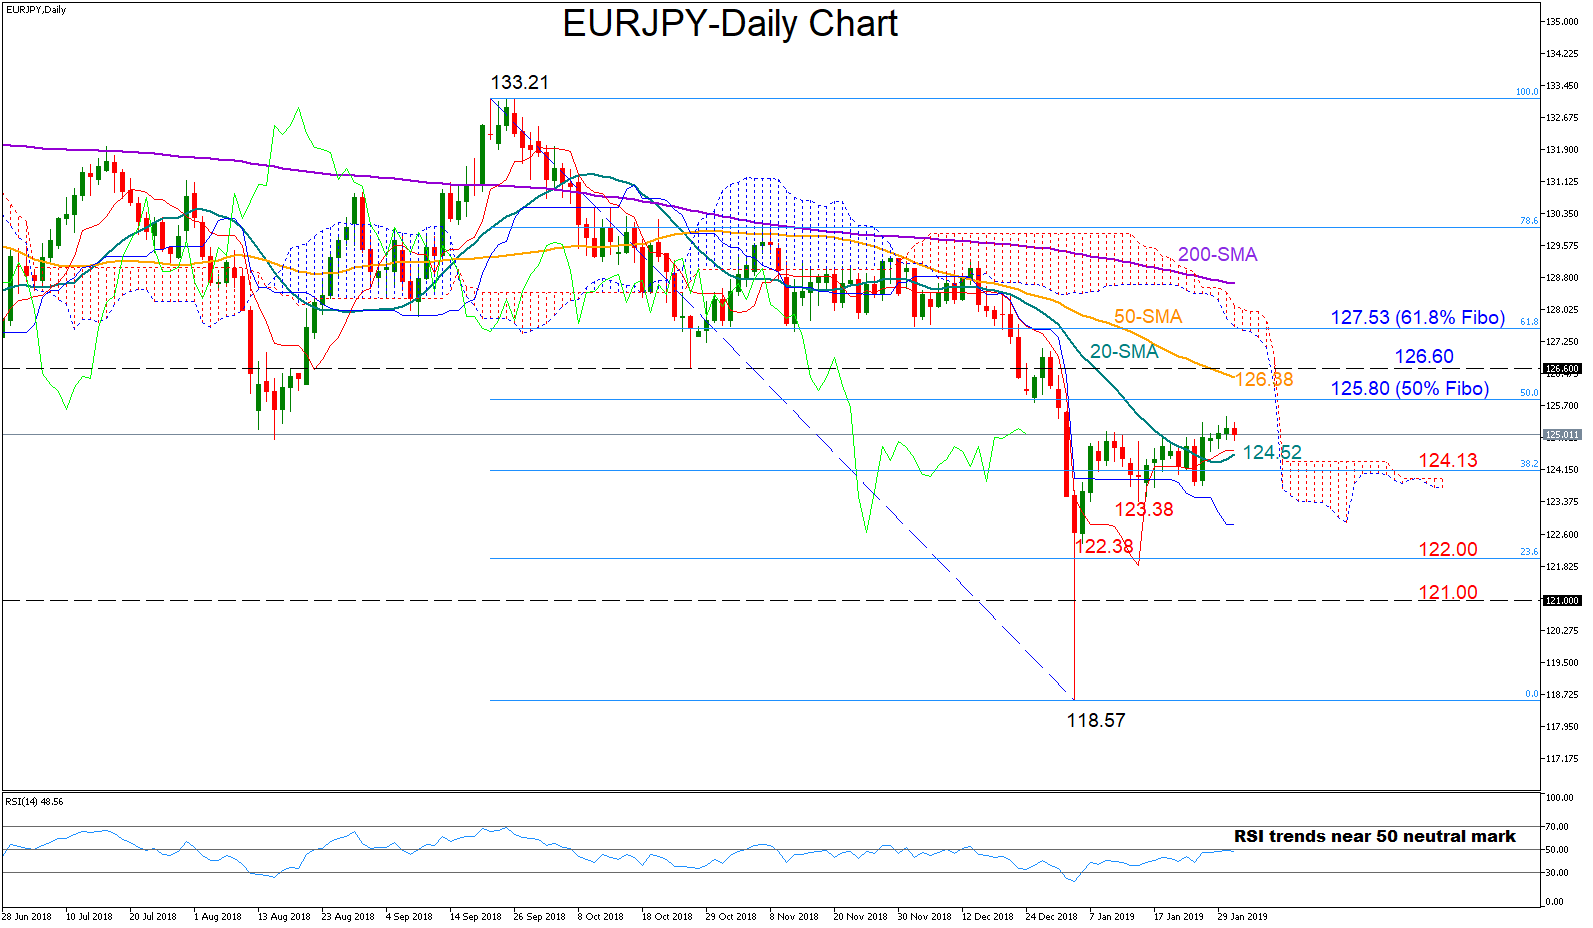
EURJPY has been steadily rising this week to reach a one-month high of 125.45 on Wednesday, but the RSI has yet to show strong momentum above its 50 neutral mark for the market to pick up steam. The Ichimoku indicators back this view as well since the red Tenkan-sen and the blue Kijun-sen lines appear to be flattening. Yet, with the 20-day moving average (MA) changing direction northwards, the pair may keep trending higher.
In case the pair corrects to the upside, nearby resistance could be found around 125.80, which is the 50% Fibonacci retracement of the downleg from 133.21 to 118.57. Slightly higher, the area between 126.38 (50-day MA) and 126.61 should attract some attention since the price has rested within these barriers in the past. Steeper increases may also face a wall around the 61.8% Fibonacci of 127.53, which the bears were unable to break in November.
Moving down and below the 20-day MA currently at 124.52, the region encapsulated by the 38.2% Fibonacci of 124.13 and the previous low of 123.38 could halt bearish actions, while lower down, the 122.38 trough registered on January 4 and the 23.6% Fibonacci of 122 could gather some interest before the focus shifts to the 121 psychological level.
Turning to the medium-term picture, EUJPY maintains a bearish profile after a close below the 126 handle. Unless the 50-day MA corrects its bearish cross with the 200-day MA, a bull market is seen a long distance away.
GBP/USD Outlook: Positive Outlook Above 200SMA But Weakening Daily Studies Warn
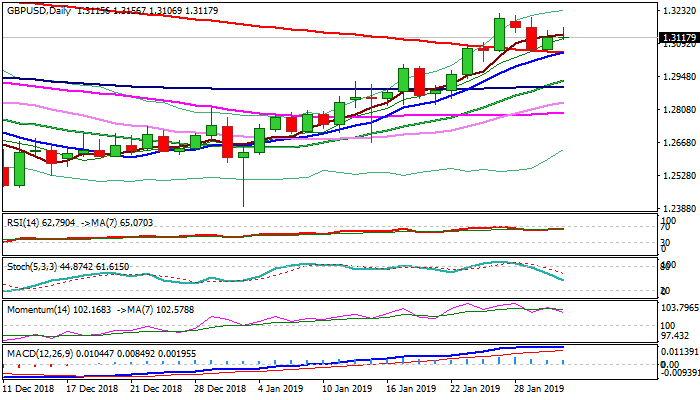
Cable extends bounce from 200SMA which contained corrective dip, with weaker greenback after dovish stance from Fed, adding to positive near-term tone.
However, risk of recovery stall exists as momentum is weakening on daily chart and slow stochastic heads south.
Scenario of extended consolidation while 200SMA (reinforced by rising 10SMA) holds could be considered, as bulls lack momentum for now, but near-term structure would weaken on renewed attack at 200SMA and sustained break lower that would signal deeper pullback.
Conversely, close above 1.3153 (Fibo 38.2% of 1.4376/1.2397) would generate initial bullish signal for fresh attack at pivotal 1.3200 resistance zone.
Further bullish signal could be also expected on repeated weekly close above 100WMA (1.3177).
Res: 1.3156, 1.3177, 1.3199, 1.3217
Sup: 1.3106, 1.3053, 1.3023, 1.3000
AUD/JPY 4H Chart: Tested Support Cluster At 78.19
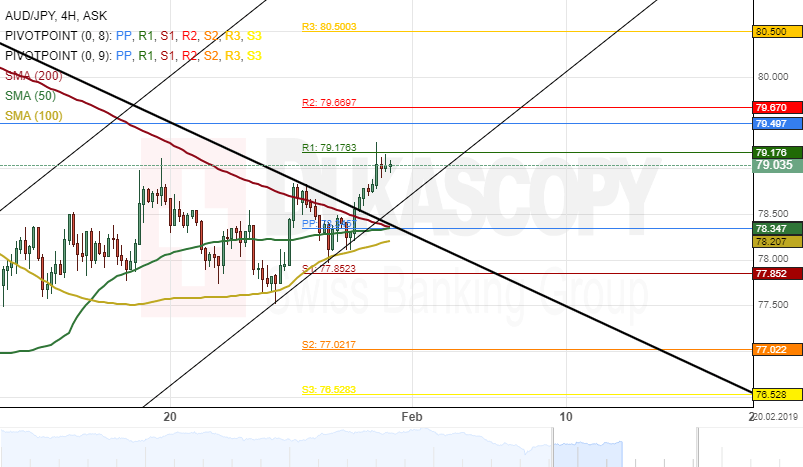
The Australian Dollar has continued to trade in a junior ascending channel pattern against the Japanese Yen. Meanwhile, the 50– and 100-hour SMAs has helped the currency pair to breached the upper boundary of a dominant descending channel.
It is likely that the exchange rate will continue moving higher during the following trading sessions. The potential upside target for the currency exchange rate will be near the weekly R3 at 80.50.
However, technical indicators on the weekly time-frame chart demonstrate that there could be a fall in price within the coming days.
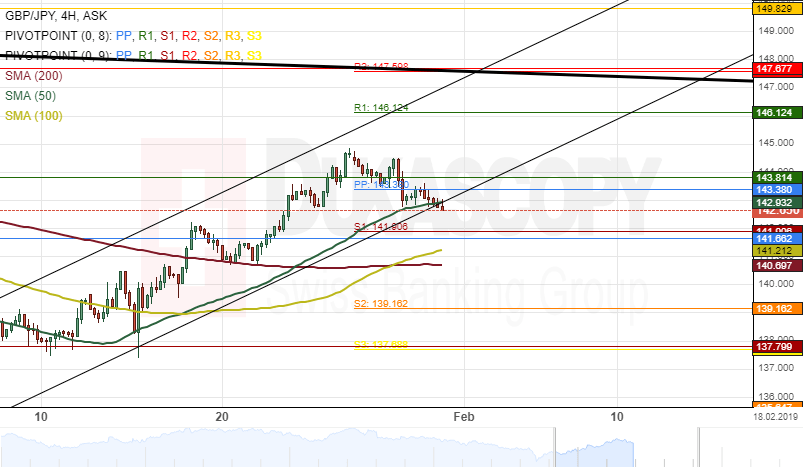
GBP/JPY 4H Chart: Testing 50-Hour SMA
A narrow ascending channel pattern has been guiding the British Pound against the Japanese Yen. The exchange rate reached a three-month high at 144.77 a few days ago.
The currency pair breached the lower boundary of the ascending channel pattern at 143.38 during the early hours of Thursday's trading session.
Bears could push the currency exchange rate towards a support cluster formed by the combination of the 100– and 200-hour SMAs at 140.70 during the following trading session.
Although, the GBP/JPY pair could reverse from the 50-hour SMA at 142.89 and continues its upside movement.