Sample Category Title
GBPUSD Indicators Correcting Higher
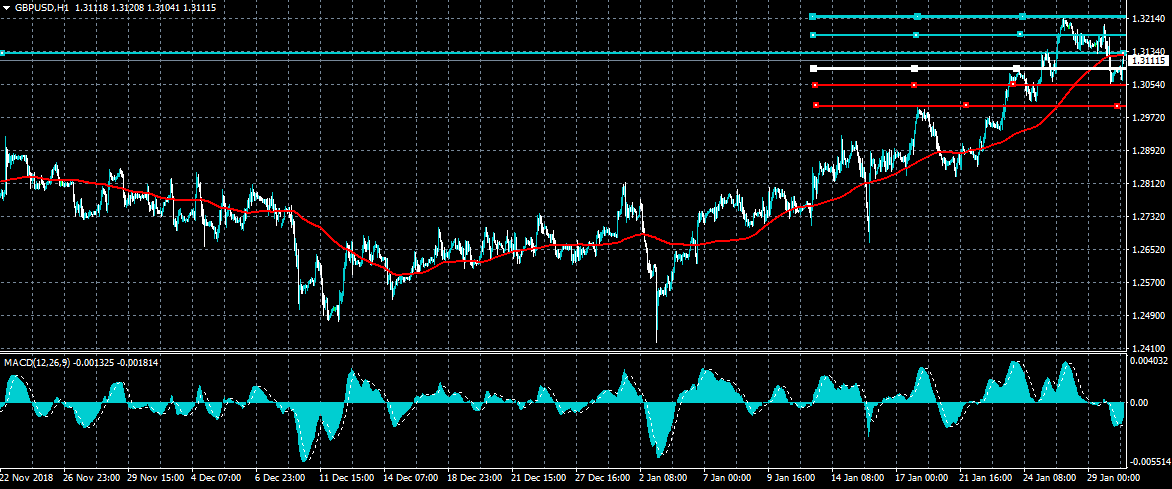
The British pound has corrected higher against the US dollar during the European trading session, after finding strong technical support from the 1.3055 level. Short-term technical indicators are also moving higher, with the GBPUSD pair trading back above the pivotal 1.3090 level. Traders should watch for a sustained break of the 1.3090 to 1.3130 price range, as it will likely prompt the next directional move in the pair.
The GBPUSD pair is bullish while trading above the 1.3130 level, key technical resistance is found at the 1.3200 and 1.3255 levels
If the GBPUSD pair trades below the 1.3090 level, key support is found at the 1.3055 and 1.3000 levels.
USDJPY At Critical Juncture
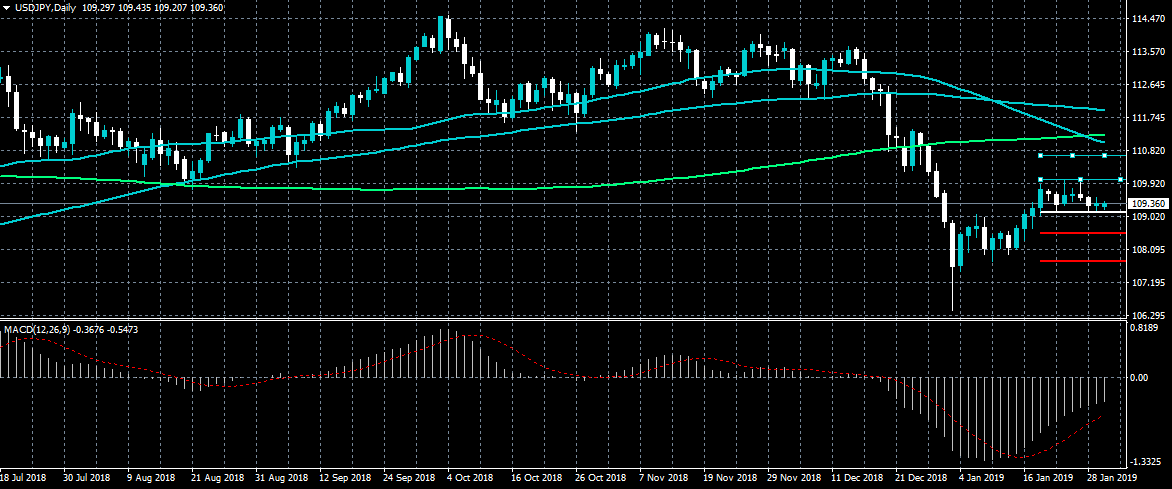
The US dollar is consolidating losses against the Japanese yen currency, ahead of the key interest rate decision and monetary policy statement from the FOCM later today. The USDJPY pair is currently at a crossroads after staging a strong technical recovery from the 106.00 level earlier this month. A break below the 109.14 level exposes further losses towards the 108.10 level, while a move above the 110.00 level may provoke buying towards the 110.80 resistance area.
The USDJPY pair is only bearish while trading below the 109.14 level, key technical support is found at the 108.58 and 107.80 levels.
If the USDJPY pair moves above the 109.60 level, buyers may test towards the 110.00 and 110.80 resistance levels.
Brexit Update : Less Clarity, More Confusion after Another Vote
The UK Parliament voted on the amendments of the PM Theresa May’s Brexit deal, which they have rejected two weeks ago. Among the seven amendments selected by John Bercow, Speaker of the House of Commons, for debate and vote, the so-called Copper plan and Brady plan caught most attention. Defeat of the former and passage of the latter has caused rather rigorous fluctuation in the pound.
The so-called Cooper amendment was proposed by Labor Party’s MP Yvette Copper. Trying to extend the official Brexit deadline to December 31, from the current March 29, the bill sought to rule out a no-deal Brexit by giving the government more time to reach a formal agreement with the EU. It was defeated by a vote of 321 to 298. Rejection of the bill signals that a no-deal Brexit is not ruled out.
On the other hand, Conservative MP Graham Brady proposed to replace the Irish backstop solution by “alternative arrangement”. This was passed by a vote of 317 to 301, Meanwhile, another Conservative MP Dame Spelman’s non-binding amendment to reject the UK leaving the EU without a deal was passed by a majority of 8.
The outcomes of the votes mean that PM May would have to return to EU for negotiation of the hardest part of the Withdrawal Agreement – the Irish border. EU’s immediate response was blunt, noting that the backstop was “part of the withdrawal agreement, and the withdrawal agreement is not open for renegotiation”. Indeed, renegotiation would also raise more uncertainty as other EU members might demand the UK to make concession on other issues, such as the fishing rights.
PM May would meet with the EU next month, after which the Parliament would have another Brexit debate and vote on February 14. We see limited room for the EU to change stance on the Irish border issue. This might open another chance for extension of Article 50, force the MPs to consider other post-Brexit relationship with the EU and lead the Government to reconsider holding a second referendum.
The Analytical Overview Of The Main Currency Pairs
The EUR/USD currency pair
Technical indicators of the currency pair:
Prev Open: 1.14253
Open: 1.14303
% chg. over the last day: +0.03
Day's range: 1.14243 – 1.14497
52 wk range: 1.1214 – 1.2557
EUR/USD keeps consolidating around 1.42000-1.14450. Investors are waiting for the Federal Reserve meeting and the US economic reports. It is expected that the Fed will keep the key interest rate around 2.25-2.50%, but earlier the regulator called for making the monetary policy more aggressive. Keep an eye on the comments and rhetorics by the Central Bank representatives.
The Economic News Feed for 30.01.2019:
Preliminary Labour Market Report by ADP (US) – 15:15 (GMT+2:00);
GDP Report (US) – 15:30 (GMT+2:00);
Real Estate Unfinished Sales Index (US) – 15:30 (GMT+2:00);
Federal Reserve Decision on Key Interest Rate (US) – 21:00 (GMT+2:00);
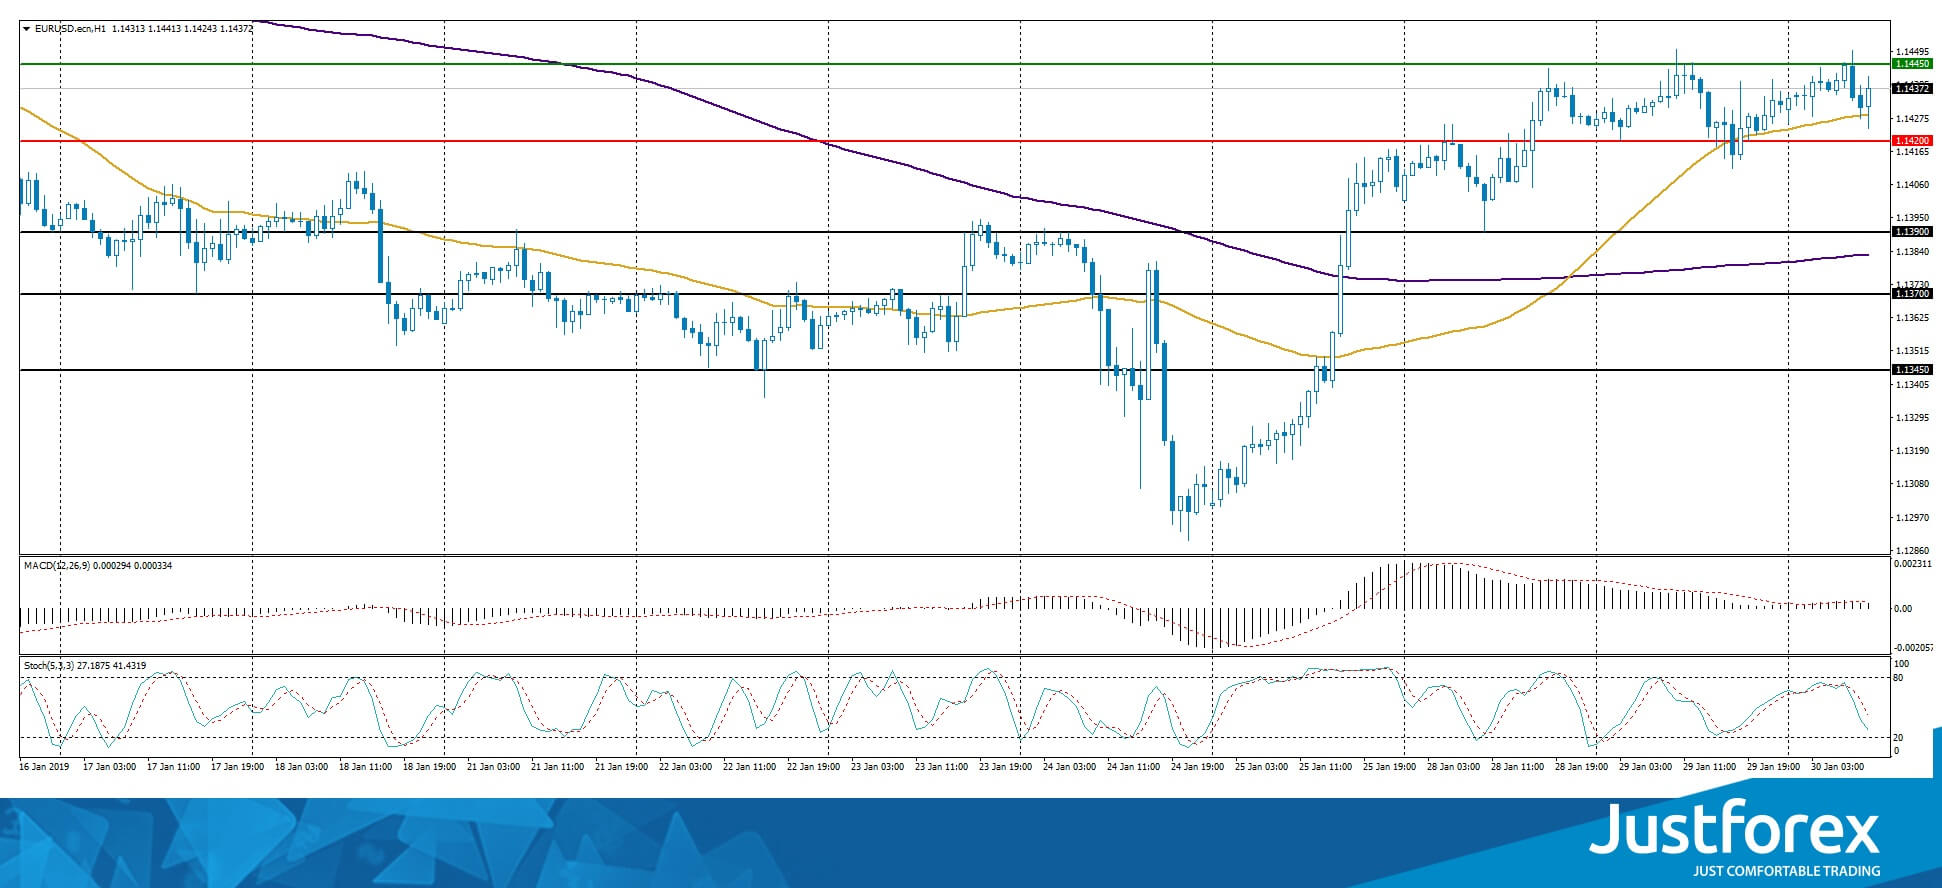
There are no precise signals, the price is testing 50 MA.
The MACD histogram is close to 0.
The Stochastic Oscillator is in the neutral zone, the %K line is below the %D line, which gives a signal to sell EUR/USD.
Trading recommendations
Support levels: 1.14200, 1.13900, 1.13700
Resistance levels: 1.14450, 1.15000
If the price fixes above 1.14450 the quotes will grow toward 1.14800-1.15000.
Alternatively the quotes can correct toward 1.13900-1.13700.
The GBP/USD currency pair
Technical indicators of the currency pair:
Prev Open: 1.31520
Open: 1.30638
% chg. over the last day: -0.63
Day's range: 1.30605 – 1.31213
52 wk range: 1.2438 – 1.4378
GBP/USD started to descend. The pound is under pressure due to the Brexit conundrum. The financial market participants are evaluating the new Brexit bill passed in the UK yesterday. The quotes are recovering around 1.30600-1.31300. You should open positions from these levels and keep an eye on the US News Feed.
The Economic News Feed for 30.01.2019 is calm.
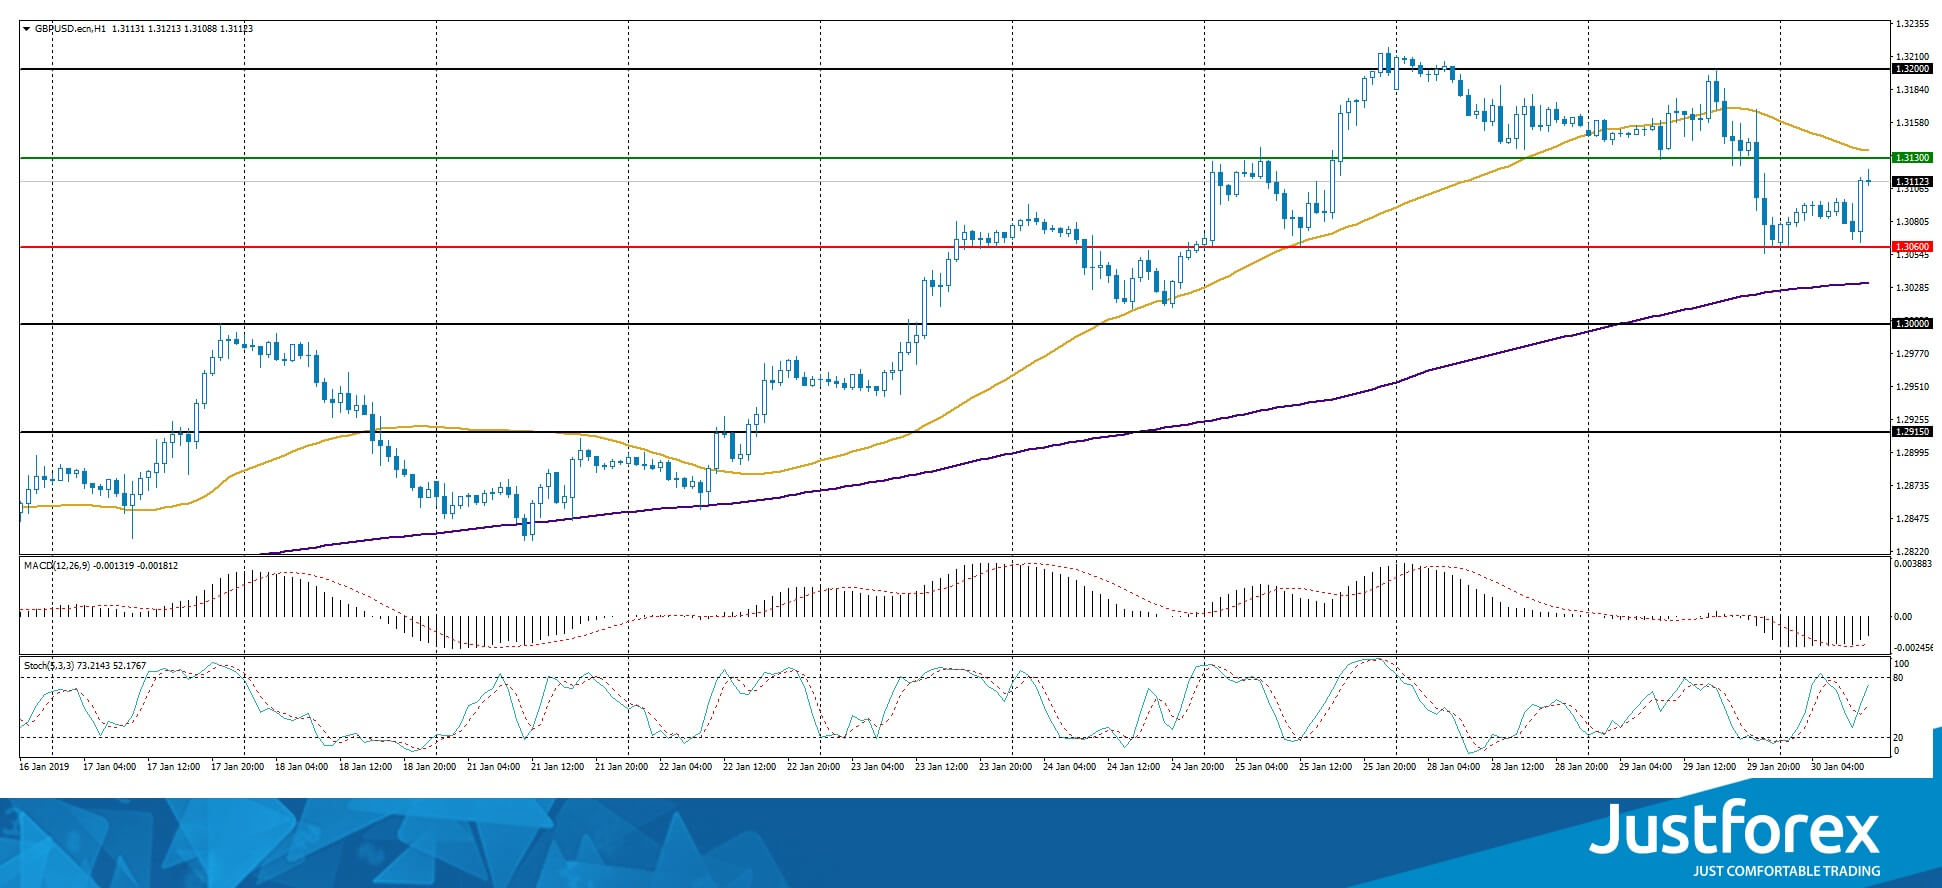
The indicators do not provide precise signals, the price fixed between 50 MA and 200 MA.
The MACD histogram is in the negative zone but above the signal line which gives a weak signal to sell GBP/USD.
The Stochastic Oscillator is in the neutral zone, the %K line is above the %D line which points to the bullish mood.
Trading recommendations
Support levels: 1.30600, 1.30000
Resistance levels: 1.31300, 1.32000, 1.32500
If the price fixes below 1.30600, the quotes are expected to fall towards 1.30000.
Alternatively they can grow toward 1.31800-1.32200.
The USD/CAD currency pair
Technical indicators of the currency pair:
Prev Open: 1.32592
Open: 1.32669
% chg. over the last day: +0.06
Day's range: 1.32447 – 1.32812
52 wk range: 1.2248 – 1.3664
The CAD keeps being traded in a flat. There is no single defined trend. The key support is 1.32400 and 1.32650. The key instrument has a tendency to recover. The investors are waiting for the federal reserve meeting. You should open the positions from the key levels.
The Economic News Feed for 30.01.2019 is calm.
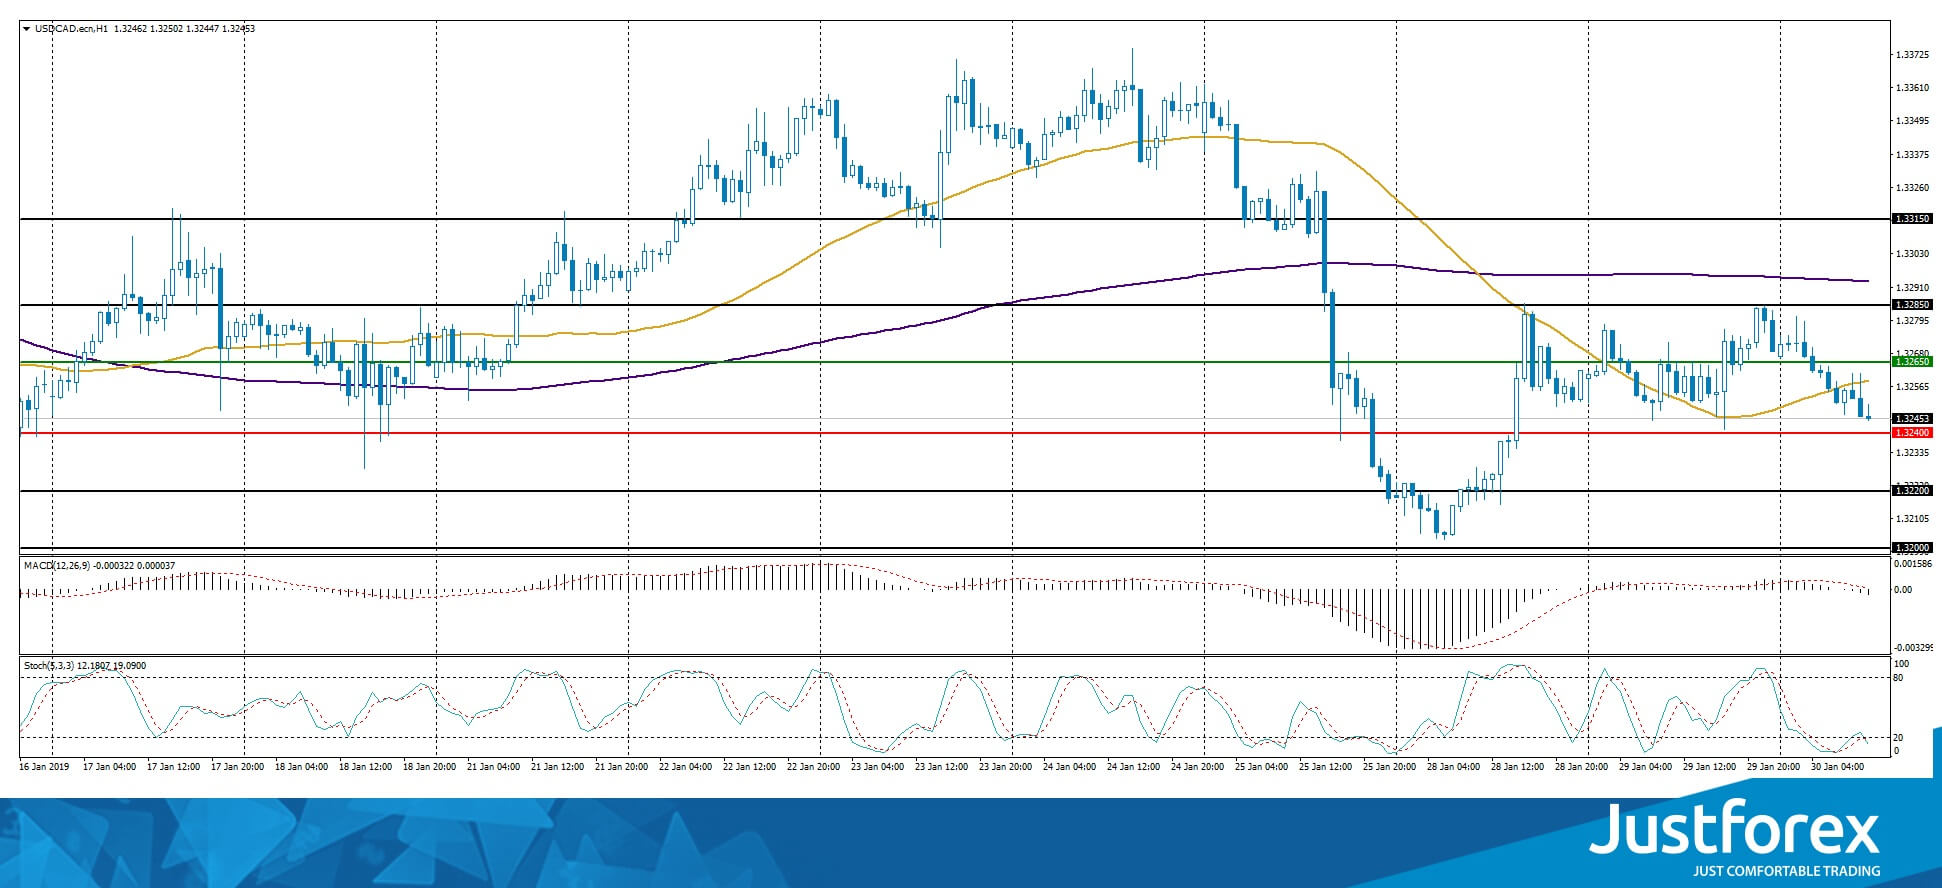
The indicators do not provide precise signals, the price has crossed 50 MA.
The MACD histogram is in the negative zone which indicates a bearish mood.
The Stochastic Oscillator is in the oversold zone, the %K line is crossing the %D line. There are no signals at the moment.
Trading recommendations
Support levels: 1.32400, 1.32200, 1.32000.
Resistance levels: 1.32650, 1.32850, 1.33150
If the price fixes below 1.32400 expect the quotes to fall further, at least to 1.32000.
Alternatively the quotes can grow toward 1.32800-1.33000.
The USD/JPY currency pair
Technical indicators of the currency pair:
Prev Open: 109.317
Open: 109.254
% chg. over the last day: -0.03
Day's range: 109.211 – 109.441
52 wk range: 104.56 – 114.56
Safe have currency keeps consolidating around 109.150-109.450. The quotes have a tendency to descend. Keep an eye on the economic reports and US Treasury bonds yield. Open positions from the key levels.
During the Asian trading session, Japan published positive retail sales reports.
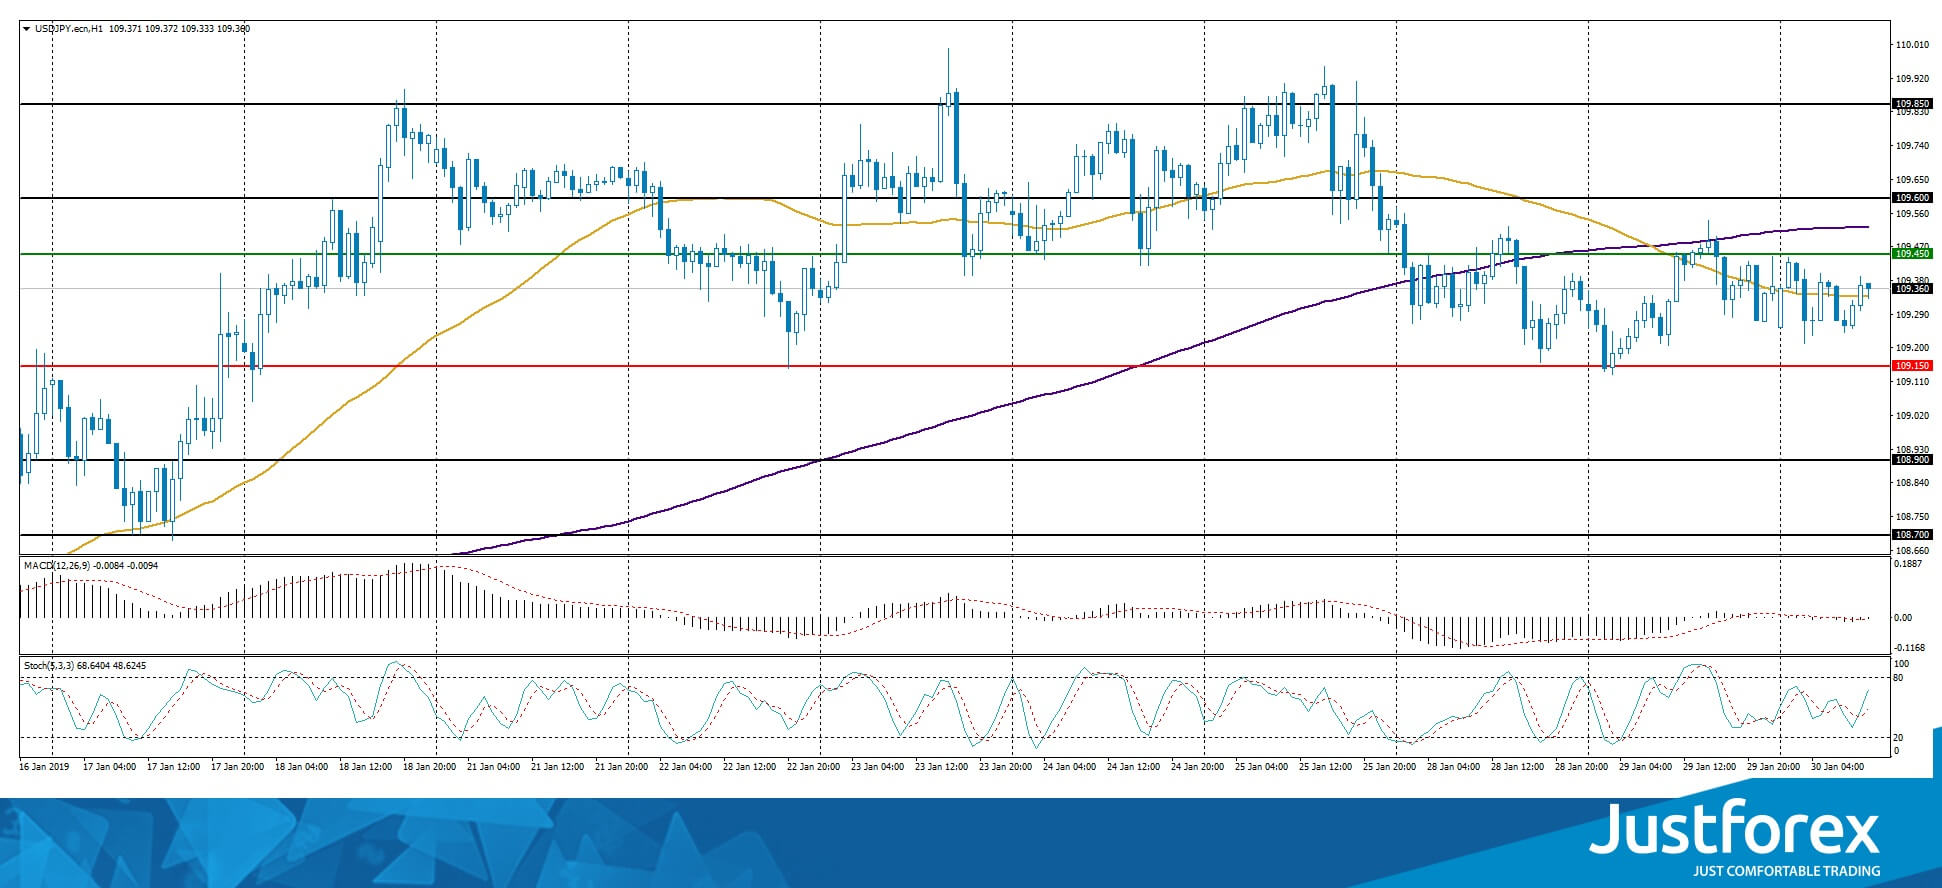
The indicators do not provide precise signals, the price has crossed 50 MA and 200 MA.
The MACD histogram is close to 0.
The Stochastic Oscillator is in the neutral zone, the %K line is above the %D line, which gives a signal to buy USD/JPY.
Trading recommendations
Support levels: 109.150, 108.900, 108.700
Resistance levels: 109.400, 109.600, 109.850
If the price fixes below the local support of 109.150 expect the qutoes to fall toward 108.900-108.700.
Alternatively, they can correct toward 109.700-109.850.
Chinese Manufacturing PMIs Eyed Amid Sharp Slowdown Fears
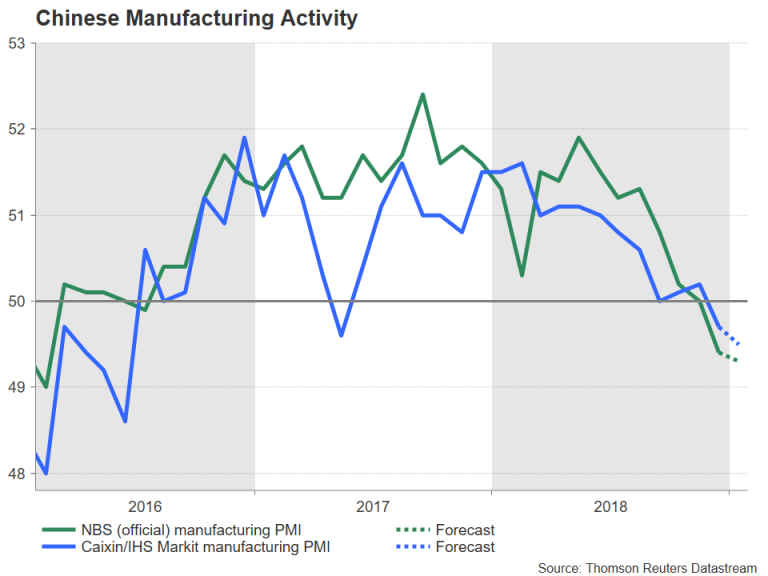
China will publish the official government manufacturing PMI gauge on Thursday at 01:00 GMT, with the private Caixin/Markit manufacturing PMI following on Friday at 01:45 GMT. The official PMI contracted in December for the first time since July 2016, confirming a deepening slowdown in the world’s second largest economy. A second straight month of contraction would likely add to investor jitters about the growth outlook for 2019 and could increase pressure on Chinese authorities to find a quick resolution to the long-running trade spat with the United States.
The National Bureau of Statistics’ manufacturing PMI, which consists mostly of large and state-run enterprises, fell to 49.4 in December and is forecast to have fallen to 49.3 in January to a near three-year low. The Caixin/Markit manufacturing PMI, which focuses more on small and mid-sized enterprises, also fell below the 50 level – which separates expansion from contraction – in December. It is expected to fall to 49.5 in January.
Trade figures for December released earlier this month showed the country’s exports tumbled by 4.4% year-on-year as the frontloading effect from higher US tariffs started to wane. This could be an indication of worse to come for Chinese manufacturers in 2019 and another disappointing figure for January would add to worries about China’s weakening growth picture.
Chinese businesses are not just battling increased protectionism from the US but also tougher lending controls at home as the government presses on with its deleveraging reforms. However, in recent months, authorities have stepped up measures to counter the liquidity squeeze by slashing banks’ reserve requirement ratio, announcing various policy tools to boost lending to smaller firms and injecting huge amounts of money into the financial system via open market operations. The government is also planning on raising fiscal spending significantly in 2019 to lift growth.
The combined fiscal and monetary stimulus could be enough to stave off a severe downturn. However, their effects are unlikely to be felt until the middle of the year and until then, investors will be nervously watching the incoming data for clues about the health of the economy.
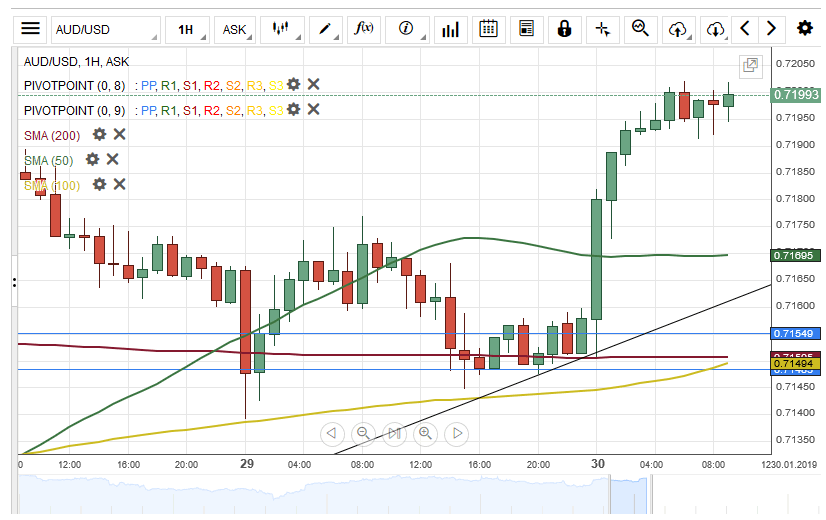
As for this week’s releases, the Australian dollar is at risk of falling back below the $0.71 handle if the numbers disappoint. The aussie is sensitive to Chinese economic indicators and is viewed as a liquid proxy for the yuan given that China is Australia’s biggest export destination.
Worse-than-expected readings in the manufacturing PMIs could send the aussie seeking nearby support around $0.7120 – the 23.6% Fibonacci retracement of the upleg from $0.6743 to $0.7235. This is also where the 200-period moving average is converging. A break below this support region could accelerate the declines towards $0.7047, which is the 38.2% Fibonacci level. Further down, the 50% Fibonacci could be a key support at $0.6989 before the bears aim for the 61.8% Fibonacci at $0.6931.
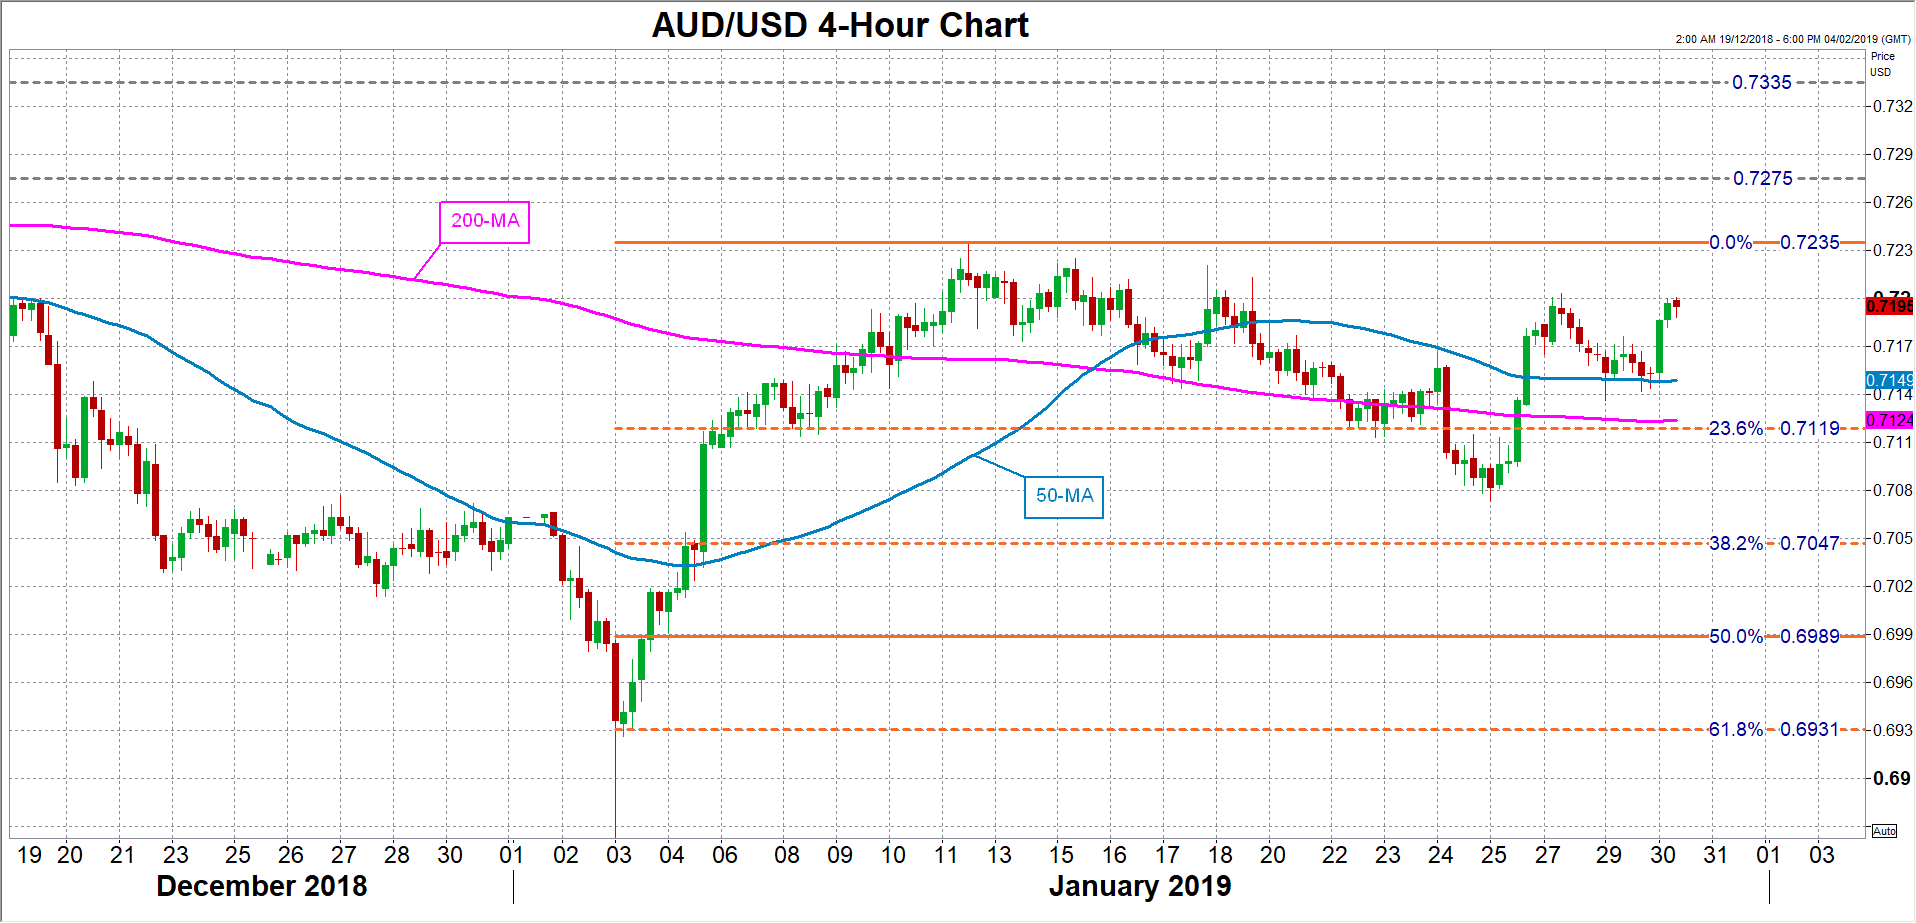
On the other hand, if the data surprise to the upside, the aussie could target the January top of $0.7235. A successful break above this level could drive the currency first towards the $0.7275 resistance level and then the November 2018 peaks around $0.7335.
All Eyes On The FOMC
Today at 19:00 (GMT) the FOMC is to announce its interest rate decision and is widely expected to remain on hold at +2.5%. Fed’s Funds Futures implied yesterday, that the market had fully priced in the possibility of the bank remaining on hold. Hence we could see the market’s attention turning to the accompanying statement and the following press conference (19:30 GMT) of the Fed’s Chair J. Powell. We could see the FOMC acknowledging the growing risks to the US economy as the global momentum seems to be weakening, maintaining a more dovish tone in the accompanying statement, which is our base scenario. On the other hand should the bank find the recent softer US financial data of a more temporary nature, we could see it maintaining a more balanced tone. Also during the following press conference we could see Fed Chair J. Powell implying a change in the FOMC’s stance from gradual rate hikes towards a more wait and see position. Should there be dovish comments, which exceed the market’s expectations, we could see the USD weakening across the board and vice versa. USD/JPY maintain a rather tight range bound movement yesterday, testing the 109.20 (S1) support line. We maintain the view for a sideways movement, however it should be noted that should the FOMC interest rate decision today, be substantially dovish, we could see the pair dropping. Should the pair come under the selling interest of the market, we could see its price action breaking the 109.20 (S1) support line and aim for the 108.25 (S2) support level. On the flip side, should the market favour the pair’s long positions be favoured by the market, we could see it aiming if not breaking the 110.15 (R1) resistance line.
Pound drops on growing Brexit uncertainty
The UK parliament yesterday, decided not to extent article 50 and the Brexit exit date, however voted against a hard Brexit albeit the vote is not binding for the UK government. On the other hand it also decided to scrap the Irish backstop from the deal, providing a clear message to Brussels as Theresa May asked. The next steps of the Brexit drama, include Theresa May heading back to Brussels in order to replace the Irish backstop with alternate means, or at least a serious redrafting of the clause. The EU was quick to reply that the withdrawal deal is not open for renegotiation, which could be indicative of the EU digging in to their positions. We could see volatility rising again for the pound as uncertainty rose again and new Brexit headlines could affect the sterling on either direction. Cable dropped yesterday and tested the 1.3070 (S1) support line, however did not clearly break it. Technically as the pair has broken the upward trendline incepted since the 21st of January, we switch our bullish outlook for a range bound movement. However we maintain reservations for the pair’s direction as it may prove sensitive to any further Brexit headlines, reeling in. Should the bulls take over, the pair could break the 1.3175 (R1) resistance line and hover above it. Should the bears dictate the pair’s direction once again, we could see its price action breaking the 1.3070 (S1) support line and aim if not break for the 1.2960 (S2) support level.
Today’s other economic highlights
In today’s European session, we get from France the preliminary GDP for Q4, from Germany the GfK consumer Sentiment indicator for February as well as the preliminary HICP rate for January and from the Eurozone the Industrial and Economic Sentiment indicators for January. In the American session, we get form the US the ADP National employment figure for January, the preliminary GDP growth rate for Q4 and the EIA crude oil inventories figure.
GBP/USD H4
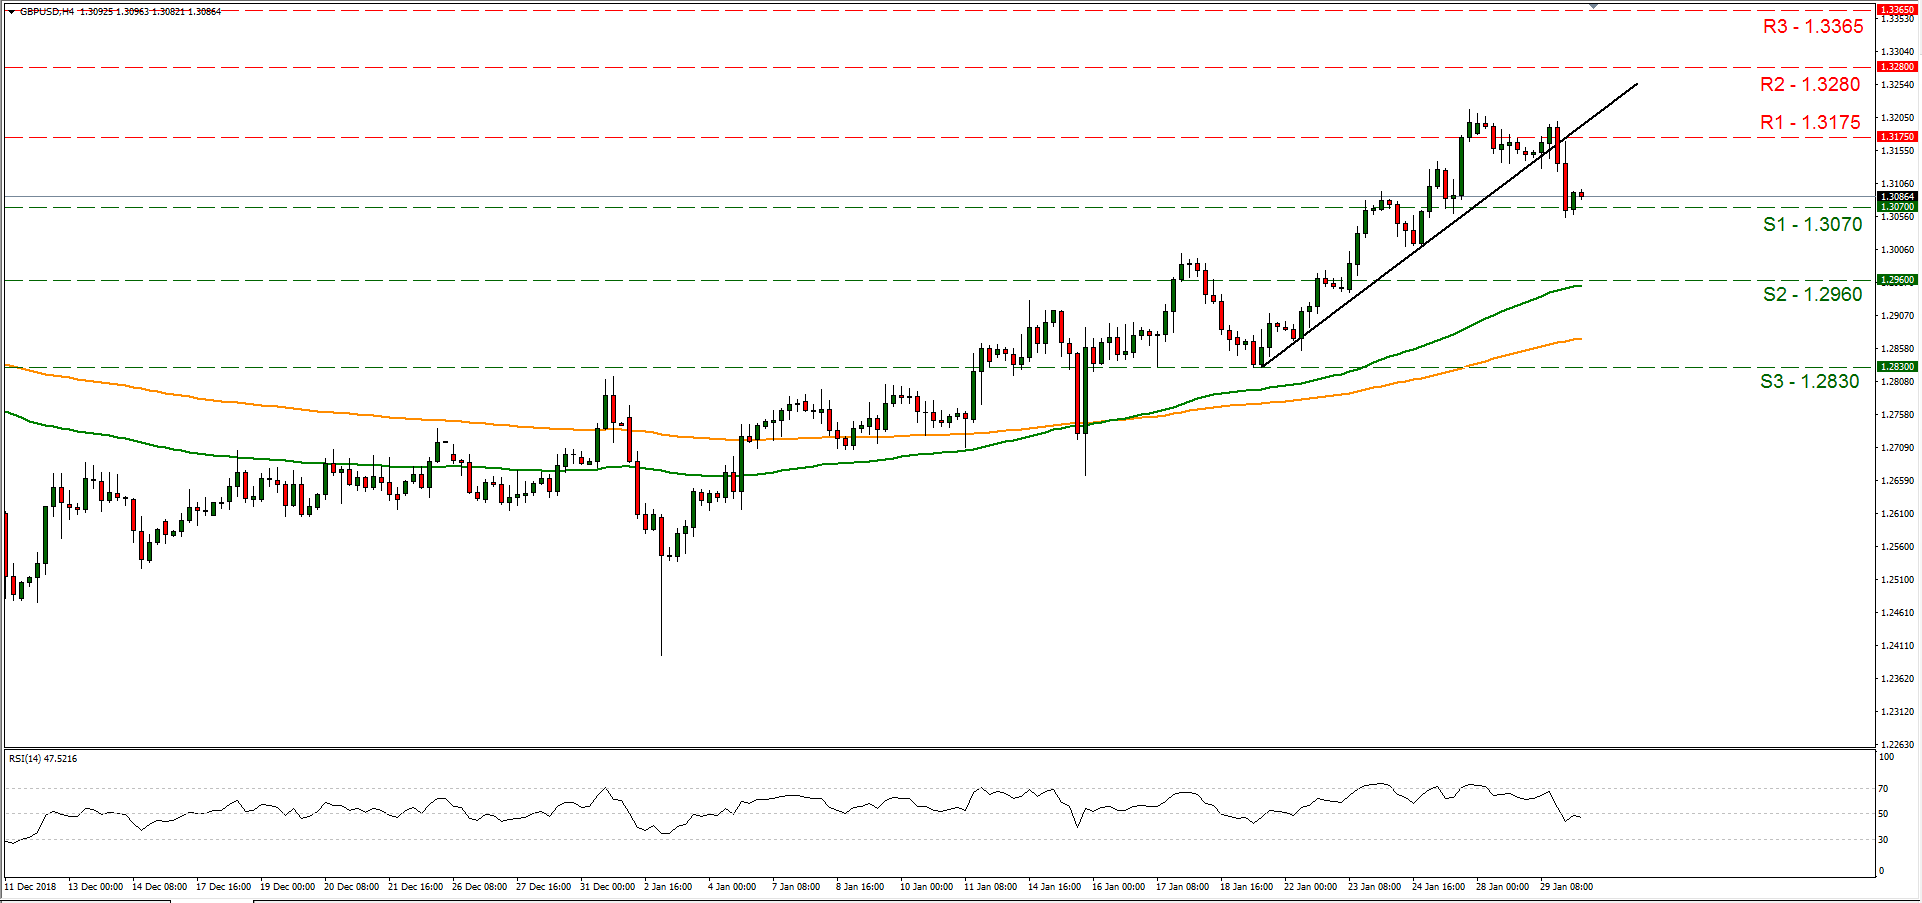
Support: 1.3070 (S1), 1.2960 (S2), 1.2830 (S3)
Resistance: 1.3175 (R1), 1.3280 (R2), 1.3365 (R3)
USD/JPY H4
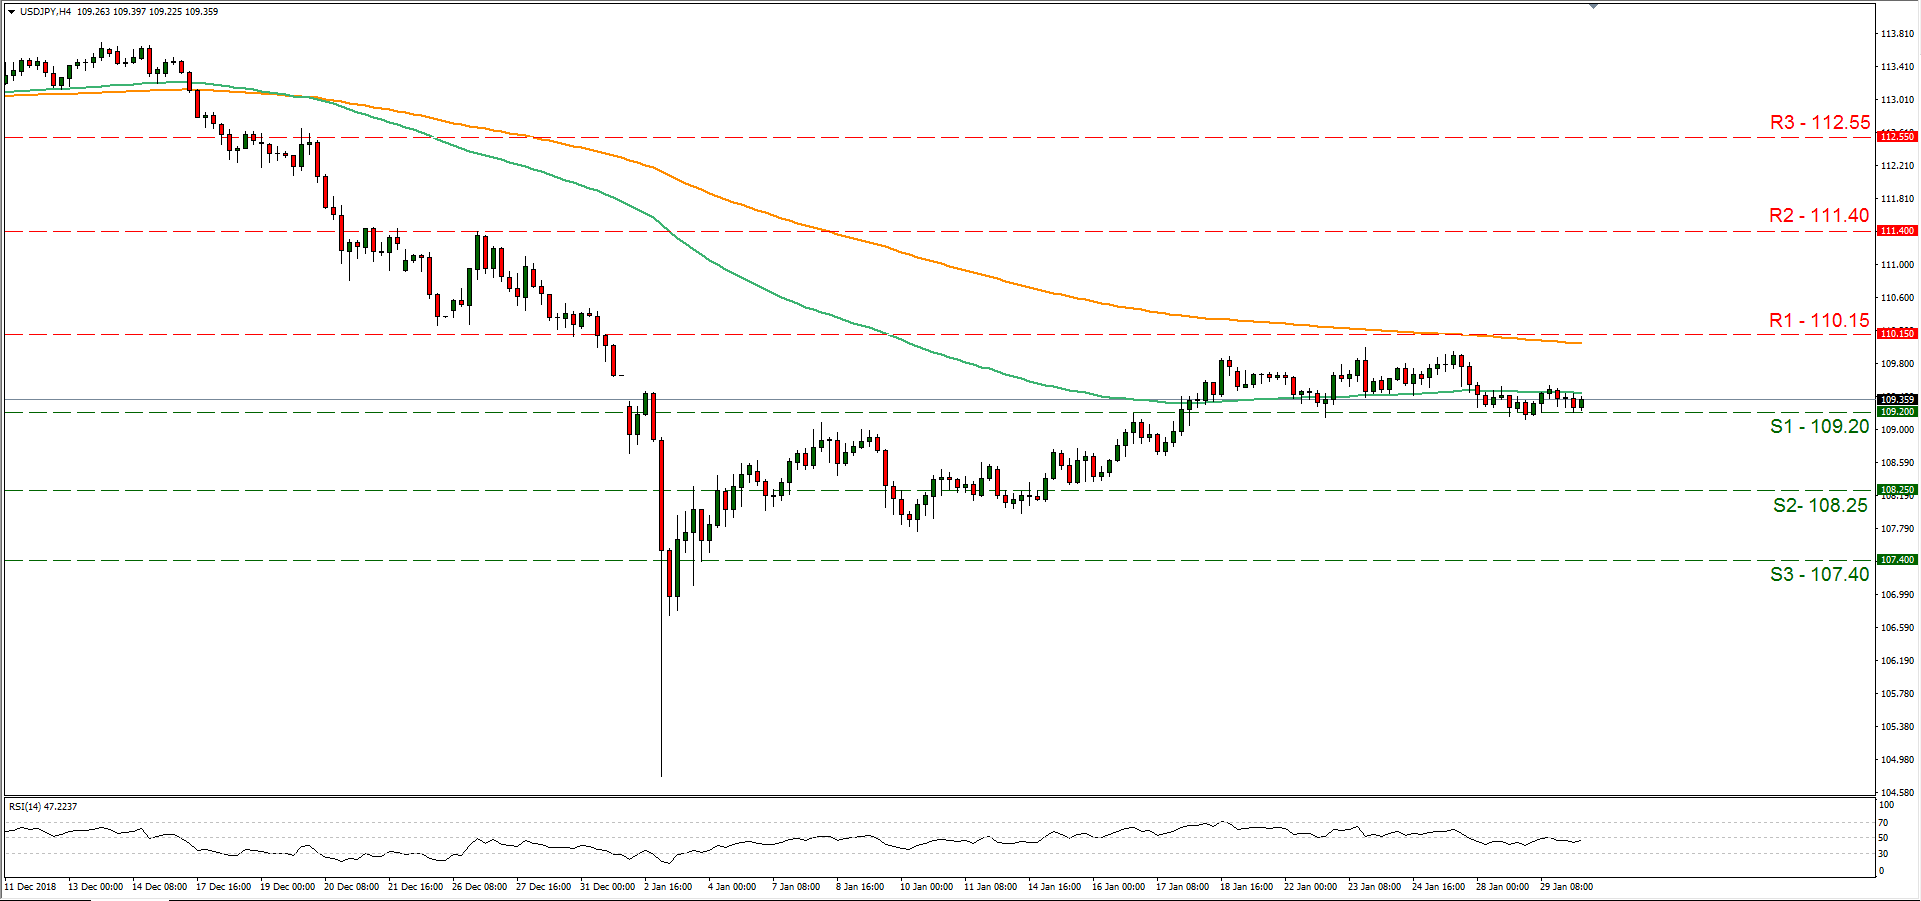
Support: 109.20 (S1), 108.25 (S2), 107.40 (S3)
Resistance: 110.15 (R1), 111.40 (R2), 112.55 (R3)
AUDUSD Surpasses Bullish Cross Of SMAs, Still Negative In Long Term
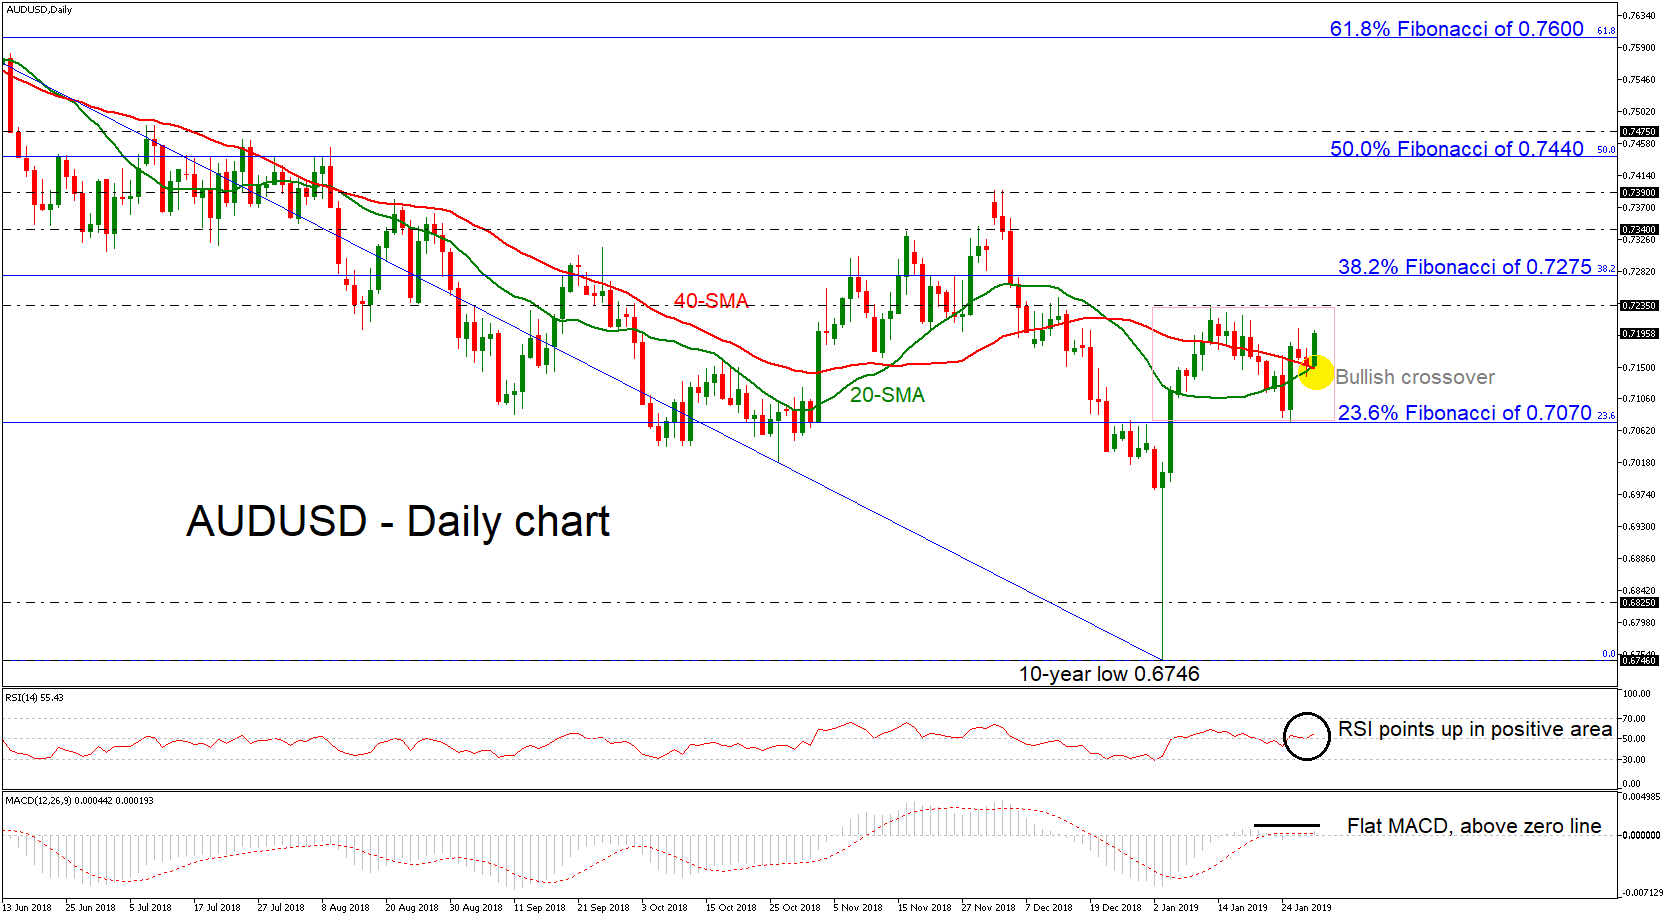
AUDUSD has come under renewed buying interest earlier today finding a strong support level on the bullish crossover between the 20- and 40-simple moving averages (SMAs) in the daily timeframe. After the significant bullish rally from the decade low of 0.6746, the pair is consolidating above the 23.6% Fibonacci retracement level of the downleg from 0.8135 to 0.6746, around 0.7070 and below the 0.7235 resistance.
Momentum indicators now suggest that the market sentiment might get better as the RSI is reversing back to the upside in positive area. However, although the MACD also stands in bullish territory, it is flattening near the zero line.
If the price manages to keep upside movement, nearby resistance could come from the 0.7235 barrier, while further up, the price could rest around the 38.2% Fibonacci mark of 0.7275. A violation of this point may shift attention towards the 0.7340 – 0.7390 resistance area and hence a climb above it could increase speculation that an uptrend is in progress, especially if the pair touches the 50.0% Fibonacci of 0.7440 in the near term.
In the alternative scenario, traders could be eagerly looking for a break below the SMAs to increase selling orders. If that’s the case the rally could last until the 0.7070 support before plunging towards the 0.6825 region, identified by the bottom on January 2016. Steeper declines could open the way for the ten-year low of 0.6746 again.
In the long-term view, AUDUSD has been retaining its descending movement over the last year. Chances for a strong bullish tendency would only come if the pair breaks the 61.8% Fibonacci of 0.7600.
EUR/USD Outlook: N/T Action Remains Congested Between Cloud Top And 100SMA, Tuesday’s Doji Adds To Mixed Outlook
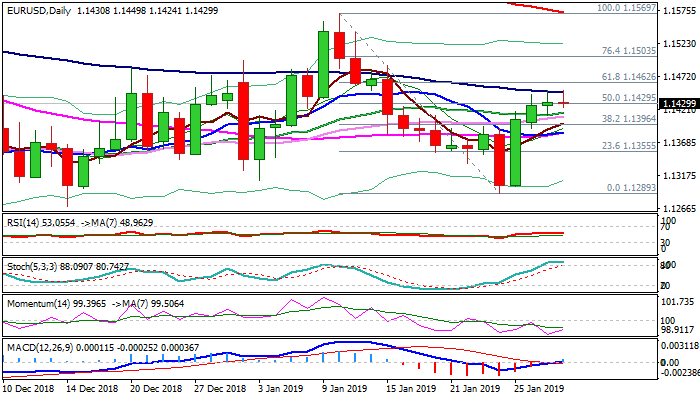
The Euro shows strong indecision following break above daily cloud, as Tuesday's trading ended in Doji candle and the action of early Wednesday was so far in the same shape and remains capped by 100SMA (1.1447).
Mixed daily studies (negative momentum and overbought slow stochastic) conflict bullishly aligned MA's (10/20/30/55) and lack clearer signal.
Bullish bias is expected to remain in play while the price holds above cloud top (1.1418, reinforced by rising 20SMA), but risk of fresh weakness would exist as long as 100SMA caps.
Breach of either pivot (100SMA at the upside or cloud top/20SMA at the downside would generate initial direction signal. Bullish scenario would look for confirmation on lift above 1.1462 (Fibo 61.8% of 1.1569/1.1289), while further negative signal could be expected on extension below 1.1387 (converged 10/55SMA's).
Mixed German data (better than expected consumer climate was offset by downbeat export/import data) made little impact at the pair, with focus turning towards German CPI data and Fed policy decision, which would provide fresh signals.
Res: 1.1447, 1.1462, 1.1489, 1.1503
Sup: 1.1418, 1.1396, 1.1387, 1.1377
EUR/JPY Guided By 50-Hour SMA
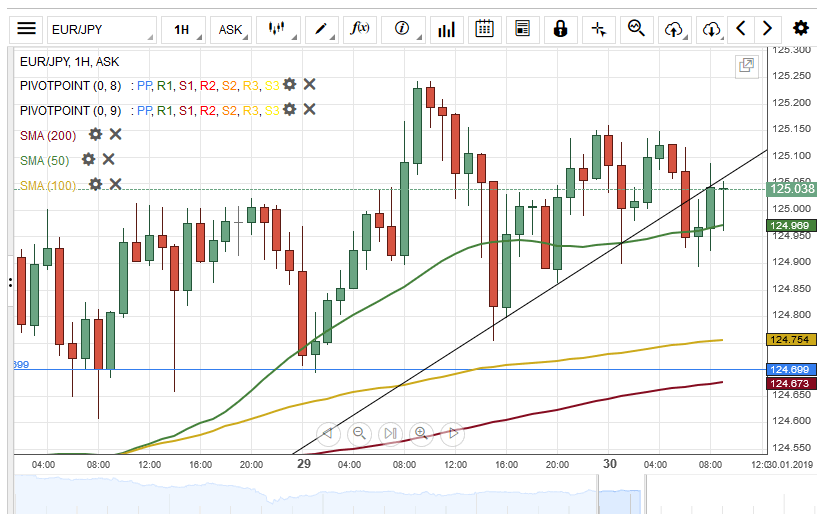
The price movement of the single European currency against the Japanese Yen was guided by the 50-hour simple moving average on Tuesday.
The currency pair tested the 50-hour SMA during the first part of today's session. The exchange rate breached the lower boundary of an ascending channel pattern during the UK's trading session on Wednesday.
As for the near future, it is possible that the Euro move towards a support cluster at 124.74.
Although, if the 50-hour SMA holds, the currency exchange rate could aim for a swing high of 125.33 within the following trading hours.
AUD/USD Bullish Momentum Today
The Australian Dollar bounced off a support cluster formed by the combination of the weekly and the monthly pivot points and the 200-hour simple moving average at 0.7150 during the Asian session on Wednesday.
By the middle of the European trading session, the exchange rate had surged about 53 base points.
Most likely, the bullish momentum could continue within the next hours and possibly aim for a resistance level at 0.7220.
If the resistance line as mentioned earlier holds, a potential downside movement might occur.