Sample Category Title
US Government Shutdown Impact, and the Prospect for More
The US government shutdown has ended, for the next two weeks at least, leaving a trail of delayed economic data and lost economic output in its wake. Unless Republicans and Democrats can reach a compromise soon, the government will likely shut down again, or President Trump could declare a national emergency. Overall, the longer and the more frequent shutdowns become, the more political uncertainty rises – at a time when trade uncertainty is already elevated.
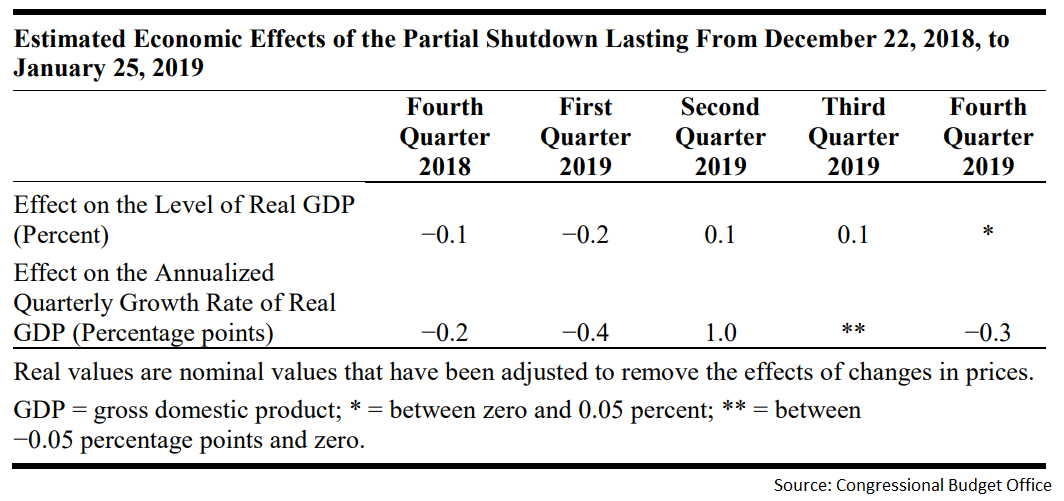
The impact of the partial US government shutdown was barely visible in financial markets, with neither US stocks nor the dollar being affected in a material manner. Yet, the latest estimates by the non-partisan Congressional Budget Office suggest the shutdown shaved 0.1% off real GDP growth in Q4 2018 and 0.2% off Q1 2019 growth, with these numbers being even larger in annualized terms. While some of that growth will be recovered, another part of it will be lost permanently.
Equally importantly, several key economic data have been delayed – most crucially retail sales for the key month of December and the preliminary estimate of GDP growth for Q4. It isn’t clear yet when these figures will be released. Admittedly though, if they are postponed for much longer, any market impact may be smaller than usual, as they could increasingly be seen as outdated by both policymakers and investors.
Looking ahead, 25% of the government is due to shut down again in roughly two weeks’ time, on February 15. That is, unless Democrats and Republicans can reach a compromise on the thorny issue of border security, with President Trump refusing to sign any bill that doesn’t include funding for “the wall” – a physical barrier along the US-Mexico border. The other options would be for the President to back down (unlikely), or for him to declare a national emergency, bypassing Congress and allocating emergency federal funds for the wall. This is a ‘legally questionable’ route, which is likely to be challenged in court by land owners whose property will be seized, implying major delays in the whole process.
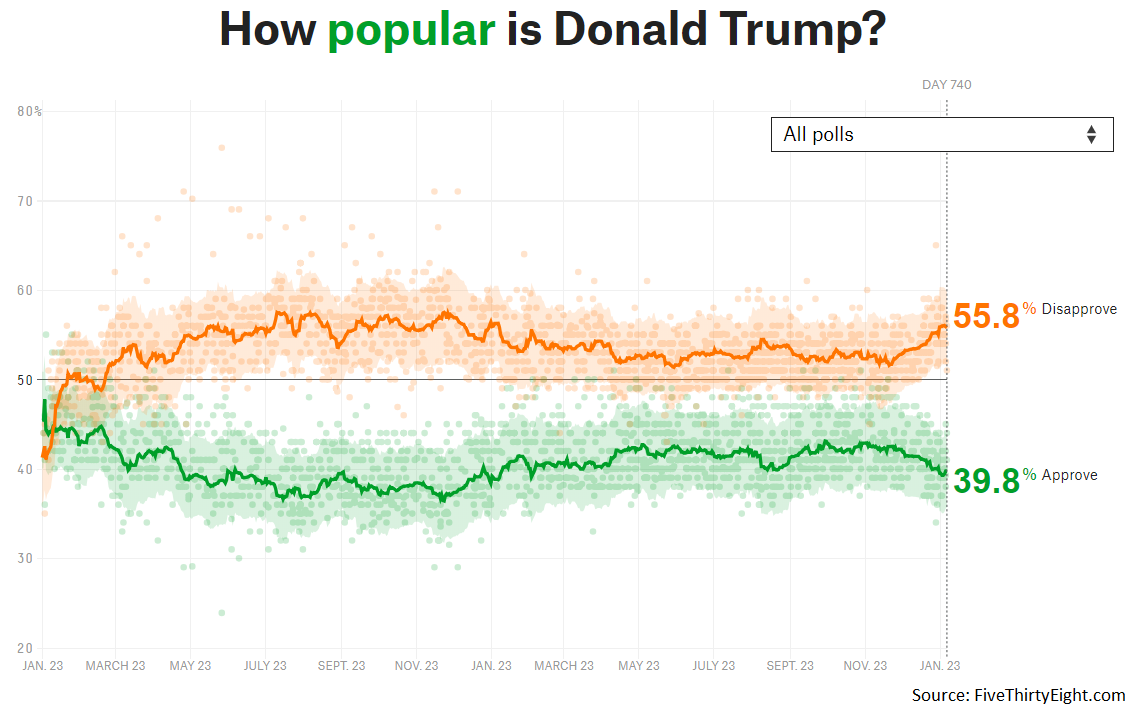
What does this all mean for markets? It suggests that with a split Congress, political deadlocks become commonplace and thus overall political uncertainty rises. Investors typically remain oblivious to shutdowns because 1) only part of the federal government closes and 2) they see through the ‘political theater’ and expect a swift resolution, which is usually the case. Yet, the longer and the more frequent shutdowns become, the greater the real-world impact, such as investment decisions being postponed. Hence, this may become a theme to watch out for throughout 2019, as it could grow increasingly important for assets like US equities and the dollar, negatively affecting both if the situation escalates.
This, at a time when trade uncertainty is already high amid the US-China dispute. On that front, a two-day round of top-level negotiations kicked off today. In the immediate term, this will be the main driver for risky assets like stocks. Recent reports suggest China has made concessions on the trade deficit, proposing plans to eliminate it by 2024, but that there’s little progress on key issues like intellectual property protection. It will be interesting to see whether the Trump administration “digs in for the long haul” and waits for major concessions on these matters, or whether it will settle for a short-term solution that boosts markets and can also be presented as a “victory” ahead of next year’s election campaign.
Elliott Wave Analysis: GOLD and Silver Intra-day Update
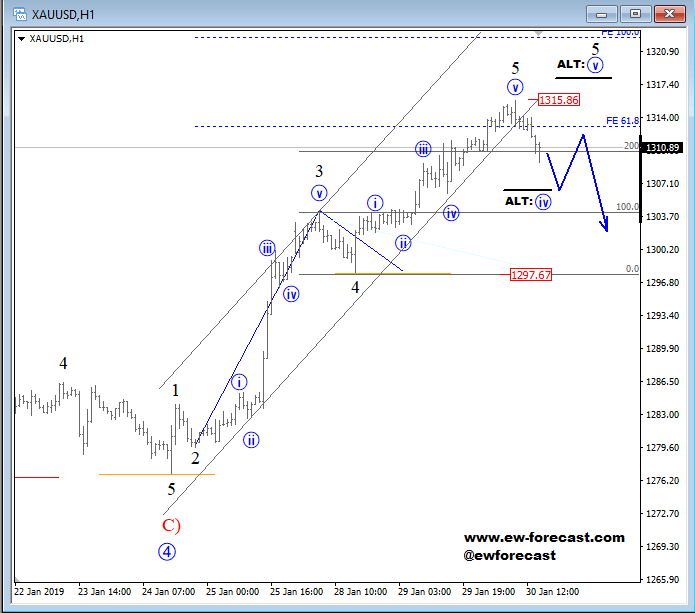
GOLD is currently dropping from the highs, which can be first evidences of a completed bigger impulse from January of 24. That said, a drop below the 1300/1302 level would mean a deeper pullback to be in play, while a recovery from current levels, and above the 1315 level would suggest final sub-wave v of 5 to be in progress.
Gold, 1h
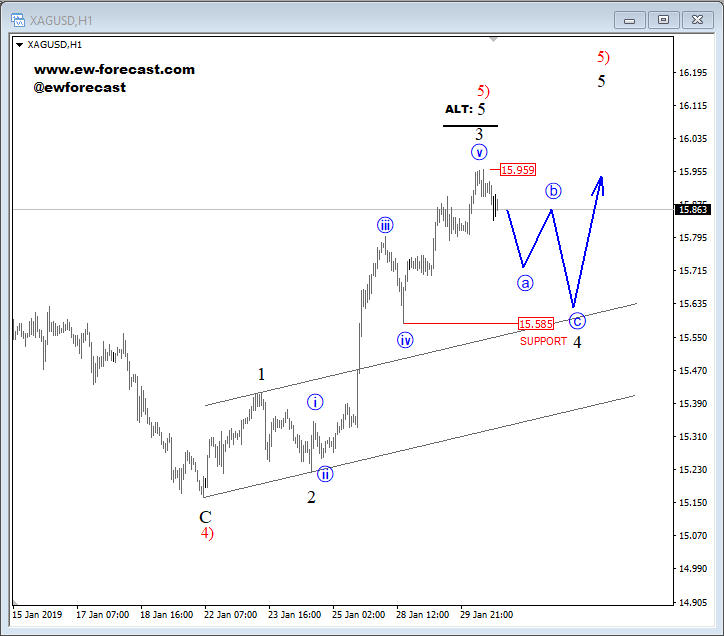
Silver can be in the same situation as gold, now unfolding a three-wave reversal from the 15.96 high. If we get a drop below the 15.58 level, then a top has already been posted, and now a bearish continuation is in play, however in case we see a recovery above the 15.96 level, then this would favor more upside.
Silver, 1h
MARKET WRAP: Stocks Closed Higher Ahead of Fed Decision
Fed is likely to remain on autopilot and data dependent. Traders are not expecting another rate hike but they expect a dovish statement.
Stocks
- The S&P 500 Index jumped 0.7 percent as of 15:32 in London.
- The Stoxx Europe 600 Index soared 0.4%, touching the highest level in eight weeks.
- The U.K.’s FTSE 100 Index scored another 1.6 percent gain.
- The MSCI Emerging Market Index followed global markets and jumped 0.2 percent.
Currencies
- The Dollar Spot Index is up 0.2 percent ahead of the Fed decision.
- The Euro dropped 0.2 percent to $1.1413, mainly due to the dollar strength.
- The British pound gained its lost ground and up by 0.2 percent to $1.3086.
- The Japanese yen fell out of luck and down by 0.3 percent to 109.71 per dollar.
Bonds
- The yield on 10-year Treasuries jumped one basis point to 2.72 percent.
- Germany’s 10-year yield retraced and dropped one basis point to 0.18 percent.
- Britain’s 10-year yield also moved lower by one basis point to 1.25 percent.
Commodities
- West Texas Intermediate crude liked the global sentiment and jumped by 1 percent to $53.87 a barrel.
- Gold retraced a little but still unchanged at $1,315.50 an ounce.
British Pound Under Pressure as Brexit Turmoil Continues
GBP/USD has steadied in the Wednesday session, after losing close to 1.0% so far this week. In North American trade, the pair is trading at 1.3072, up 0.04% on the day. In the U.K., the BRC Shop Price Index gained 0.4%, its strongest reading since April 2013. Net Lending to Individuals jumped to GBP 4.8 billion, well above the estimate of GBP 4.3 billion. Later in the day, British consumer confidence is expected to post a weak score of -14 points. In the U.S., the highlight is the Federal Reserve rate statement. With the Fed expected to remain on the sidelines, investors will be focusing on the rate statement, which is expected to be dovish in tone. The ADP nonfarm employment change fell to 213 thousand, but managed to beat the forecast of 180 thousand. On Thursday, the U.S. publishes Employment Cost Index and unemployment claims.
After a tumultous session in parliament, the Brexit outlook remains as unclear as ever. Lawmakers voted against a no-deal scenario (although this is not binding) and instructed Prime Minister May to go back to Brussels to renegotiate the Irish backstop provision. However, the EU has insisted it will not reopen the withdrawal deal. On Tuesday, an EU official expressed dismay over the Brexit wrangling, saying that “London has negotiated with itself more than the EU.” The May government has refused to put a no-deal Brexit off the table, in part to keep pressure on the EU to show some flexibility and avoid a no-deal scenario, which would be detrimental to the eurozone as well as the U.K.
The Federal Reserve was aggressive in 2018, raising rates by a quarter-point on four occasions. With a nasty trade war dampening global economic growth, it is clear that the Fed will ease up on monetary policy this year. But, by how much? There are a various answers, depending on who you ask. The markets are not expecting any increases this year, while the Federal Reserve continues to stick with a forecast of two hikes. The Congressional Budget Office has also weighed in, saying that it expects further rate increases this year. Investors will be combing through the rate statement, looking for clues as to the timing of the next rate hike.
Sunset Market Commentary
Markets
Global core bonds are trading mixed today with US Treasuries underperforming German Bunds. Risk sentiment turned positive on good corporate results. With the US-Sino high-level trade talks commencing today and the Federal Reserve’s first policy meeting of 2019 lined up for tonight, position taking remained muted. German Bunds opened with a downward tendency. EMU economic confidence gauge printed below expectations, the German government lowered its 2019 growth forecast and the German consumer inflation decelerated in January. The German Bund recovered to opening levels. The German yield curve flattens with changes varying between -1.6 bps (30-yr) to +0.8 bps (2-yr). US equities opened higher (good results of Boeing, McDonalds) and ADP employment growth surprised on the upside. However, the focus is turning to the this evening’s Fed meeting. Investors will carefully weigh chairman Powell’s words on possible alterations to the current auto-pilot reduction of the Fed balance sheet and the central bank’s intentions on future rate hikes. US Treasuries edged lower, pushing the US yield curve higher. Changes mount up to 1.1 bps (10-yr).In Italy, the temperature is mounting up again as tensions arise between the two coalition partners 5SM and Lega. Italian BTP’s initially edged lower but paired intraday losses after a successful 5-/10-yr bond sale. The Italian spread over the German 10-yr yield tightens 2 bps.
Trading in the major USD cross rates again developed in tight ranges today, even as there was quite a series of interesting data. FX traders were simply counting down to this evening’s Fed policy decision and press conference. In technical trade, EUR/USD drifted in the 1.1430 area during most of the European morning session. French Q3 GDP was stronger than expected, but EC confidence remained weak. Later, German/EMU yields and the euro declined a tad as the German government downwardly revised its 2019 growth forecast from 1.8% to 1.0%. However, especially the euro downtick was extremely limited and short-lived. A similar reaction occurred on soft January German CPI data published early afternoon. Finally, it was a strong US ADP labour report that tilted the balance in favour of the dollar. EUR/USD trades currently in the 1.1415 area. USD/JPY jumped higher and is currently trading in the 109.70 area. The degree of Fed flexibility on interest rate hikes and/or the balance sheet roll-off might decide on the next USD move.
Sterling stabilized off the correction lows touched after the vote on the Brexit amendments in the UK Parliament yesterday. UK May returning to Brussels in attempt to renegotiate the Backstop clause probably triggers a new period uncertainty/low visibility on the Brexit process. Even so, the rather muted reaction of sterling probably suggests that at least a substantial part of market participates assume that a no-deal Brexit can still be avoided in one way or another. EUR/GBP is currently trading in the 0.8725 area. Cable is trading below the 1.31 handle.
News Headlines
A series of data today showed German inflation slipping in January with -1.0% MoM (1.7% YoY). The decline is most likely oil driven. EMU economic confidence disappointed slightly, falling from 107.4 to 106.2 vs. 106.8 expected. Belgium revealed 2018Q4 GDP growth to land at 0.3% QoQ (1.2% YoY). Finally, the US published another strong ADP job report (213k vs 181k expected)
Republican and Democratic members of Congress open negotiations today to find a permanent government funding solution after Trump temporarily lifted the shutdown for 3 weeks last Friday. Trump already warned this morning that not considering his wall funding during the discussions would be a waste of time. A deal should be wrapped up by February 10 for legislation to get approved in time (i.e. before February 15).
UK 100 Index Creates Upside Rally in Short Term
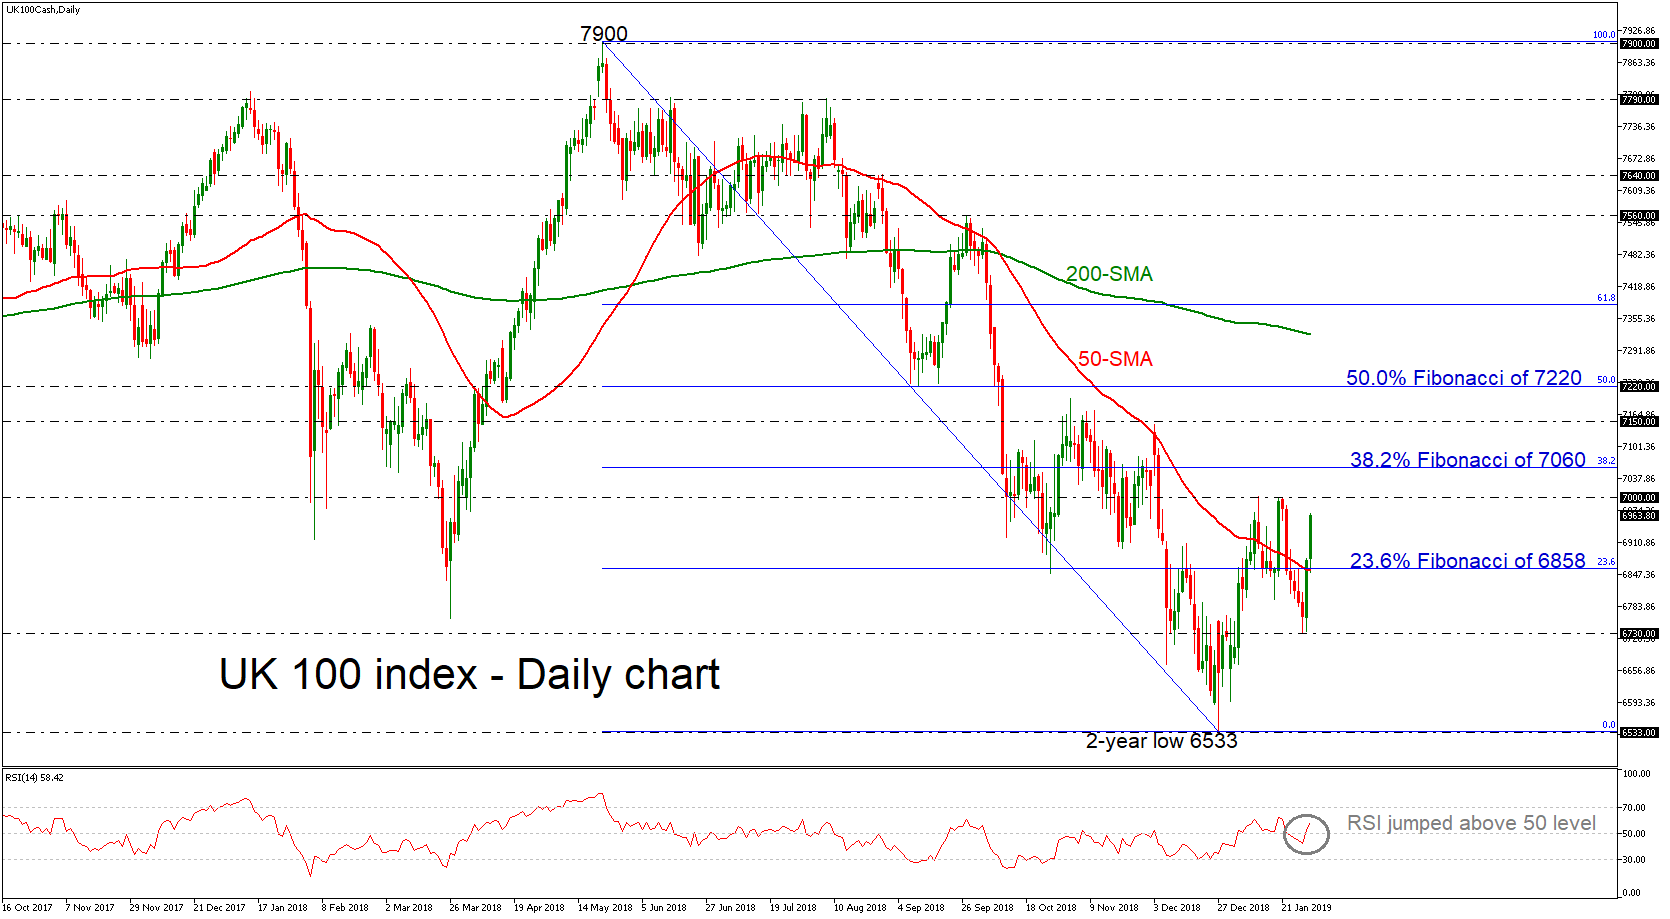
UK 100 stock index (FTSE 100) is set to record another strong green day, surging above the 50-simple moving average (SMA) and the 23.6% Fibonacci retracement level of the downleg from 7900 to 6533 around 6858 in the daily chart. The RSI now suggests that the market sentiment might get better as the index is moving in the positive territory.
If the price manages to continue bullish actions and surpasses the 7000 level, the 38.2% Fibonacci retracement level of the downleg from 7900 to 6533, around 7060 could come in focus. Further up, the index could rest around the 7150 level as it did in early December, while a violation of this point may shift attention towards the 7200 resistance, which overlaps with the 50.0% Fibonacci mark.
However, should bearish dynamics dominate, the market might revisit the 23.6% Fibonacci of 6858 before falling towards the 6730 support, taken from the latest lows. Below that, the price could hit again the key level of 6533.
Overall, the downfall from 7900 is still active and hence the outlook remains negative despite the short-term upward rally.
XAU/USD Outlook: Gold Eases from 8-month High ahead of Fed
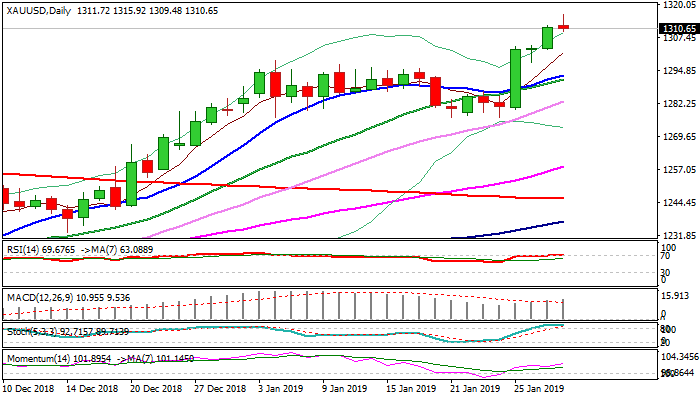
Spot gold eased from new 8-month high at $1315, posted earlier today, as dollar rose on better than expected numbers of ADP private sector employment report.
US private sector added 213K jobs in Jan vs 180K f/c and 273K, downward-revised figure in Dec.
Stronger greenback slowed gold's bulls, which registered advance of 2.4% in past thee days, on renewed risk aversion ahead of continuation of trade talks between US and China.
Deeper pullback cannot be ruled out as overbought daily techs (slow stochastic is reversing in overbought territory and RSI is moves sideways on the border of overbought territory, unable to break higher).
Dips were so far minor and hold away from initial support at $1306 (Fibo 23.6% of $1276/$1315) and more significant $1300 (psychological/Fibo 38.2%/rising 5SMA).
Traders await the verdict from Fed's two-day policy meeting, with wide expectations for unchanged rates and dovish steer from chief Powel, as the central bank is likely to pause rate hikes in 2019, due to deteriorating conditions in the global economy.
Res: 1316; 1320; 1325; 1328
Sup: 1309; 1306; 1300; 1296
EUR/USD Mid-Day Outlook
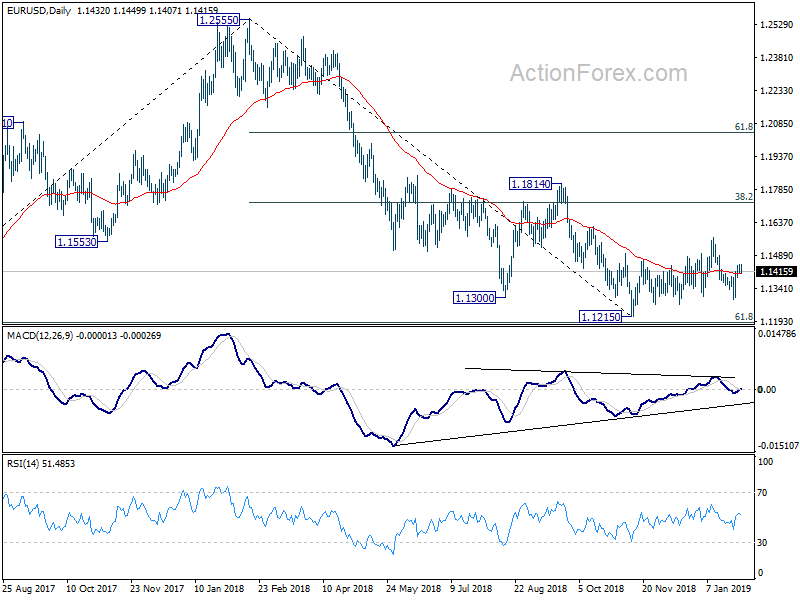
Daily Pivots: (S1) 1.1413; (P) 1.1431; (R1) 1.1452; More.....
Intraday bias in EUR/USD is turned neutral with a temporary top in place at 1.1450. But with 1.1390 minor support intact, further rise is mildly in favor. Corrective pattern from 1.1215 is possibly still extending, with rise from 1.1289 as another leg. Further rally would be seen to 1.1569 resistance and above. On the downside, below 113.90 minor support will turn bias back to the downside for 1.1289 support instead.
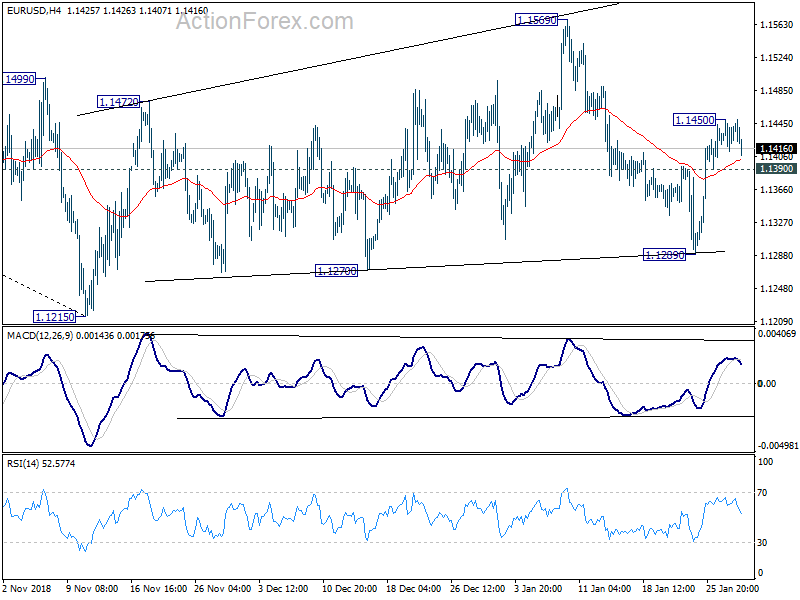
In the bigger picture, as long as 1.1814 resistance holds, down trend down trend from 1.2555 medium term top is still in progress and should target 61.8% retracement of 1.0339 (2017 low) to 1.2555 at 1.1186 next. Sustained break there will pave the way to retest 1.0339. However, break of 1.1814 will confirm completion of such down trend and turn medium term outlook bullish.
GBP/USD Mid-Day Outlook
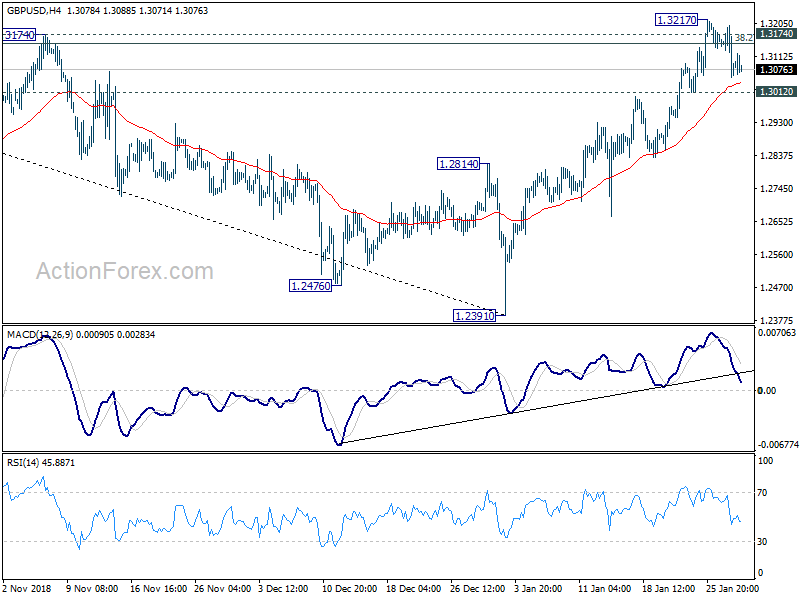
Daily Pivots: (S1) 1.3012; (P) 1.3106; (R1) 1.3161; More....
Intraday bias in GBP/USD remains neutral and focus is on 1.3012 minor support. Break of 1.3012 support will suggest rejection by 1.3174 key resistance, and turn bias to the downside for 1.2814 support. On the upside, sustained break of 1.3174 key resistance will argue that whole decline from 1.4376 has completed at 1.2391. In such case, further rise should then be seen to 61.8% retracement of 1.4376 to 1.2391 at 1.3618.
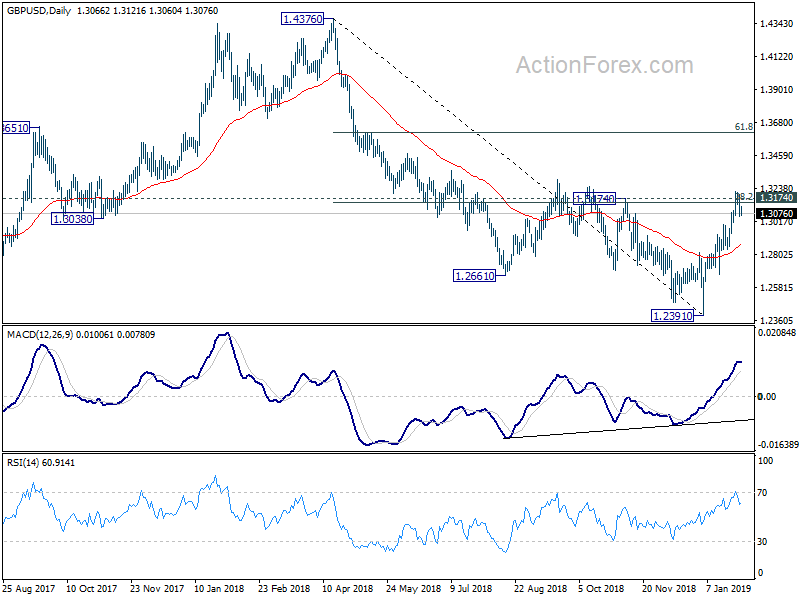
In the bigger picture, rise from 1.1946 (2016 low) to 1.4376 (2018 high) is seen as a corrective move. Similarly, fall from 1.4376 to 1.2391 also displace a corrective structure. Current development suggests that rise from 1.2391 is the third leg of the corrective pattern from 1.1946 and could extend beyond 1.4376 high. Firm break of 61.8% retracement of 1.4376 to 1.2391 at 1.3618 will affirm this case. On the downside, break of 55 day EMA (now at 1.2865) will turn focus back to 1.2391 low instead.
USD/JPY Mid-Day Outlook
Daily Pivots: (S1) 109.16; (P) 109.35; (R1) 109.58; More...
At this point, USD/JPY is still staying in range of 109.14/110.00 and intraday bias remains neutral. On the upside, break of 110.00 will resume the rebound from 104.69. But we'd expect strong resistance from 61.8% retracement of 114.54 to 104.69 at 110.77 to limit upside. On the downside, break of 109.14 minor support will be the first sign of completion of the rebound. Intraday bias will then be turned back to the downside for 107.77 minor support first.
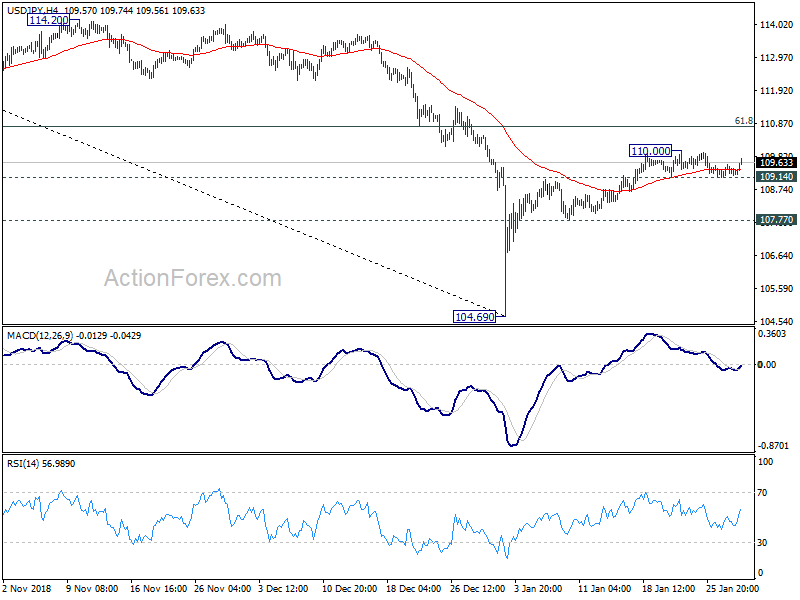
In the bigger picture, while the rebound from 104.69 is strong, there is no change in the view that it's a corrective move. That is, fall from 114.54, as part of the decline from 118.65 (2016 high), is not completed yet. Break of 104.62 will target 100% projection of 118.65 to 104.62 from 114.54 at 100.51, which is close to 100 psychological level. Nevertheless, sustained trading above 55 day EMA (now at 110.82) will dampen this bearish view and turn focus back to 114.54 resistance instead.