

Sample Category Title
Silver: White Metal Trading Flat In The Morning Session
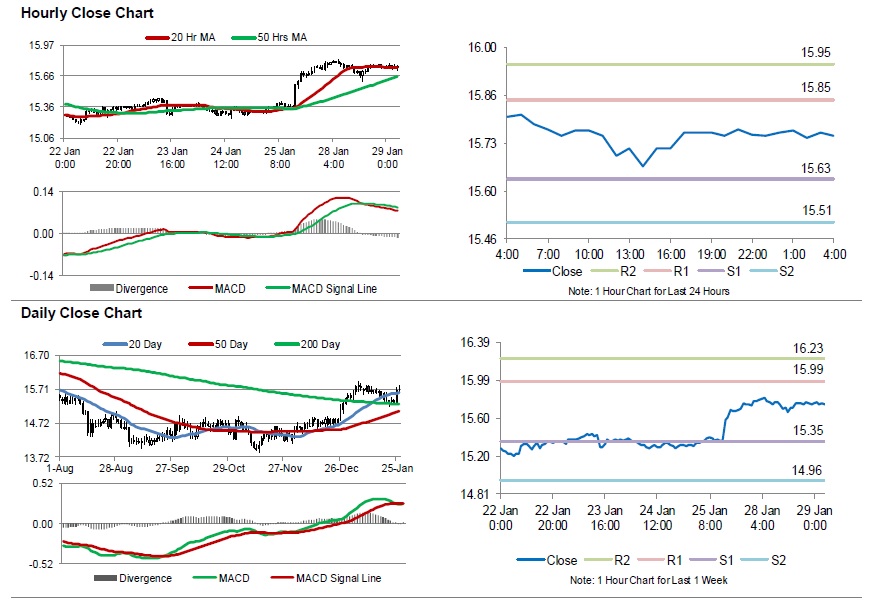
For the 24 hours to 23:00 GMT, Silver declined 0.28% against the USD and closed at USD15.75 per ounce.
In the Asian session, at GMT0400, the pair is trading at 15.75, with silver trading flat against the USD from yesterday’s close.
The pair is expected to find support at 15.63, and a fall through could take it to the next support level of 15.51. The pair is expected to find its first resistance at 15.85, and a rise through could take it to the next resistance level of 15.95.
The white metal is showing convergence with its 20 Hr moving average and trading above its 50 Hr moving average.
Crude Oil: Oil Trading Higher, Ahead Of API’s Weekly Crude Oil Inventories Data
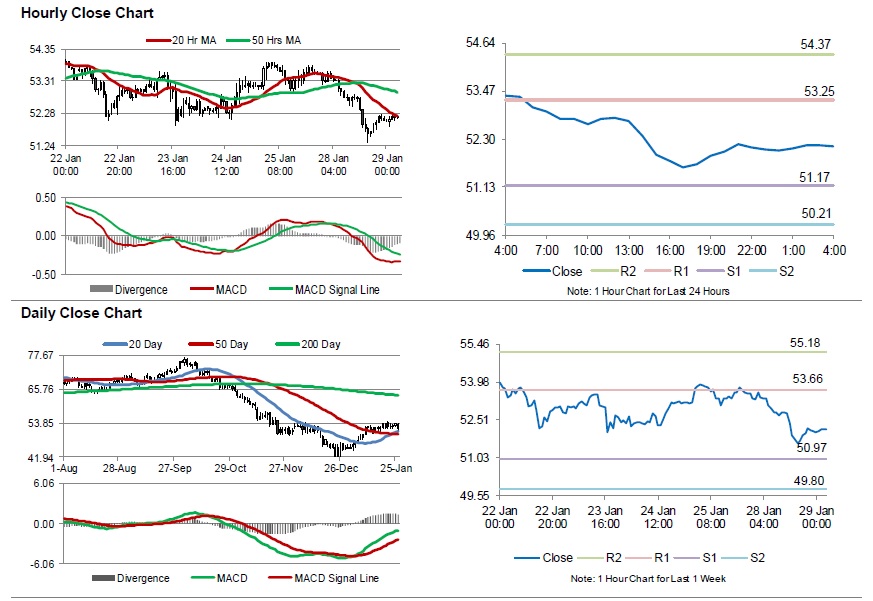
For the 24 hours to 23:00 GMT, Crude Oil declined 2.53% against the USD and closed at USD52.05 per barrel, amid mounting concerns over global growth.
In the Asian session, at GMT0400, the pair is trading at 52.13, with oil trading 0.15% higher against the USD from yesterday's close.
The pair is expected to find support at 51.17, and a fall through could take it to the next support level of 50.21. The pair is expected to find its first resistance at 53.25, and a rise through could take it to the next resistance level of 54.37.
Moving ahead, investors will keep a close watch on the weekly crude inventories data from the American Petroleum Institute (API), due later in the day.
Crude oil is showing convergence with its 20 Hr moving average and trading below its 50 Hr moving average.
Elliott Wave View Expects Tesla Rally To Fail
Elliott Wave view in Tesla (Ticker: TSLA) suggests the rally to $352.09 ended wave ((2)). This suggests the stock is in an impulsive Elliott Wave structure to the downside. Wave ((3)) is in progress and the subdivision unfolded also as a 5 waves Elliott Wave impulse of lesser degree. Down from $352.09, wave 1 ended at $343.8 and wave 2 ended at $351.5. Wave 3 ended at $281.69, wave 4 ended at $290.61, and wave 5 of ended at $279.28.
The entire move lower from $352.09 to $279.28 ended wave (1) of ((3)). Tesla is now correcting the decline from $352.09 in wave (2). The correction looks to be unfolding as a double three Elliott Wave structure. Up from $279.28, wave W ended at $298.52 and wave X ended at $287.75. The stock has scope to extend higher towards $307.16 – $319.21 area to end wave Y of (2). Afterwards, it should extend to the next leg lower or at least pullback in 3 waves. As far as pivot at $352.09 stays intact during the correction, we expect the rally in Tesla to fail and the stock to extend to the downside.
Tesla 1 Hour Elliott Wave Chart

Market Morning Briefing: Pound Has Tested 1.32
STOCKS
As hoped for, there has been decent profit-taking in Equities across the world, with important Resistances holding across all Indices. More downside seems likely.
Dow (24528.22, -208.98, -0.84%) came down well from below Resistance at 25000, to see a low of 24324. It would be prudent to think of 24000 (at least) in the coming weeks.
The DAX (11210.31, -71.48, -0.63%) has also come down well, after having risen to 11321.62 on Friday. So, with yesterday's fall, the DAX too remains below important Resistance at 11300. Looking at the Weekly Candles, there are equal chances of a dip to 10900 as of a further rally to 11500. Possibly the downside might be more probable.
Both Nikkei (20448) and Shanghai (2571) have dipped yesterday and have fallen further today, as the crucial resistances at 21000 and 2660 (21-MA on Weekly Candle Chart) respectively are holding strong. Look for a dip to 20400 and 2550 respectively in the near term, possibly lower also.
In line with expectation, both Sensex (35656.70, -368.84, -1.02%) and Nifty (10661.55, -119.00, -1.10%) have fallen to 35600 and 10670. Trading just above the support coming from October-2018, they could possibly produce a bounce back towards 35800 and 10800. If not, both indices could be further bearish towards 35000 and 10500 respectively in the medium term.
COMMODITIES
Overall the commodities are mixed. The crude prices have dropped sharply while the metals are stable.
Crude demand has picked up this month in China as news states buying for March-April delivery while purchases for Jan-Feb remains low. Brent and WTI saw a sharp fall and is trading lower while our mentioned upside resistances of 64 and 56 holds for now.
Brent (60.01) could come off towards 58 and WTI (52.12) towards 51-50 levels. A small corrective move could be in place for the next few sessions.
Gold (1303.10) and Silver (15.76) are almost stable and holding at higher levels seen yesterday. While Gold is above 1300, scope of testing 1310/20 is in place. Silver has room towards 16.00-16.50. Near germ could be bullish.
Copper (2.6870) came back sharply from levels above 2.70. Below 2.70, copper could re-test 2.65/60.
FOREX
Dollar Index (95.74) could come off to test 95 before bouncing back from there.
Euro (1.1429) could possibly face a small dip from 1.1450 before again attempting to rise further. On the 3-day and weekly charts, Euro looks bullish towards 1.15.
Dollar Yen (109.19) could come off towards 109.00-108.80 levels in the near term while the Dollar index heads towards 95. A short dip looks likely just now within a longer term uptrend.
Pound (1.3148) has tested 1.32 and is coming off from there. While 1.32 holds, Pound could see some corrective dip in the near term towards 1.31-1.30 levels.
Aussie (0.7159) is up today after testing 0.7138 yesterday. A fall in Copper prices (refer to commodities section above) could lead to a fall in Aussie also towards 0.71.
USD-CNY (6.7413) has support near 6.72 and while that holds we could see a bounce in the pair towards 6.75-6.78 levels.
Dollar Rupee (71.11) has immediate support near 70.80/90 and while that holds, Dollar-Rupee could trade in the 70.80-71.25 region over the next 1-2 sessions. Only on a break above 71.25/30, if seen would turn bullish for the medium term.
INTEREST RATES
The German-US 2Yr Spread (-3.17%, down from -3.16%) is moving lower towards its 200-day MA Support near -3.25% while the German-US 10Yr Spread (-2.54%, up from -2.57%) has moved up a bit after testing the 200-day MA Support near -2.57%. We have to watch to see if the mentioned 200-day MA Supports continue to hold over the course of this week.
On the US Yield Curve, the 1-5 year section of the Curve is inverted, with the 1Yr (2.59%) > 2Yr (2.58%) > 5 Yr (2.57%). At the Far end, the 30-5 Spread (0.49%) and 30-10 Spread (0.32%) have Resistances near current levels. This suggests that the 30Yr (3.06%) can slowly come down towardxs 3.00%.
The Indo-US 10Yr Spread (4.79%) is trading near its 200-day Moving Average at current level and may have room to slowly move up towards 4.90%. Else, it could trade sideways near current levels. Let us see how that goes.
Asian update: Stocks follow US lower, Sterling soft ahead of Brexit votes
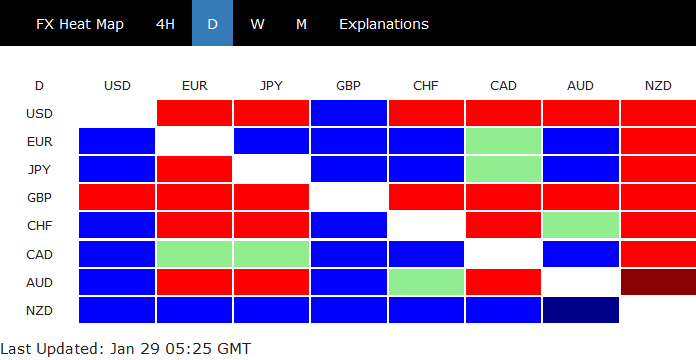
The forex markets remain relatively quiet today. Yen was lifted overnight by risk aversion as all major indices closed in red. Asian markets followed by opening down. But gain in the Yen are so far very limited. Even USD/JPY is still holding on to 109.14 minor support.
As for today, New Zealand Dollar is the strongest one after trade surplus came in larger than expected in December. Australian Dollar shrugs off sharp deterioration in NAB Business Conditions, which just had the largest monthly decline since global financial crisis. Sterling is the weakest one as traders await Brexit debate in the commons, and vote on plan B as well as amendments. Dollar is second weakest with eyes on US-China trade negotiations.
In Asia:
- Nikkei is down -0.24%.
- Hong Kong HSI is down -0.45%.
- China Shanghai SSE is down -0.49%.
- Singapore Strati Times is down -0.58%.
- Japan 10-year JGB yield is up 0.0032 at 0.003, turned positive.
Overnight:
- DOW dropped -0.84%.
- S&P 500 dropped -0.78%.
- NASDAQ dropped -1.11%.
- 10-year yield closed down -0.009 at 2.744.
Australian NAB business conditions: Largest fall since global financial crisis
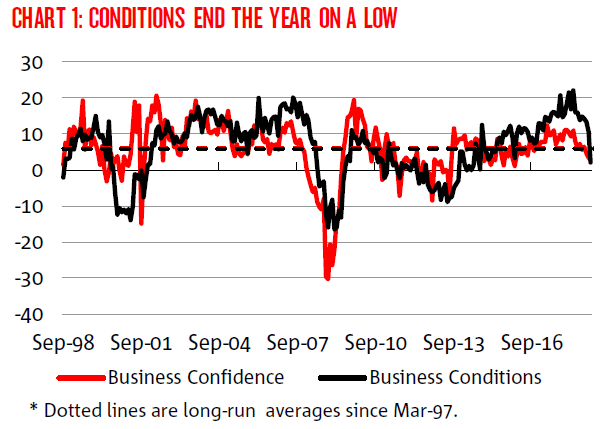
Australia NAB Business Confidence was unchanged at 3 in December. However, Business Conditions dropped sharply by -9 pts from 11 to 2. That's the largest monthly fall since the global financial crisis. And the deterioration was "relatively broad-based across states and industries".
NAB also noted that "at face value, the fall over the past 6 months suggests a significant slowing in the momentum of activity in the business sector – especially from the highs seen earlier in the year."
Australia Business Conditions Collapse: A ‘False Read’ or a Watershed Moment
Aust: business conditions & confidence, December. Conditions collapse, a ‘false read’ or a watershed moment? Conditions: down 9pts to +2. Confidence: unchanged at +3.
The NAB business survey for December is a headline grabber. Business conditions have collapsed, with the largest monthly fall since the GFC. Declines were broad-based across states and industries.
The business conditions index fell by 9pts to be at +2, a below average reading (for the monthly survey, dating from March 1997). Conditions are down sharply from the first half of 2018, when the index averaged +18.
This is the softest reading since September 2014, prior to the recent strong housing upswing gathering a head of steam.
Business confidence was steady at +3, a below average reading, down from +9 on average in the first half of 2018.
The key question - is the December update a ‘false read’ or a watershed moment?
The survey was conducted from January 8 to 14. (Typically the survey is conducted in the final week of the month but that’s not feasible for December.)
As always, caution should be taken when interpreting data over this period - with most still on holidays data can be particularly volatile at this time of year.
At face value, the fall in business conditions over the second half of 2018 suggests a significant slowing in the economy.
If the December update is accurately describing conditions across the Australian economy then this is a watershed moment. For policy makers, economic growth forecasts of 3% plus would need to be marked materially lower.
The turnaround in the housing sector is a key development. New home building activity has swung from strong gains over the first half of 2018 to declines in Q3 and beyond.
Dwelling prices in Sydney and Melbourne have pulled-back, following sizeable gains, and consumer sentiment slipped into the pessimistic zone in January (just, at 99.6).
The global economy lost momentum during 2018 with trade slowing and uncertainty increasing. However, a plus is that some key commodity prices (eg iron ore) remain elevated.
Business conditions detail for December are: trading conditions down by 8pts to +7; profitability also down 8pts to 0; while employment fell by 5pts to +4.
The survey suggests that the employment index is consistent with jobs growth, near-term, at a still solid 18k per month. However, we’d note that if business conditions do settle at around +2 then the employment index is likely to soften.
Forward orders weakened further, down 1pt to -1. The capacity utilisation rate - having strengthened over recent years - was still at an above average reading, albeit moderating somewhat during 2018.
By industry, conditions in retail plunged in December (to -15), moderated in recreation & personal (to +8) and slumped over the past two months in the previously strong sectors of construction (to 0) and manufacturing (to -1). It may be that firms were slower than usual with sending through new orders over the holiday period.
By state, business conditions have moderated significantly across the mainland, with December readings of: NSW and Victoria, +5; Qld, +1; WA, -2; and SA, -16.
Japan cabinet office downgraded exports assessment to weakened recently
Japan Cabinet Office left overall economic assessment unchanged and said it's in gradual recovery. However, export assessment was downgraded from "flattened" to "weakened recently". In particular, shipments of electronics and semiconductor manufacturing equipment to China have slowed sharply.
The office noted in the monthly report that "we need to keep in mind that there is uncertainty about how trade disputes and China's economic outlook will affect the global economy."
On inflation, the report noted that consumer prices have leveled off. It's another downgrade from last month's description that gains were slowing. Consumer spending was recovering while capital expenditure was increasing. Both assessments were unchanged.
US Mnuchin: IP protection, forced JVs & enforcement top on agenda in China trade talks
US Treasury Secretary Steven Mnuchin said yesterday that "IP (intellectual property) protection, no more forced joint ventures, and enforcement are three of the most important issues on the agenda" in trade negotiation with China.
He emphasized that "we want to make sure that when we get a deal, that deal will be enforced." Though, he also admitted "The details of how we do that are very complicated. That needs to be negotiated. "
Mnuchin, a relative trade dove, also said there had been "significant movement" in the trade talks so far. And he expected this week's meetings to end with significant progress.
China's Xinhua news agency reported that a Chinese delegation led by Vice Premier Liu He arrived in Washington yesterday, for the meeting with US Trade Representative Robert Lighthizer. PBoC Governor Yi Gang is expected to join the meeting too. On the US side, Lighthizer will lead the talks with participation from Mnuchin, Commerce Secretary Wilbur Ross, White House economic adviser Larry Kudlow and White House trade and manufacturing adviser Peter Navarro.
GBP/USD Remains In Significant Uptrend
Key Highlights
- The British Pound climbed higher recently and settled above the 1.3000 pivot against the US Dollar.
- There is a major bullish trend line in place with support at 1.3070 on the 4-hours chart of GBP/USD.
- The Chicago Fed National Activity Index (CFNAI) increased from 0.21 to 0.27 in Dec 2018.
- Today in the US, the Consumer Confidence for Jan 2019 will be released, which could decline from 128.1 to 124.0.
GBPUSD Technical Analysis
This past week, the British Pound started a solid upward move and broke the key 1.3000 barrier against the US Dollar. The GBP/USD pair surpassed the 1.3080 and 1.3120 resistance levels to move into a bullish zone.
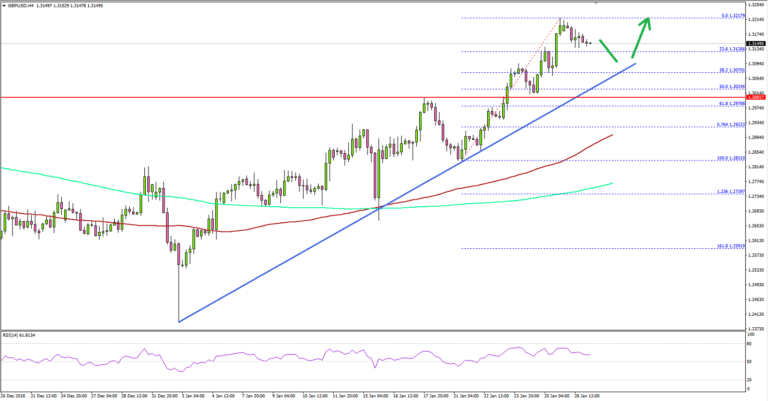
Looking at the 4-hours chart, the pair even traded above the 1.3200 level and settled well above the 100 simple moving average (red, 4-hours). A new yearly high was formed at 1.3217 and the pair later started a downside correction.
It declined below the 1.3150 level, but there are many supports near the 1.3080 level and the 38.2% Fib retracement level of the recent wave from the 1.2831 low to 1.3217 high.
Moreover, there is a major bullish trend line in place with support at 1.3070 on the same chart. If there is a break below the trend line, the pair may test the 1.3020 support and the 50% Fib retracement level of the recent wave from the 1.2831 low to 1.3217 high.
On the upside, an initial hurdle is near the 1.3200 area, above which there are chances of more gains towards the 1.3320 level. On the flip side, a daily close below the 1.3000 handle may push the pair back in a bearish zone.
Overall, GBP/USD remains well supported on dips near the 1.3080 level. There could be range moves in the short term, but later the pair could continue to move towards 1.3320.
Economic Releases to Watch Today
- S&P/Case-Shiller Home Price Indices for Nov 2018 (YoY) – Forecast +5%, versus +5% previous.
- US Consumer Confidence Jan 2019 – Forecast 124.0, versus 128.1 previous.