

Sample Category Title
Daily Markets Broadcast
Wall Street slides on disappointing corporate earnings
Wall Street indices were under pressure for most of Monday’s session as a few bellwether heavyweights announced disappointing results. UK shares closed under pressure ahead of today’s parliamentary Brexit deal vote.
US30USD Daily Chart
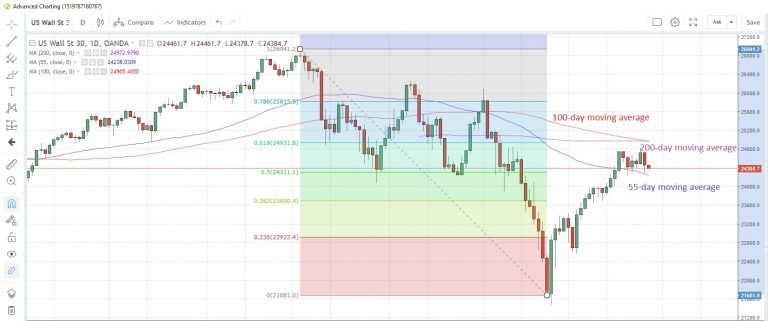
Nvidia and Caterpillar were among the disappointing news bearers yesterday, pressuring stocks at the start of the week
The index is holding above the 55-day moving average at 24,238. The convergence of the 100- and 200-day moving averages at 24,965 and 24,972, respectively, caps for now. The 100-day average moved below the 200-day for the first time since August 17
White House economic adviser Kudlow still thinks economy is very strong; says GDP report will likely be out next week (delayed due to shutdown). Trump’s State of the Union address is confirmed for February 5.
DE30EUR Daily Chart
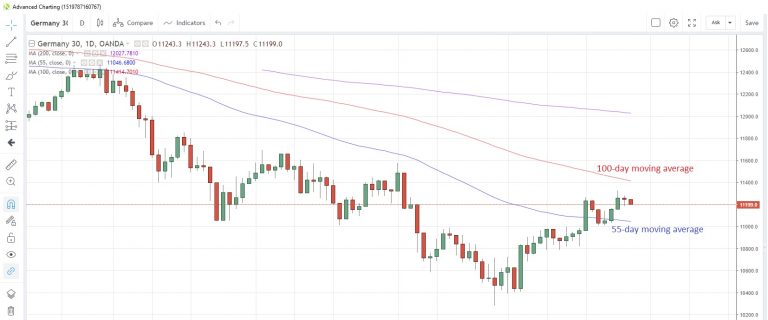
The Germany30 index edged lower yesterday, snapping a three-day winning streak, after ECB’s Draghi commented that recent data had been weaker than expected
The index is sandwiched between 55-day moving average support at 11,046 and 100-day moving average resistance at 11,415
Euro-zone M3 money supply rose 4.1% y/y in December, more than expected, according to data released yesterday.
UK100GBP Daily Chart
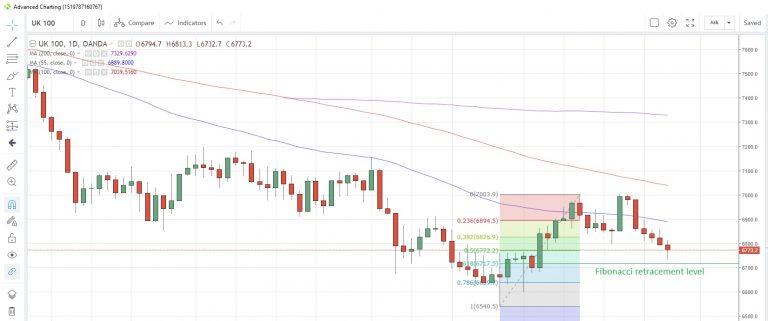
The UK100 index dropped to its lowest in 3-1/2 weeks yesterday amid uncertainty surrounding today’s parliamentary Brexit deal vote
The index is holding above the 61.8% Fibonacci retracement level of the December 27 to January 11 advance at 6,717.5
UK Parliament debates and votes on PM May’s Brexit Plan B later today. A govt spokesman said that the UK will be leaving the EU on March 29; is committed to leaving with a deal. A “no deal” result could hurt the index.
Global Growth Anxiety And Brexit Vote Guide Market
EUR – Euro Rises on Soft Dollar
CAD – Loonie Lower on Soft China Data
GBP – Brexit Jitters Hit Pound Ahead of Vote
GOLD – Gold Rises awaiting Cautious Fed
OIL – Lower Global Growth and Higher Rig Counts Pressure Crude
The US dollar is mixed against mayor pairs on Monday. The safe havens are trending higher with the yen and Swiss franc gaining, joining the club is the euro as investors look to reduce their US dollar exposures as US political uncertainty rises.
The U.S. Federal Reserve is not expected to modify its monetary policy at the end of the 2-day FOMC meeting, but the press conference with Chair Powell will be tracked closely for any insights after several members have openly discussed pausing the path of rising interest rate hikes.
The Fed signalled on Friday that it could slow down the balance sheet reduction program put in place to keep tightening monetary policy adding to the factors putting pressure on the US dollar.
The currency has been sold after President Trump reached a deal to reopen the Federal government. Washington will continue to operate amidst political uncertainty with the discussed agreement only valid until February 15 when a new shutdown could occur if Democrats and the GOP don’t reach a deal on the border wall.
EUR – Euro Rises on Soft Dollar Despite Dovish ECB
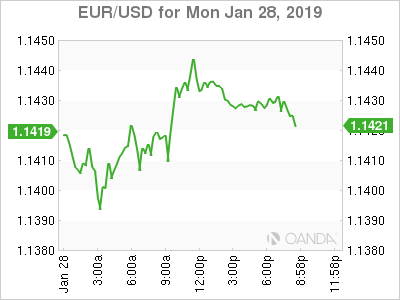
The EUR/USD rose 0.25 percent on Monday. The single currency is trading at 1.1435 as investors sold the dollar searching for higher yields.
Political uncertainty in Washington kept investors from flocking to the US dollar ahead of the weekend and the dovish expectations on the FOMC meeting are not giving any support to the greenback.
The CME FedWatch tool shows the market is forecasting a 99.5 percent probability that the Fed funds rate remains unchanged at 225–250 basis points range.
The currency rose last year as geopolitical factors and the support of the central bank’s efforts to normalize interest rates.
The Fed had tightened monetary policy by raising rates, but also by unwinding the massive balance sheet it had accumulated as part of its quantitative easing program. Friday’s report in the WSJ about a possible end or long-term pause to the balance sheet reduction was a positive for the stock market, but a negative to the US dollar.
The dollar is not attracting investors as a safe haven. US-China trade concerns remain, but they are moving to the background as negotiators begin. The uncertainty on the US shutdown lessened with a short-term agreement and the Fed is to take center stage with dovish expectations from the market.
The US U.S. non-farm payrolls (NFP) report is expected to keep showing that American employment is solid.
CAD – Loonie Lower on Soft China Data
The Canadian dollar fell 0.32 percent on Monday. The USD/CAD is trading at 1.3254 as lower oil prices hit the loonie. The commodity currency also got hit by lower industrial data out of China.
The US-China trade war has started hitting revenue targets around the globe. Growth forecasts have been cut as teams from the two nations meet in Washington with little chance of a successful agreement.
Canadian economic data this week will provide little support for the currency as this week’s calendar only features the monthly GDP data and raw materials price index, due on Thursday.
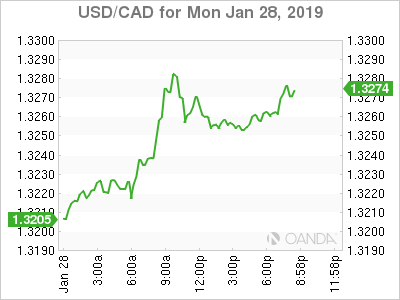
The US dollar sentiment could worsen as political events take the spotlight, but for now the market is showing a lack of confidence in the Canadian economy as headwinds increase.
GBP – Brexit Jitters Hit Pound Ahead of Vote
The pound lost 0.30 percent on Monday. The GBP/USD is trading at 1.3160 as the anticipated second Brexit vote is in the horizon.
Investors had low expectations on the first vote, which was lost in spectacular fashion but since then the efforts to minimize the no-deal scenario had appreciated the pound.
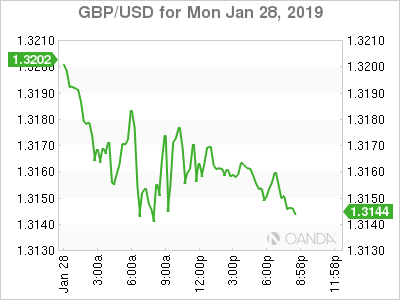
The currency is giving some of those gains back as investors take profits and confidence begins to wane on what the actual plan B will look like. A failure this time around will be a harder hit for the currency and put a no-deal exit back on the table.
The British parliament voted down the deal but is still divided on what it does support and what eventually might pass lawmakers in the UK, might not be the deal Europe agreed, which puts things back to square one, with a fast-approaching deadline. That is why the no-deal option is back in play.
GOLD – Gold Rises awaiting Cautious Fed
Gold rose 0.3 percent on Monday. The yellow metal is rising as the Fed is heavily anticipated to hit the pause button on monetary policy tightening.
The January Federal Open Market Committee (FOMC) meeting was intended to be a low-key event, after the rate hike in December of 2018. The equity market sell off and the political attacks on the central bank from the White House have put the Fed on the defensive. Chair Jerome Powell is all for transparency, and this year a press conference will follow every meeting.
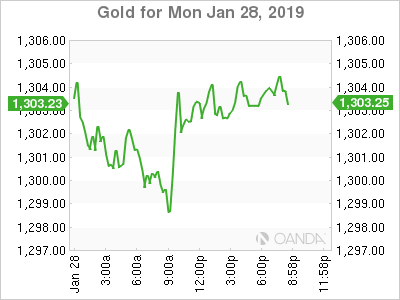
Gold was caught in a familiar range last week, with limited details on global macro risk events. Friday’s report of the Fed holding on to more Treasuries than originally intended ahead of a FOMC meeting where no change to the Fed funds rate is expected and a dovish Powell put downward pressure on the dollar.
The yellow metal will continue to be an option for investors if volatility rises during the week on any development from Brexit, Venezuela and the US-China trade war.
US economic indicators schedule this week could also keep gold from rising next week. US employment and manufacturing data remain solid and could boost the greenback but given the US shutdown the indicators could miss forecast due to incomplete data.
OIL – Lower Global Growth and Higher Rig Counts Pressure Crude
Energy prices fell close to 3 percent on Monday. West Texas Intermediate dropped 3.41 percent and Brent 2.97 percent as lower demand impacted by falling global growth forecasts.
Rising supplies continue to put downward pressure on crude prices despite the efforts of the Organization of the Petroleum Exporting Countries (OPEC) and other major producers to limit production.
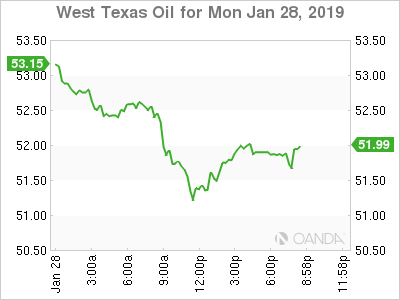
Rising US output and the possible European bypass of US sanctions on Iranian crude offset any disruptions caused by the political situation in Venezuela.
Oil supplies have remained untouched since the US backed an interim president over Nicolas Maduro. US refineries would scramble to find a replacement for their heavy grade imports causing a spike in short term demand if sanctions on either side of the dispute are put in place.
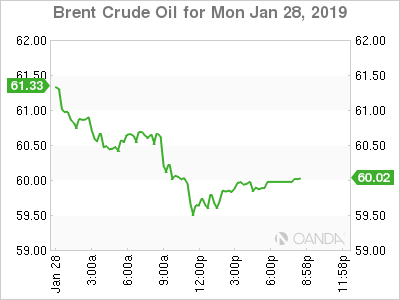
Soft industrial data in China and the United States put downward pressure on energy prices as demand is seen lower.
The OPEC agreement to limit output has stabilized prices, but energy is still sensitive to higher crude output from the United States and downgrades in global growth due to higher tariffs to international trade.
Gold Above $1300 After Truce Reached Over Shutdown
Gold prices are almost unchanged on Monday, after the metal posted strong gains to end the week. In the North American trade, the spot price for one ounce of gold is $1303.08, unchanged on the day. In economic news, there are no U.S. events on the schedule. On Tuesday, the key U.S. release is CB Consumer Confidence.
The U.S. dollar retreated on Friday, after a breakthrough in the U.S. government shutdown crisis. President Trump agreed to reopen government services for a 3-week period, even though he did not receive any funds for his border wall with Mexico. Trump and Congress have been deadlocked over funding for a border wall, but Trump agreed to the temporary measure without securing any funding for his wall. Risk sentiment jumped, as investors are optimistic that the temporary deal will lead to an agreement which resolves the shutdown. Gold took full advantage of the dollar’s weakness, jumping 1.75% and hitting its highest level since early June.
The U.S labor market continues to impress the markets. as unemployment claims dropped sharply, from 213 thousand to 199 thousand. This was the first time that the indicator dropped below the 200-thousand level since 1969. The four-week average, which is less volatile, dropped by 5.5 thousand to 215,000. The strong figures indicate that the employment picture remains bright, despite the ongoing U.S. government shutdown, which has resulted in the layoff of some 800,000 government workers.
Eco Data 1/29/19
[php_everywhere instance="1"]
WTI crude oil breaks 52, reversing recent rebound, CAD pressured
At the time of writing, Canadian Dollar is the worst performing major currency for today, as dragged down by oil prices. Yen is the strongest ones as Caterpillar and Nvidia warnings punish US stocks. At the time of writing, all DOW, S&P 500 and NASDAQ are down more than -1%.
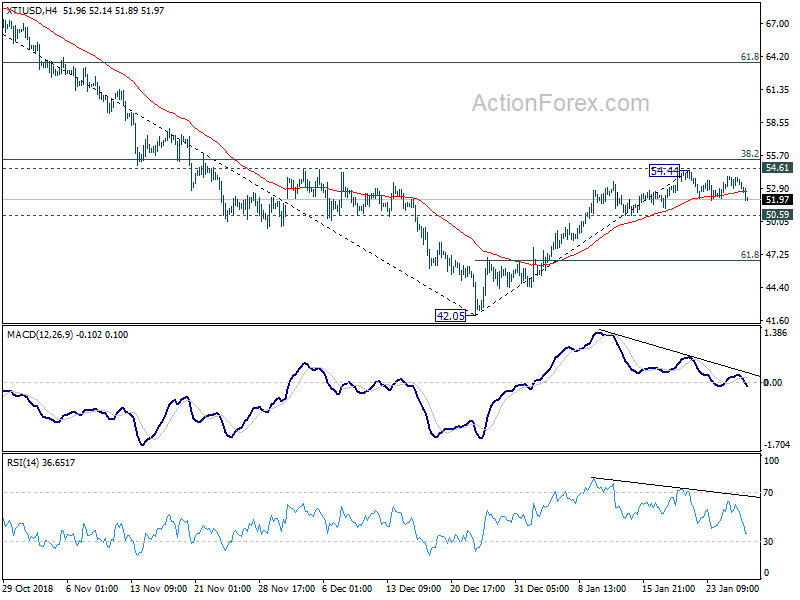
WTI crude oil is back pressing 52 handle and takes our 4 hour 55 EMA. The development affirmed the case that corrective rebound from 42.05 has completed at 54.44, on bearish divergence condition in 4 hour MACD. It also faced rejection from 54.61 resistance, 55 day EMA and below 38.2% retracement of 77.06 to 42.05 at 55.42.
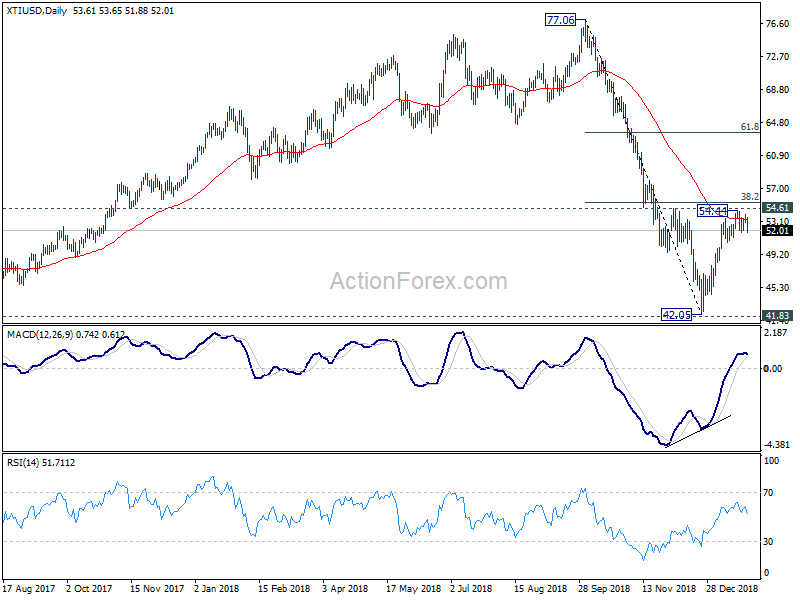
Focus is now back on 50.59 support, decisive break there will confirm and will bring deeper pull back to 61.8% retracement of 42.05 to 54.44 at 46.78. Nevertheless, defending 50.59 will maintain near term bullishness for another rise through above mentioned resistance zone of 54.61/55.42.
EU Weyand: No Brexit renegotiation, no time-limit of backstop, just margin on political declaration
EU deputy chief negotiator Sabine Weyand reiterated that "there will be no more negotiations on the Withdrawal Agreement". And given just 60 days from the March 29 Brexit date, time is already tight to complete the ratification of the treaty. However, she also pointed out "where we do have margin is on the political declaration". But she also emphasized that "we need decisions on the UK side on the direction of travel."
Also, Weyand echoed chief negotiator Michel Barnier's comments regarding Irish backstop. She said "a time-limit on the backstop defeats the purpose of the backstop because it means that once the backstop expires you stand there with no solution for this border."
Japanese Yen Edges Higher as Japanese Inflation Within Expectations
USD/JPY has started the week with slight gains. In Monday’s North American session, the pair is trading at 109.28, down 0.25% on the day. On the release front, the Bank of Japan released the minutes of the December policy meeting. Japanese SPPI edged lower to 1.1%, shy of the estimate of 1.2%. There are no U.S. events on the schedule. On Tuesday, the U.S. releases CB Consumer Confidence and Japan publishes retail sales.
On Thursday, there was a surprise breakthrough in the U.S. shutdown, the longest ever. President Trump agreed to reopen government services for a 3-week period, even though he did not receive any funds for his border wall with Mexico. Risk sentiment has jumped, as investors are optimistic that the temporary deal will lead to an agreement which resolves the shutdown. The U.S. dollar was broadly lower on Friday, but the safe-haven yen was unable to make any inroads against the greenback.
The BoJ has no plans to change course on monetary policy, and this was underscored in the minutes from the BoJ policy meeting in December. Policymakers stated that the bank would would its ultra-accommodative policy “for an extended period of time”. There was concern about the Chinese slowdown and the negative impact it could have on the Japanese economy. Other members expressed concern over weak inflation, which remains well below the bank’s inflation target of around 2 percent. The U.S.-China trade war has weighed on Japan’s economy, and if the crisis continues, the economy could tip into recession. The key export sector is hurting, as exports fell in December to their lowest level in two years.
Canada Filling China-U.S. Trade War Gaps? Don’t Count On It
Highlights
- U.S.-China trade tensions remain elevated, and we continue to march towards the March 1st deadline for agreement before a U.S.-threatened broadening of tariff measures (and likely Chinese response).
- It is tempting to see these tensions as an opportunity for Canadian firms to expand their export sales and recapture market share both in the U.S. and China. Many clients have inquired along these lines.
- The reality is less positive. Sectoral scarring in the form of lost market share and reduced capacity suggests little near-term upside. Canada generally doesn't have suitable substitutes or export capacity in key trade areas at present.
- There are some bright spots. There is early evidence that the provisional agreement with the European Union has accelerated trade. The Trans-Pacific Partnership also came into effect at the end of 2018, creating opportunities in a number of large and fast growing markets.
- Moreover, a still healthy U.S. economy augurs well for modest export growth going forward, which we expect will be accompanied by capacity-expanding investments.
- Ultimately, there is no silver bullet for accelerating trade, with increased competitiveness, seeking new markets and reducing barriers still the best recipe for longer-term success.
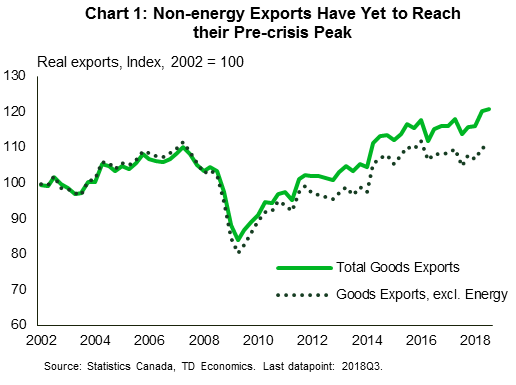
Canada continues to face headwinds both domestic and international, but has at the same time enjoyed some 'wins' of late when it comes to international trade agreements. The Canada U.S. Mexico Agreement (CUSMA) may not be a game changer, and US politics suggests it may take some time before it comes into effect. But its expected ratification nevertheless provides some much needed certainty to Canadian exporters. Perhaps lost in the CUSMA hubbub was the one year anniversary this past September of the Comprehensive Economic and Trade Agreement (CETA) taking provisional effect, opening up trade with one of the world's largest economic blocs. And the Comprehensive and Progressive Agreement for Trans-Pacific Partnership (CP-TPP) recently came into effect with six of eleven signatories ratifying the deal. The benefits of new trade arrangements typically take time to bear fruit. So far, there has been an encouraging uptrend in exports to countries other than the U.S., although the importance of the U.S. means we've seen little overall progress when it comes to non-energy exports; trade volumes remain below pre-crisis peaks (Chart 1).
Regarding the near-term export outlook, all eyes remain on the US and China, who remain at loggerheads over their trading relationship. President Trump has repeatedly threatened to impose tariffs on the full spectrum of U.S. imports from China (currently, roughly US$200 billion of trade is subject to tariffs). As of writing, the 'deadline' for an agreement before additional tariffs are imposed is March 1st, 2019, which doesn't leave a lot of runway for negotiations. There has been some reported progress in negotiations with the next round of discussions slated for January 30th. But if the talks ultimately go sideways and the US follows through with more tariff hikes, China would undoubtedly respond through increased tariff and non-tariff trade barriers.
With this sword hanging over the global economy, we have been asked what the implications of such an outcome would be for Canada. Clearly, Canadian exports in general would feel significant knock-on effects if a worsening trade war further hit global trade and financial market sentiment. Still, another question emerges: could Canadian exporters reap some benefits from falling demand in the US (China) market from more expensive Chinese (US) goods?
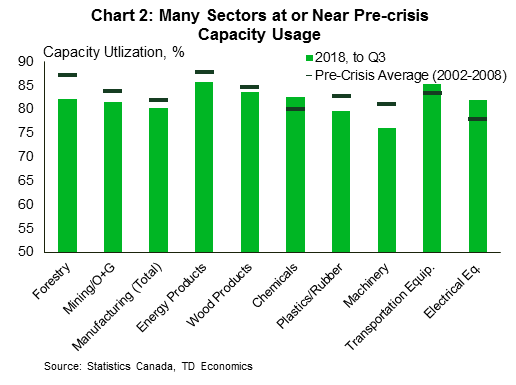
This analysis suggests that the answer to this question is no or limited at best. First, Canadian trade flows and production patterns have evolved along markedly different lines than those in both the US and China, suggesting little in the way of product substitutes. Canadian firms have lost significant U.S. market share in the categories that China dominates. In China, outside of energy products, the same story holds true. Second, Canadian manufacturing has undergone a prolonged period of adjustment, with capital stock and employment significantly below pre-crisis averages. This leaves firms operating at or near capacity with little room to expand output quickly (Chart 2). This lack of 'spin-up' capacity, is likely related to China's ascent in U.S. imports, sapping Canadian market share (Chart 3). Finally, although service exports have been and should continue to be a higher growth area for the Canadian economy, there is little reason to expect acceleration. In contrast to goods, China's market penetration has been more modest, limited the upside, and Canadian firms will continue to face off with those in low cost jurisdictions such as India, which has rapidly gained market share in recent years. In this vein, with few offsetting benefits in store a further escalation in the trade war between the US and Canada only represents downside to Canada's economy.
On a happier note, we still see a good possibility that further tariff hikes will be avoided, and the latest TD Economics forecast still seeing a solid path for exports on the back of continued US expansion. The takeaway from this report is not to emphasize the downside risks, but rather the lack of upsides.
Canada not always a substitute
At least so far, despite the imposition of US tariffs on Chinese goods, the opportunities for Canadian export substitution within the US market have proven limited. This is because the tariffs already implemented have occurred alongside a devaluation of the Chinese currency, thus preserving Chinese price competitiveness. Thus, Canada's potential to fill any export gap that is created going forward will depend in large part by the future direction of the renminbi.1
In any event, a look into the rear view mirror both underscores the potential opportunities that could be created due to China's large and rising presence over time in the U.S. marketplace but also underscores the challenges that Canadian exporters might face in meeting that demand. The rise of China as a global manufacturing power has been a long time in the making, but the process accelerated notably following China's accession to the World Trade Organization (WTO) late in 2001. This impact is best illustrated by the changes in China's shares of U.S. product categories. Looking at the top 11 categories, representing 80% of U.S. imports by value, China has rapidly grown its share of the U.S. market since 2002, growing share by more than 20 percentage points in several categories (Chart 3).
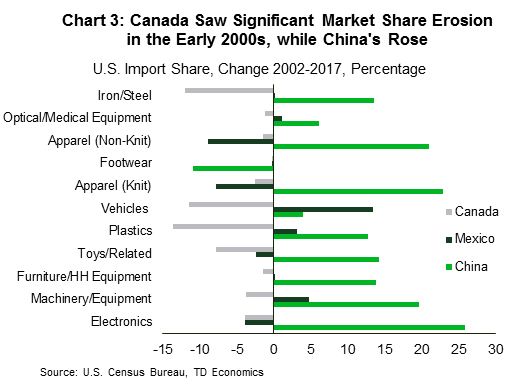
By contrast, although a growing pie means that Canadian export sales in many of these categories did rise over this time, Canadian firms failed to capture a larger share of the market across all 11 categories.2 Indeed, while Chart 3 highlights the top categories for imports from China, Canada's share of overall U.S. goods imports (including energy) is down six percentage points over the same period. Recent dynamics do not suggest any immediate change in shares/trade patterns. To be sure, there is more to the story. As noted, Canada has seen significant growth in energy exports to the U.S., and although shipments of motor vehicles and parts have been effectively flat over the past five years, they still represent a sizeable share of Canada-U.S. trade. In some other export areas, such as raw and processed food, as well as base metals and other industrial inputs, China remains a minor player in the U.S. market, while Canada has enjoyed generally rising exports.
Less capacity means less ability to meet demand quickly
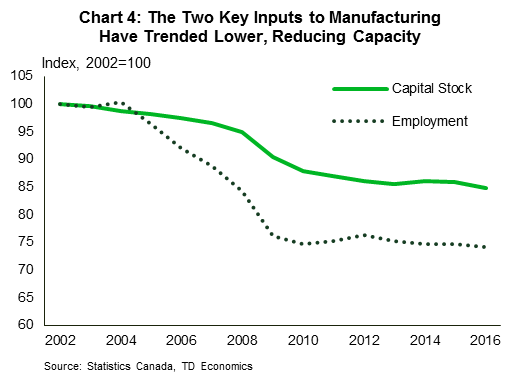
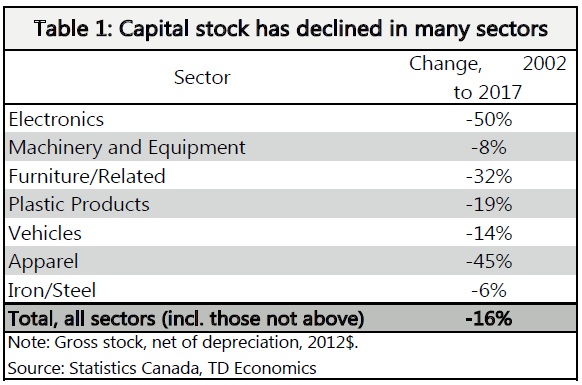
The soft performance of manufacturing sales has had a logical result: a decline in the capital stock of the industry. After all, if you're selling less of something year after year, why go through the expense of maintaining excess capacity beyond that needed to respond to typical demand fluctuations. The outcome of this logic can be seen in the data: total capital stock in manufacturing has fallen by about 15% since 2002 (Chart 4).3 Unsurprisingly, employment in the sector has followed suit, more than 25% below the 2002 level as of 2016.
Again, differences between U.S. trade definitions and the classification of manufacturing sectors makes an apples-to-apples comparison challenging, but the dynamics again match those of trade (Table 1). The real levels of capital stock of key China-exposed product manufacturing categories are all markedly lower since 2002.4
This suggests that the 'denominator effect' helps explain why manufacturing capacity utilization remains roughly in line with its pre-crisis levels despite a sales trend that has been effectively flat. Even with flat sales, shrinking capacity (the denominator in the equation capacity utilization equals sales divided by sales capacity) means you are using more and more of it to satisfy demand, pushing measured utilization rates higher.
To be clear, this trend does have a silver lining in that at some point capacity will become stretched, necessitating further investment. This is one of the key reasons why TD Economics remains constructive on the outlook for Canadian business investment in coming years. But investment doesn't turn on a dime. Getting from the 'go ahead' decision to an operational production line or sales office can often be a matter of quarters, if not years. This means that in practice, unless firms see trade conflicts as lasting for many years, they are unlikely to meaningfully adjust production patterns to react.
Services unlikely to be the saviour
Is a focus on goods trade the right approach to take? The falling inputs in the manufacturing sector shown in Chart 3 are likely a reflection of a changing Canadian economy. Service industries now make up more than 70% of Canadian output, and service export growth has outpaced goods over the past decade.5 As with goods, caution is again warranted, with service exporters unlikely to see significant growth opportunities.
To begin with, China is not as significant a player in the U.S. service import market. Although Chinese firms have increased their share of the pie by about a percentage point over the last 15 years, they still represent less than 4% of U.S. service imports. This may be part of the reason the U.S. administration has so far focused largely on goods. Beyond the small size of addressable Chinese market share, Canada faces challenges from elsewhere. The decline of Canadian market share (about 2.1 percentage points since 2002 even as the dollar value of exports more than doubled) is largely a story of India's ascension.
However, even here a note of caution is warranted. Looking at the U.S. market, Canadian services have lost market share since 2002, falling from 8.2% of U.S. service imports to 6.1% in 2017, even as the dollar value of exports more than doubled. Indian service exports to the U.S. have gone from roughly one-tenth the size of Canada's to nearly 90% in value, driving a 4.4 percentage point gain in market share.
The takeaway isn't all negative; after all, despite these developments Canadian service exports have still managed to outpace goods. Data on service sector capacity utilization is not readily available, but employment patterns and other available data suggest that firms have continued to scale up capacity, pointing to further growth going forward. However, absent fundamental shifts in the sector, such as new/unique products, increased cost competitiveness, or another change, business as usual appears most likely, even in the event of disruptions to Chinese service provisions.6
Not just the U.S.; are there China opportunities?
Trade conflicts are a two way street; the (lack of) opportunities for Canadian firms to take advantage of potential disruptions in China-U.S. trade flows have already been discussed, but the other direction is also a possibility. The rapid growth of the Chinese economy should, all else equal, make it an attractive market for Canadian exporters.7 Indeed, Canadian exports to China have generally outpaced exports to the United States – averaging 6% growth over the past five years, vs. roughly 2% growth in exports to the U.S. (albeit from a much smaller base). This trend should continue given the growth differentials between the two countries, even in light of Chinese deceleration, and relative currency movements have also been favourable.
Could it be accelerated even further in the event of elevated trade tensions? The answer is likely not. Similar to the China-U.S. relationship, U.S. exports to China are by and large in products and categories where Canada would need to undertake significant investment to seize market share. Looking at the products that make up the top 80% of trade, we see many of the same categories discussed in Chart 2, such as electrical machinery, plastic products, optical/medical equipment, etc. Even areas of apparent promise, such as aircraft (the largest U.S. export category to China), or motor vehicles, fade on further inspection. The U.S. aircraft industry produces larger wide-body, long-range products, whereas Canada tends to produce narrow-body, regional craft, and small luxury craft. Similarly, auto exports to China are significant (approx. $1.4bn in 2017), but pale in comparison to the U.S. ($12bn). Much of the (U.S.) exports of autos to China tend to be of large, luxury, American-style SUVs. Again, as well regarded on quality and other metrics as Canada's auto industry is, we simply don't make these types of vehicles at present.8 Canadian exports of energy products to China have picked up of late, but remain below 2012/2013 levels, even accounting for price and exchange rate impacts.
Where opportunities exist is likely to be in the places where Canada has enjoyed rising exports: agricultural products, notably canola/rapeseed, wood and wood products, and similar categories. Canada has a natural advantage in many of these areas, and in some cases, such as wood products, the Chinese market represents an attractive complement to longstanding U.S. destinations. If we look further ahead, energy is another obvious example. The recent uptick is encouraging, but bottlenecks remain. Energy export volumes to China (and Asia more generally) are currently constrained by a lack of export capacity; if resolved, geographic pricing differentials make Canadian energy an attractive proposition for Chinese importers.
In the near term however, we ultimately wind up in much the same place vis-à-vis China as we did with the United States. The possibility of expanding market share is contingent on long-term reinvestment in key industries, with likely to be lengthy lead times before production gets underway. Again, energy sector aside, it is challenging to envision many who would be willing to take this risk given the capricious nature of international trade negotiations under the current U.S. administration.
Soy unlikely to be a big story for Canadian agriculture
Agriculture receives significant attention due to its political sensitivity, and so deserves additional discussion. China has been among the largest purchasers of U.S. soybeans, which are used as feedstock for pork and poultry production. However, with 25% tariffs now imposed on Chinese imports of soy from the U.S., these volumes have plummeted, leaving U.S. producers with significant unsold inventory.
Canada has a large, robust, and highly productive agricultural sector, so it seems logical that this could be area where Canadian farmers could naturally step in to 'fill the gap', particularly as Canada, unlike other major producers, shares a growing season with the U.S., meaning that our supplies would come on market roughly when U.S. supplies would have, fitting the seasonality of production/demand. In the short run however, this would require a shift in planting strategies: of the roughly 28 million hectares of Canadian farmland dedicated to grains and oilseeds for the 2018/19 growing season, only about 10%, or 2.6 million hectares are dedicated to soy (as compared with nearly 36 million hectares of soybean cultivation in the U.S.).
Even then, Canada would face other competitors such as Brazil (albeit with a different growing season), that are already world leaders in soy production and have significant trading relationships with China. On top of this, Chinese authorities have taken steps to reduce their reliance on soybeans, while also making some goodwill efforts regarding the U.S., including a token purchase for their strategic reserve.9
Suffice it to say we shouldn't expect too much from Canadian soybean producers. This is not a story of lost opportunity however. Other crops remain attractive, and there are already growth areas for a number of Canadian products, such as the south Asian market for lentils and pulses, as well as the Chinese market for Canola/rapeseed.10 The other part of the soy story is simply that healthy markets for current production patterns also make soy a less attractive proposition.
Growth areas put at risk by geopolitics
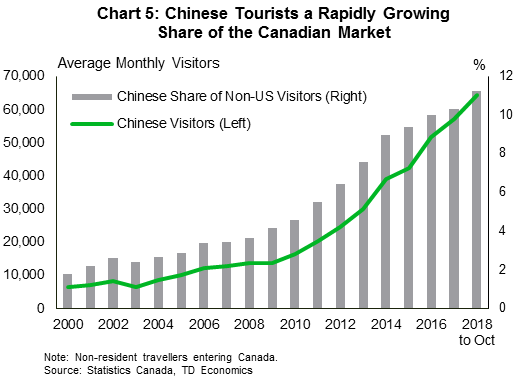
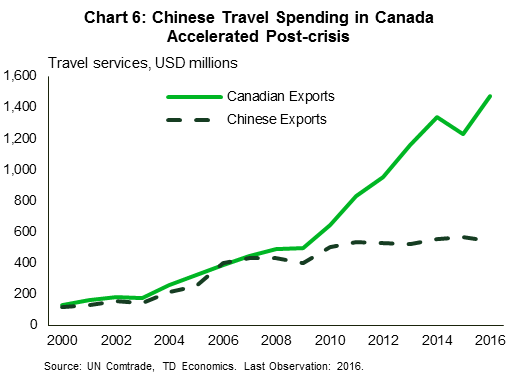
Just as Canadian goods exports to China have outperformed other regions, so too have Canadian service exports. This can largely be put down to travel services, i.e. tourism. Chinese visitors to Canada have more than quintupled since 2002 (Chart 5). The increase in spending has been even more dramatic, reaching more than US$1.5 billion in 2016, the latest year available (Chart 6). While the size of these figures pale in comparison to Canada's overall trade, they are still a source of (diversified) growth.
Recent developments have cast a cloud over this sector. In particular, a recent diplomatic spat has ignited tensions, with both sides issuing travel warnings to citizens, among other actions. It is beyond the scope of this report to get into the politics of the situation, but suffice it to say that further escalation of tensions in this regard would clearly be negative for this sector, along with others that have significant Chinese demand, such as education.
Other opportunities are presenting themselves
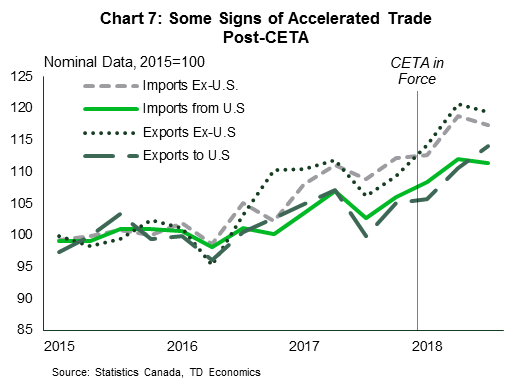
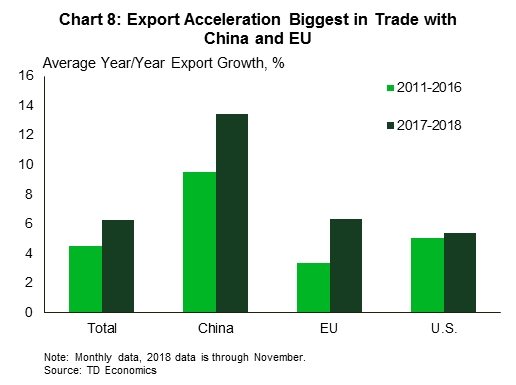
It is not all bad news for Canada. Trade diversification remains a national priority, and both past and current government efforts in this regard are beginning to bear fruit. Late 2017 saw the Comprehensive Economic and Trade Agreement (CETA) enter provisionally into effect, and there is already some early evidence that Canadians are seeing the benefit of better market access abroad and better purchasing power at home (Chart 7). This can be seen most clearly in the export data, where shipments to the EU accelerating markedly of late (Chart 8). The chart also reinforces that even ahead of trade tensions Canada enjoyed strong export demand from China, albeit in different product categories than observed for the United States.
More recently, December 30 marked the introduction into force of the Trans-Pacific Partnership (CP-TPP), which reduces trade barriers with a number of fast-growing economies in the Pacific Rim and South America.11 As with most trade arrangements, we should not expect massive change overnight, but the conditions have been created for a further expansion and broadening of Canadian trade. Most importantly, the multilateral nature of the agreements means that no single member dominates, which implies a predictable backdrop for trade, important for long term business planning.
Bottom Line
The idea of Canadian firms rushing to fill the gaps created by U.S.-China trade tensions is an appealing one, but unfortunately such a scenario appears unlikely. The structure of the Canadian economy and export sector has changed, likely a result of China's ascension in global supply chains. This means that we do not have the capacity to respond quickly to trade opportunities. What's more, any such response is likely to be muted as it would represent a significant 'bet' on a long-term change in policy from a capricious U.S. administration.
Put simply, there are no winners in trade wars, and as recent events have shown, even bystanders can be pulled into the melee. It is not all bad news however, as Canadian exports continue to show signs of diversification, likely to be aided by the CP-TPP. Conditions in the U.S. remain favourable, and we have also seen a solid performance in service exports of late. Ultimately, with no 'easy fix', Canadian firms and policymakers should remain focused on increasing their competiveness, finding new markets, and reducing trade barriers.
End Notes
- Economic theory would suggest that relative prices (i.e. exchange rates) should move to offset tariffs, however, this assumes that exchange rates are market determined, an assumption that does not apply to China at present.
- Energy exports, not shown here as China does compete in this category, are an obvious exception.
- Unfortunately, this data is only available with a significant time delay. Business investment recovered from 2017 following a two year slump, but is unlikely to have meaningfully moved the capital stock.
- Notably bucking this trend are primary metal, non-metal mineral products and petroleum/coal product manufacturers. These are all areas that are largely spared from competition with China in the U.S. market.
- In the decade to 2017, real goods exports have grown at an average pace of 2.0%, while service exports grew 2.6% on average. However, service exports still make up less than 20% of total exports.
- There is another sort of export that bears mentioning: foreign affiliate sales are those that occur in another country, but by a Canadian-controlled firm. This category recently grew larger in size than total goods exports, but represents a change in in a few important ways that are beyond the scope of this report. At a very high level, the income still accrues to Canadians eventually, but timing and form differ, notably as production wages and investment occurs in the foreign jurisdiction.
- It is of course not this simple given the closed nature of the Chinese economy, requirements around joint ventures/technology sharing, etc.
- An exception is Toyota Motor Manufacturing Canada, which manufactures the Lexus RX-series luxury SUV. However, this vehicle is also manufactured at a Japanese facility, likely to pick up any additional demand in the event of further trade tensions.
- There have also been actions taken to reduce the reliance on soy products in Chinese agricultural supply chains, notably an adjustment to protein regulations for animal feed.
- For a more detailed analysis of current planting year conditions and projections, please see Agriculture and Agri-Food Canada's Outlook for Principal Field Crops.
- Specifically Australia, Brunei, Chile, Japan, Malaysia, Mexico, New Zealand, Peru, Singapore, and Vietnam.
Caterpillar and Nvidia Deliver One-Two Punch to US Stocks
Caterpillar and Nvidia news drag stocks down in what could be a pivotal week for stocks. As we approach the midpoint of fourth quarter earnings results, we have seen for the most part upbeat signals from the financials, airlines, and consumer discretionary, however that could change once we see key earning results from the tech sector this week.
Before the bell, Caterpillar delivered poor results, the worst profit miss in almost a decade as higher costs and a China slowdown continue to weigh on the outlook. The soft outlook for the industrial giant, combined with the negative sentiment we heard from various leaders last week in Davos provide a backdrop for softer results from other bellwethers this week.
Nvidia Inc, the largest maker of chips for computer graphic cards decided to cut their guidance, two weeks before their results were due. Nvidia appears to be trying to get out ahead of big earning results from their peers this week, that might show the same story that China is deteriorating worse than expected. Today’s cut is a bad sign for semiconductor stocks as the cut was also attributed to falling datacenter revenue, a part of the business that was expected to be healthy due companies needing technological upgrades and CAPEX money that allotted for the creation of new datacenters.
The Dow Industrial Average fell 1.4% on the poor results from Caterpillar and the Nasdaq dropped 1.6% on Nvidia’s warning. The Japanese yen firmed up today on the risk aversion flows. Tech giant, Apple reports tomorrow, Boeing and Microsoft report on Wednesday, and Amazon reports on Thursday.
Sunset Market Commentary
Markets
Global core bonds were mixed today with German Bunds underperforming US Treasuries. The upward trend in core bonds already halted on Friday and continued today. Asian equity markets closed largely in red with European equities following. There was no economic data on the calendar to steer traders. In today’s risk-off environment, German Bunds failed to profit and moved lower. A series of national debt sales (France, Belgium, Greece and Austria) weighed on bonds too. Investors awaited Draghi’s EP address. He confirmed that the incoming data continued to be weaker and said that the persistence of uncertainties weighed on sentiment. He added that the ECB was ready to adjust all instruments if needed. As EU equity markets continued to slide, the German Bund paired some of its intraday losses. The German yield curve bear steepened with changes varying between +0.2 bps (2-yr) to +2.7 bps (30-yr). Sentiment deteriorated even more caused by disappointed Q4 earnings (Caterpillar, Nvidia). US equities opened substantially lower. Contrary to the German Bunds, US Treasuries were able to profit more from the risk aversion. The US yield curve moved lower with changes in the range of -0.6 bps (2-yr) to -1.4 bps (10-yr).
Trading in the major dollar cross rates was confined to tight ranges today. The dollar is hovering sideways after Friday’s setback. Sentiment on risk turning more cautious probably eased the USD downside momentum. Interest rate differentials moved slightly in the disadvantage of the US currency but it was a factor of only limited significance for USD trading. Speaking before the EU parliament In Brussels, ECB’ Draghi reiterated it cautious assessment in the economy. Markets are hardly reacting. EUR/USD (currently 1.1410/15 area) is trading marginally higher in a daily perspective. USD/JPY hovers in the 109.30 area, near the intraday lows. If anything, tentative USD weakens prevails.
Sterling investors saw the glass half empty again. Last week sterling excelled as investors saw the political debate in the UK evolving towards avoiding a no-deal Brexit, likely with a delay of the march 29 exit day. There is still a decent chance that tomorrow’s Parliamentary vote/amendments will result in a delay of Brexit. However, after last week’s sterling rally, investors have apparently already adapted positions in line with a relatively positive/orderly Brexit scenario. Sterling is falling prey to profit taking. EUR/GBP rebounded to the high 0.86 area after testing the 0.8620 key support last week. Over the next 48 hours sterling might be pushed back and forth by an inflation of political comments in the run-up to the Parliamentary votes.
News Headlines
A strike at a Audi plant in Hungary last week, has gained momentum, the union said. Hungarian workers rebuke the wage gap between Slovak and Polish employees and demand an immediate 18% wage increase. The disruption in supplies caused by the strike has already led to a halt in production at Audi’s home factory in Germany.
Greece’s PM Tsipras is expected to announce an increase in minimum wages, which would be the first in almost a decade. Cutting the minimum wages has been a demand of the country’s lenders at the peak of the sovereign debt crisis to make the labor market more flexible and increase the economy’s competitiveness.
Euro zone M3 money supply increased 4.1% YoY in December vs 3.7% in November. The annual growth rate of loans to the private sector increased 3.4% in December (3.3% in November). Among the private borrowers, loans to households increased at a 3.3% rate, while the growth rate of loans to non-financial corporations stood at 4.0%.