Sample Category Title
USD/JPY Slumps To 109.20
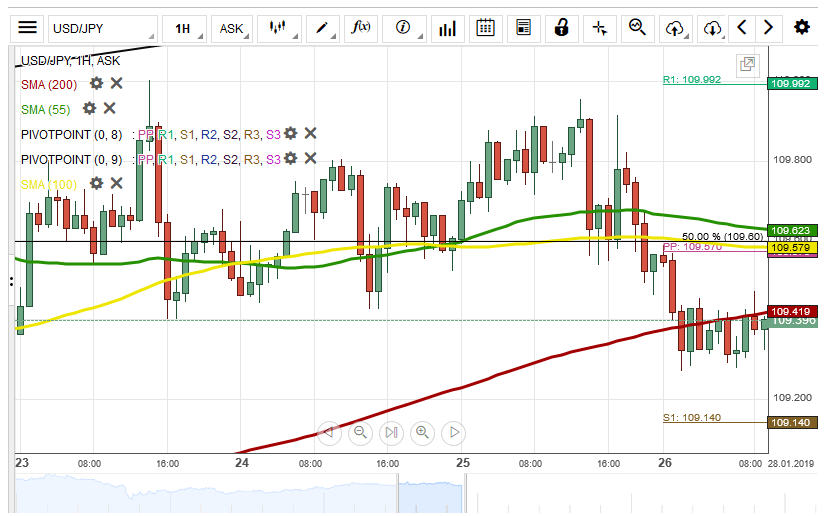
During the previous trading session, the currency exchange rate passed through the support level of the 200-hour simple moving average to end the trading day at 109.25. On Monday morning, the rate was located below the 200-hour SMA at the 109.33 mark.
In regards to the near-term future, most likely, the rate will trade sideways to stay near the weekly S1 at 109.14. Besides, the 200-hour simple moving average will retrace the currency exchange rate during the trading session.
However, the support level of the weekly S1 at 109.14 could push the rate to break the resistance of the 200-hour SMA to trade near the weekly PP at the 109.57 mark.
XAU/USD Appreciates By 1.46%
During the previous trading session, the yellow metal appreciated against the US Dollar by 1874 pips or 1.46%. Note, the monthly R1 stopped the surge at 1,304.27. On Monday morning, the exchange currency rate was trading at 1,300.00.
In regards to the near-term future, most likely, the gold will be trading sideways to stay at the 1,295.00 level during the trading session.
On the other hand, the yellow metal could take the support of the dominant pattern line at 1,299.40 mark to push the rate to surge towards the monthly R1 at 1,304.27.

GBP/USD Breaks Previously Drawn Pattern
During the previous trading session, the currency exchange rate surged to the 50.00% Fibonacci retracement level at 1.3163, breaking the previously drawn pattern line at the 1.3100 mark. On Monday morning, the rate was located above the 50.00% Fibo at the 1.3171 mark.
In regards to the near-term future, most likely, the rate will be trading sideways to stay between the 50.00% Fibo and the weekly pivot point at 1.3084.
On the other hand, the 55-hour simple moving average could support the rate to push it to trade at the 1.3200 level.

EUR/USD Jumps To 1.1380 Level
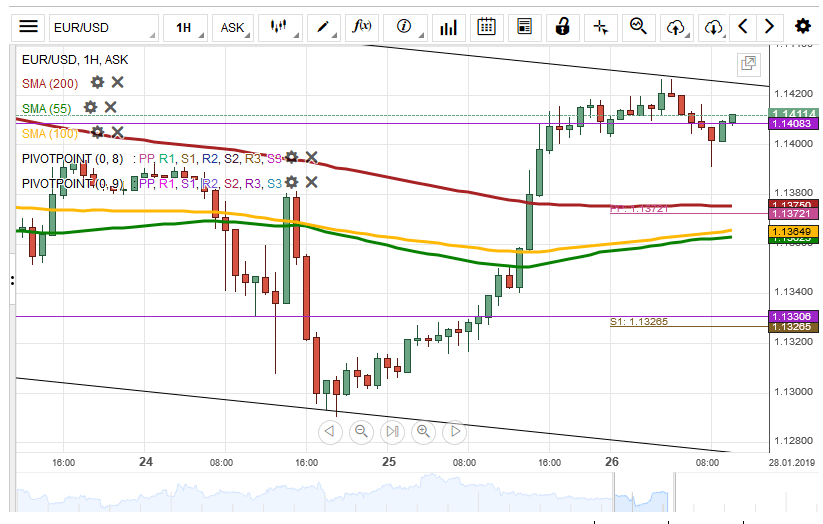
During Friday's trading session, the European Single Currency appreciated against the US Dollar by 97 pips or 0.86%, breaking most of the technical indicators. On Monday morning, the currency exchange rate was located below the monthly pivot point at the 1.1402 mark.
In regards to the near-term future, most likely, the rate will trade towards the weekly pivot point at 1.1372.
Moreover, the European Single Currency could be retraced by the simple moving averages to jump back to the 1.1400 level.
NZD/USD Brief Retracement Expected
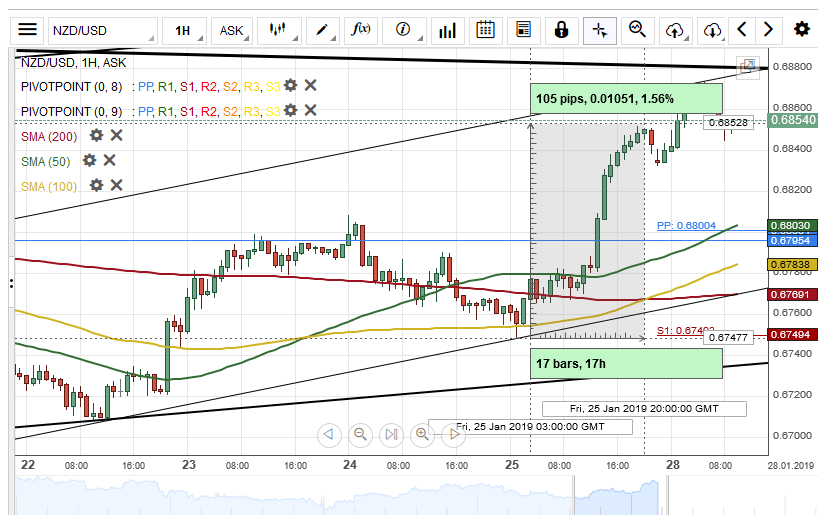
Upside sentiment dominated the New Zealand Dollar against the US Dollar on Friday. The exchange rate gained about 105 base points during Friday's trading session.
Most likely, it is expected that the currency pair maintains its upward momentum today. However, bearish traders could push the price towards a support cluster formed by the combination of the weekly and the monthly pivot points at the 0.6800 area within this session.
A potential upside reversal is likely to occur if the support cluster as mentioned above holds.
EUR/JPY Breaches Junior Ascending Channel
The single European currency appreciated about 151 base points against the Japanese Yen on Friday. The currency pair tested a one-month high level of 125.30 during Friday's trading session.
The exchange rate breached the lower boundary of an ascending channel pattern at 124.69 during the first half of Monday's trading session.
Given that the currency exchange rate has breached the given channel pattern, it is likely that the pair will aim for a support cluster formed by the combination of the 200-hour simple moving average and the monthly PP at 124.45 today.
However, a support level set by the 50– and 100-hour SMAs at 124.52 could hinder such movement.

AUD/USD Moving Towards 0.7152
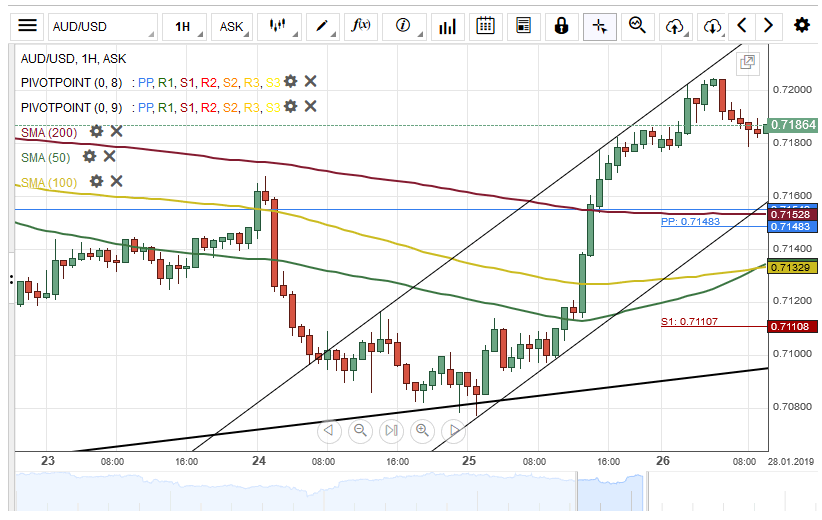
The Australian Dollar appreciated about 103 base points against the US Dollar on Friday. The currency pair tested the upper boundary of a junior ascending channel pattern at 0.7200 during the previous trading session.
As for the near future, it is likely that the AUD/USD currency exchange rate makes a brief retracement down towards a support cluster formed by the combination of the weekly and the monthly PPs and the 200-hour simple moving average at 0.7152.
A potential upside reversal from the support level as mentioned above could follow thereafter. Traders should look for opportunities to trade if the support level holds.
USD/CAD Decline Likely To Continue
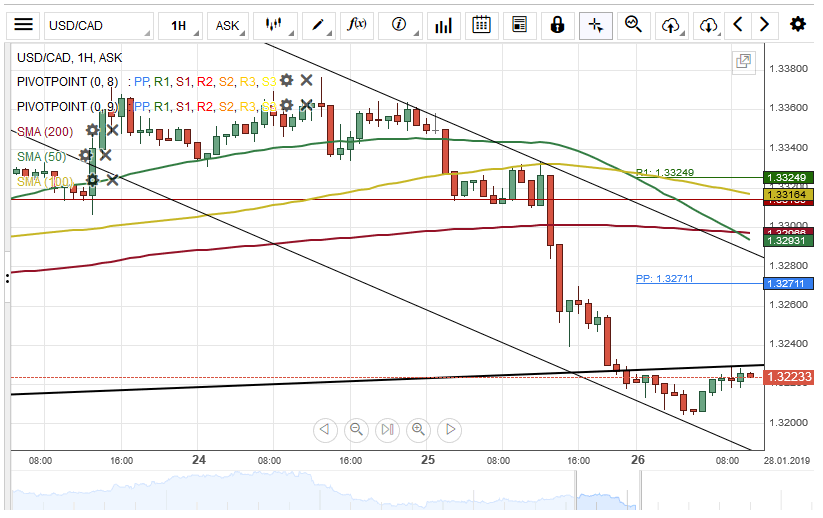
The US Dollar edged lower against the Canadian Dollar on Friday. The currency pair lost about 145 base points of its values during Friday's trading session. Meanwhile, the overall market sentiment remained bearish on Monday morning.
Technical indicators demonstrate that the decline of the exchange rate will continue within this session. However, it is likely that the pair will make a retracement towards the weekly pivot point at 1.3271 today.
By and large, it is expected that the USD/CAD currency exchange rate maintains the junior descending channel pattern during the following trading session.
The Analytical Overview Of The Main Currency Pairs
The EUR/USD currency pair
Technical indicators of the currency pair:
Prev Open: 1.13010
Open: 1.14006
% chg. over the last day: +0.96
Day's range: 1.13928 – 1.14256
52 wk range: 1.1214 – 1.2557
EUR started to recover after a significant downfall during the last two weeks. On Friday, January 25, the quotes have grown by 100 points and updated the key extremums. A political conflict is ongoing in the White House. Last week Donald Trump finally signed off on the temporary financing of the government until February 15. The currency pair is consolidating around 1.13800-1.14250. You should open positions from these levels. The key events this week will be the Federal Reserve meeting and the US Labour Market report for January.
The Economic News Feed for 28.01.2019 is calm. Keep an eye on the statements made by the head of the EU Central Bank.
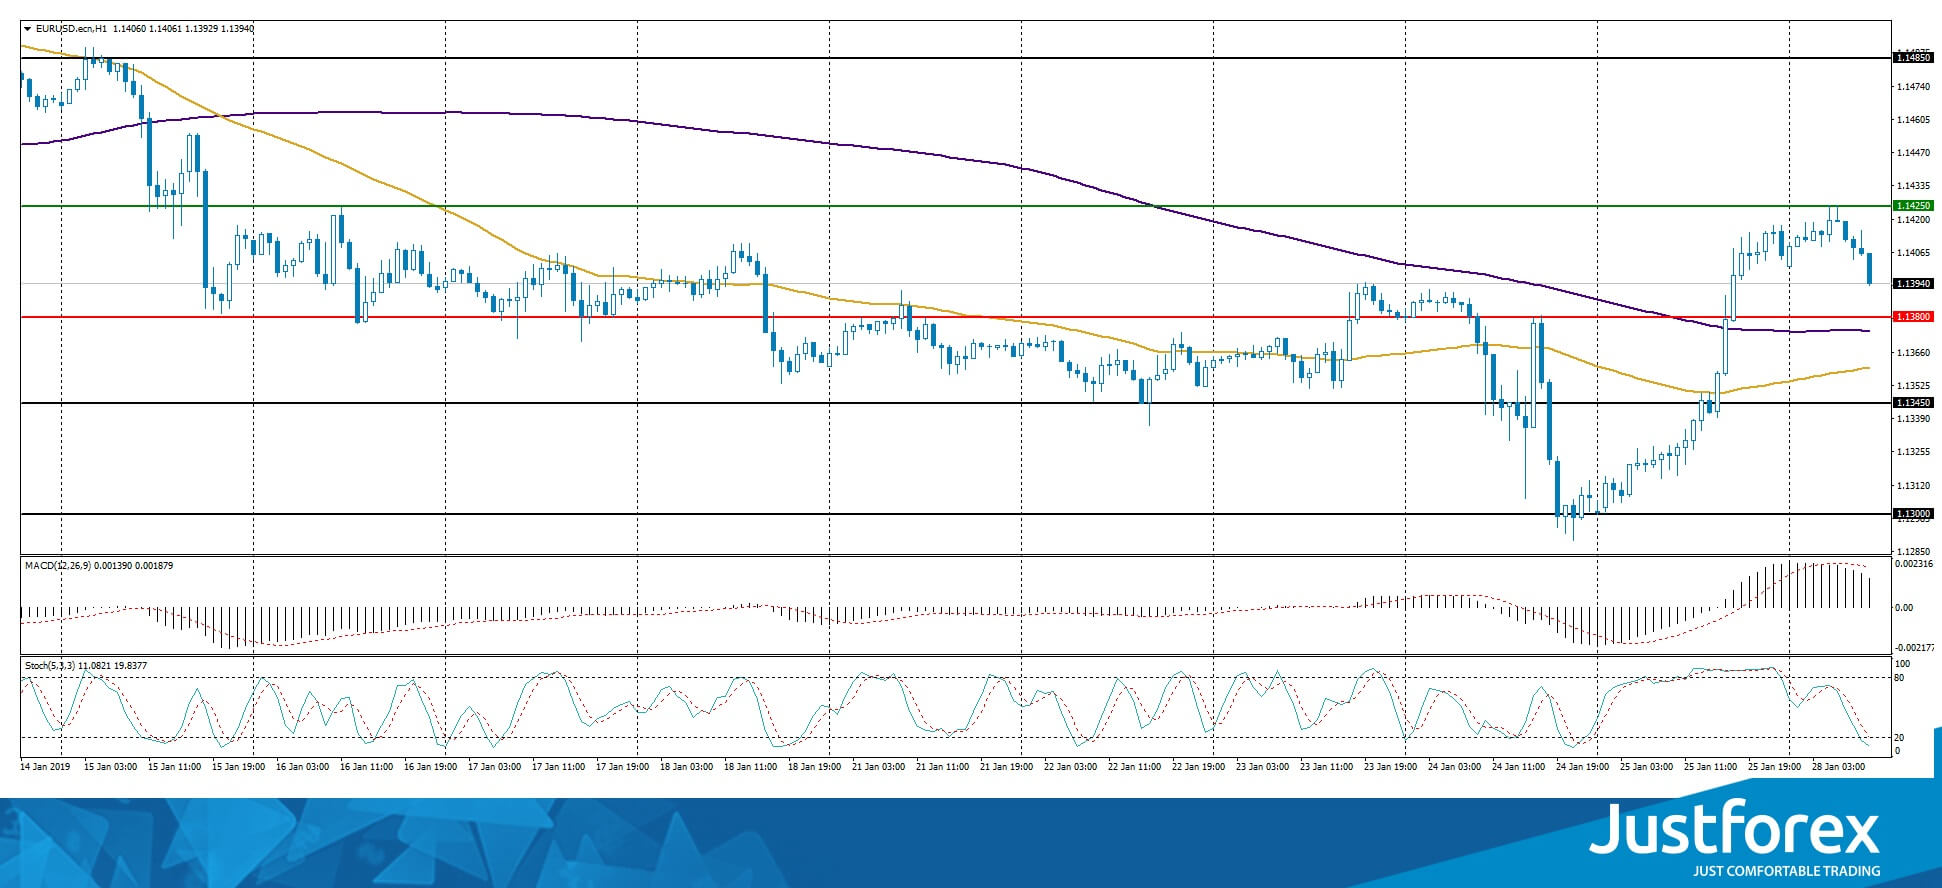
The price fixed above the 50 MA and 200 MA which points to the power of the buyers.
The MACD histogram is in the positive zone but below the signal line, which gives a weak signal to buy EUR/USD.
The Stochastic Oscillator reached the oversold zone, the %K line is below the %D line which gives a weak signal to sell EUR/USD.
Trading recommendations
Support levels: 1.13800, 1.13450, 1.13000
Resistance levels: 1.14250, 1.14850
If the price fixes above the local support 1.14250, consider buying EUR/USD. The movement will tend toward 1.14600-1.14800.
Alternatively the quotes can descend toward 1.13500-1.13300.
The GBP/USD currency pair
Technical indicators of the currency pair:
Prev Open: 1.30624
Open: 1.31838
% chg. over the last day: +1.05
Day's range: 1.31614 – 1.32110
52 wk range: 1.2438 – 1.4378
GBP/USD keeps showing a stable ascending trend. Right now the pount is consolidating around the 3mo maximums. The key levels are 1.31350 and 1.32150. A technical correction is possible soon. The investors are waiting for a vote in the British Parliament regarding the Brexit plan proposed by Theresa May. You should open positions from the key levels.
Keep an eye on the statements made by the head of the Bank of England.
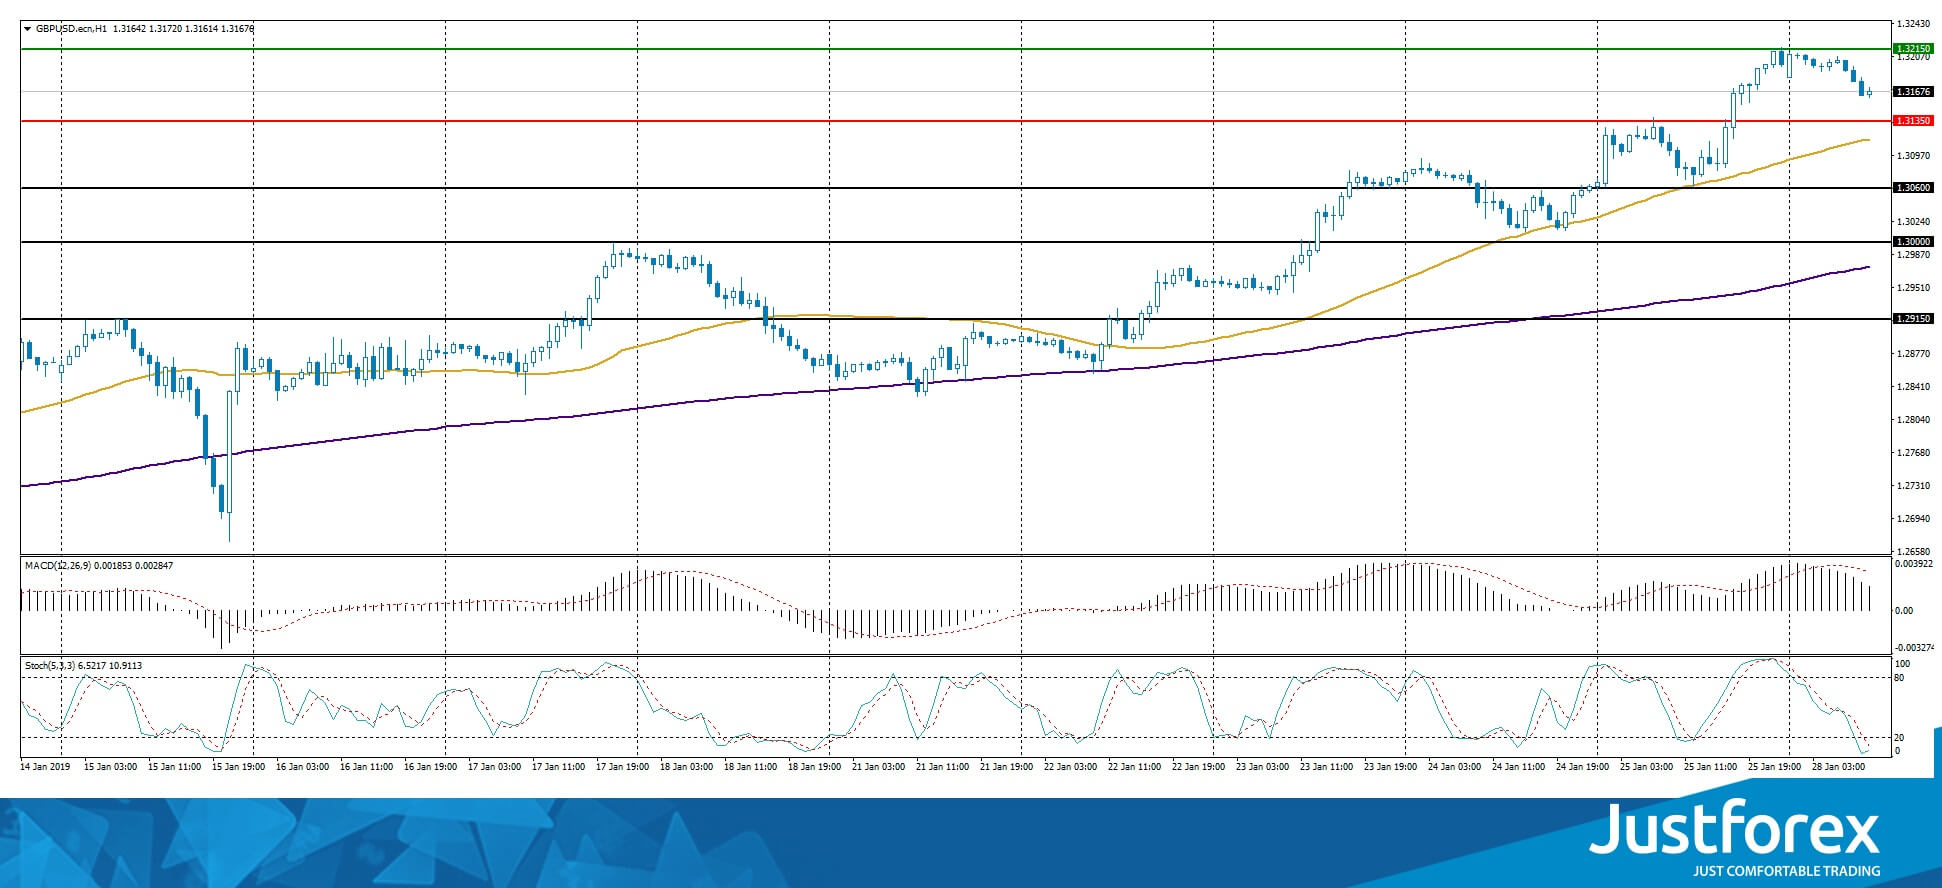
The price fixed above 50 MA and 200 MA which shows the power of the buyers.
The MACD histogram is in the positive zone but below the signal line, which gives a weak signal to buy EUR/USD.
The Stochastic Oscillator is in the oversold zone, the %K line started to cross the %D line. There are no signals at the moment.
Trading recommendations
Support levels: 1.31350, 1.30600, 1.30000
Resistance levels: 1.32150, 1.32500
If the price fixes above 1.32150, consider looking for the market entry points to open long positions. The movement will tend toward 1.32500-1.32750.
Alternatively the quotes can correct toward 1.30700-1.30400.
The USD/CAD currency pair
Technical indicators of the currency pair:
Prev Open: 1.33455
Open: 1.32183
% chg. over the last day: -0.97
Day's range: 1.32030 – 1.32281
52 wk range: 1.2248 – 1.3664
USD/CAD had a rather aggressive sell-off on Friday, January 25. CAD added more than 120 points to ints value and updated the local extremums. Right now the quotes are consolidating around 1.32000 and 1.32300. The quotes can descend further. Keep an eye on the oil quotes dynamics.
The Economic News Feed for 28.01.2019 is calm.
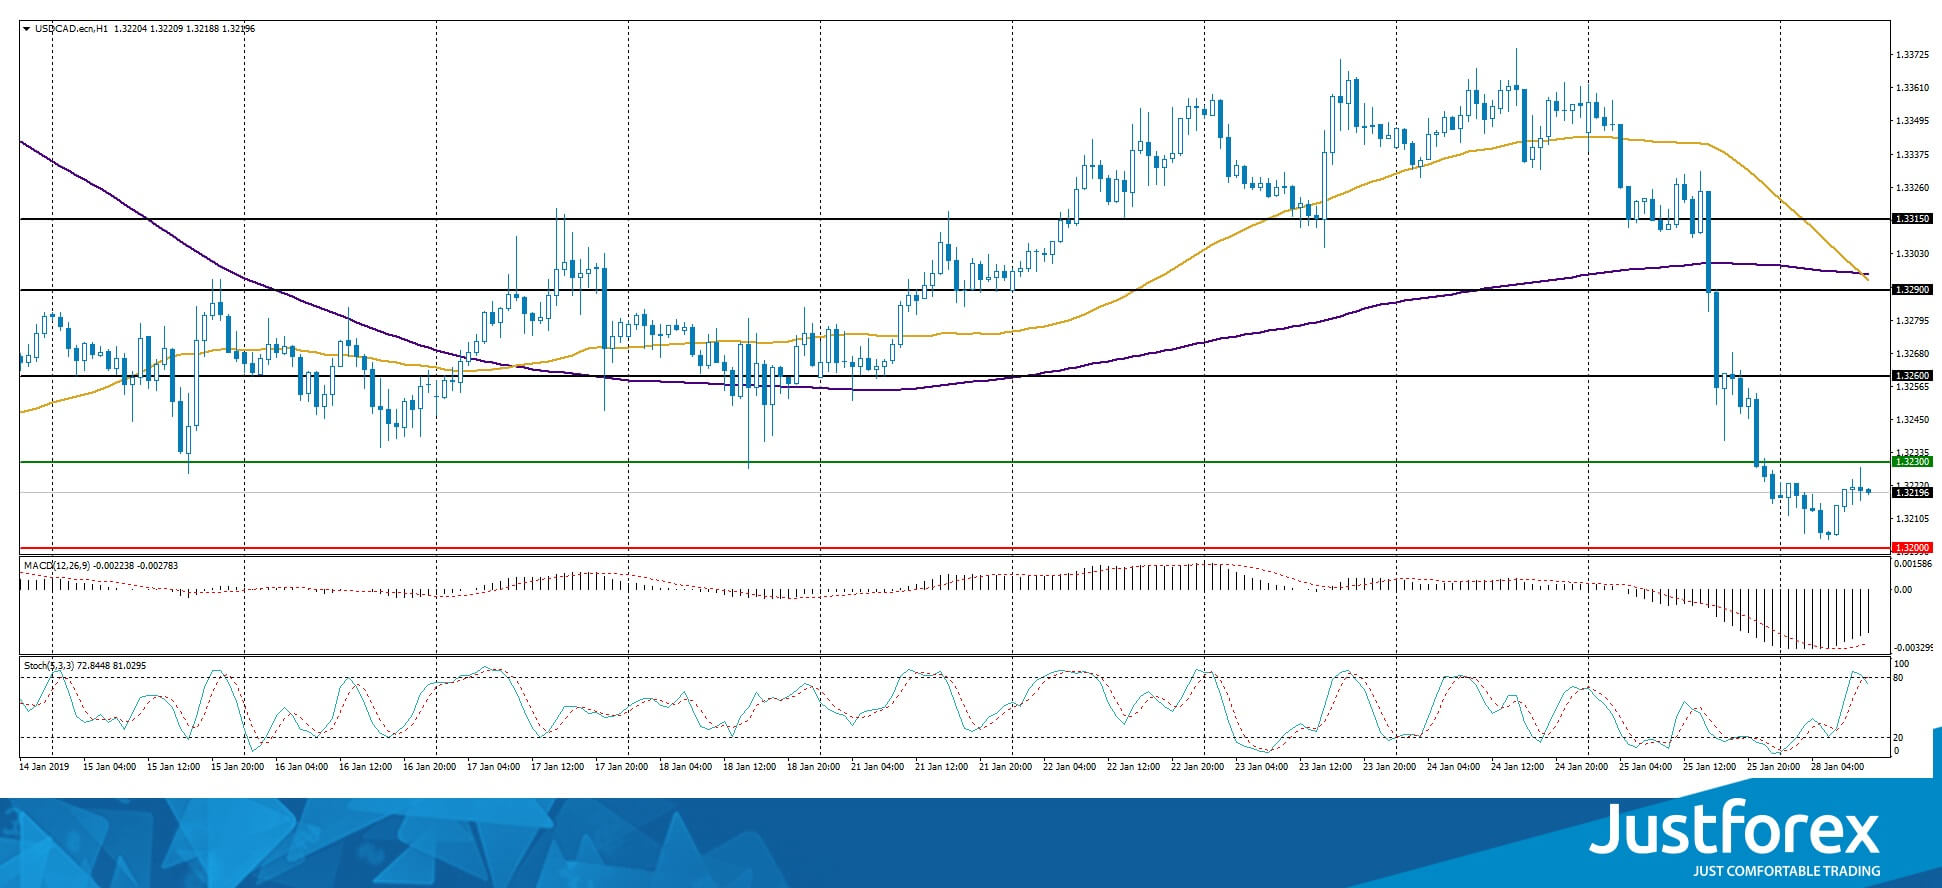
The price fixed below 50 MA and 200 MA which points to the power of the buyers.
The MACD histogram is in the negative zone but above the signal line which gives a weak signal to sell USD/CAD.
The Stochastic Oscillator is near the overbought zone, the %K line is crossing the %D line. There are no signals at the moment.
Trading recommendations
Support levels: 1.32000, 1.31500
Resistance levels: 1.32300, 1.32600, 1.32900
If the price falls lower than the round 1.32000, the quotes can descend toward 1.31600-1.31400..
Alternatively, the quotes can correct toward 1.32500-1.32750.
The USD/JPY currency pair
Technical indicators of the currency pair:
Prev Open: 109.625
Open: 109.541
% chg. over the last day: -0.08
Day's range: 109.265 – 109.574
52 wk range: 104.56 – 114.56
USD/JPY is consolidating in the narrow range. The currenct technical picture indicates a development of a bearish mood. The key support and resistance levels are 109.250 and 109.500. You should open positions from these levels. Keep an eye on the US Treasury bonds yield.
The Economic News Feed for 28.01.2019 is calm.
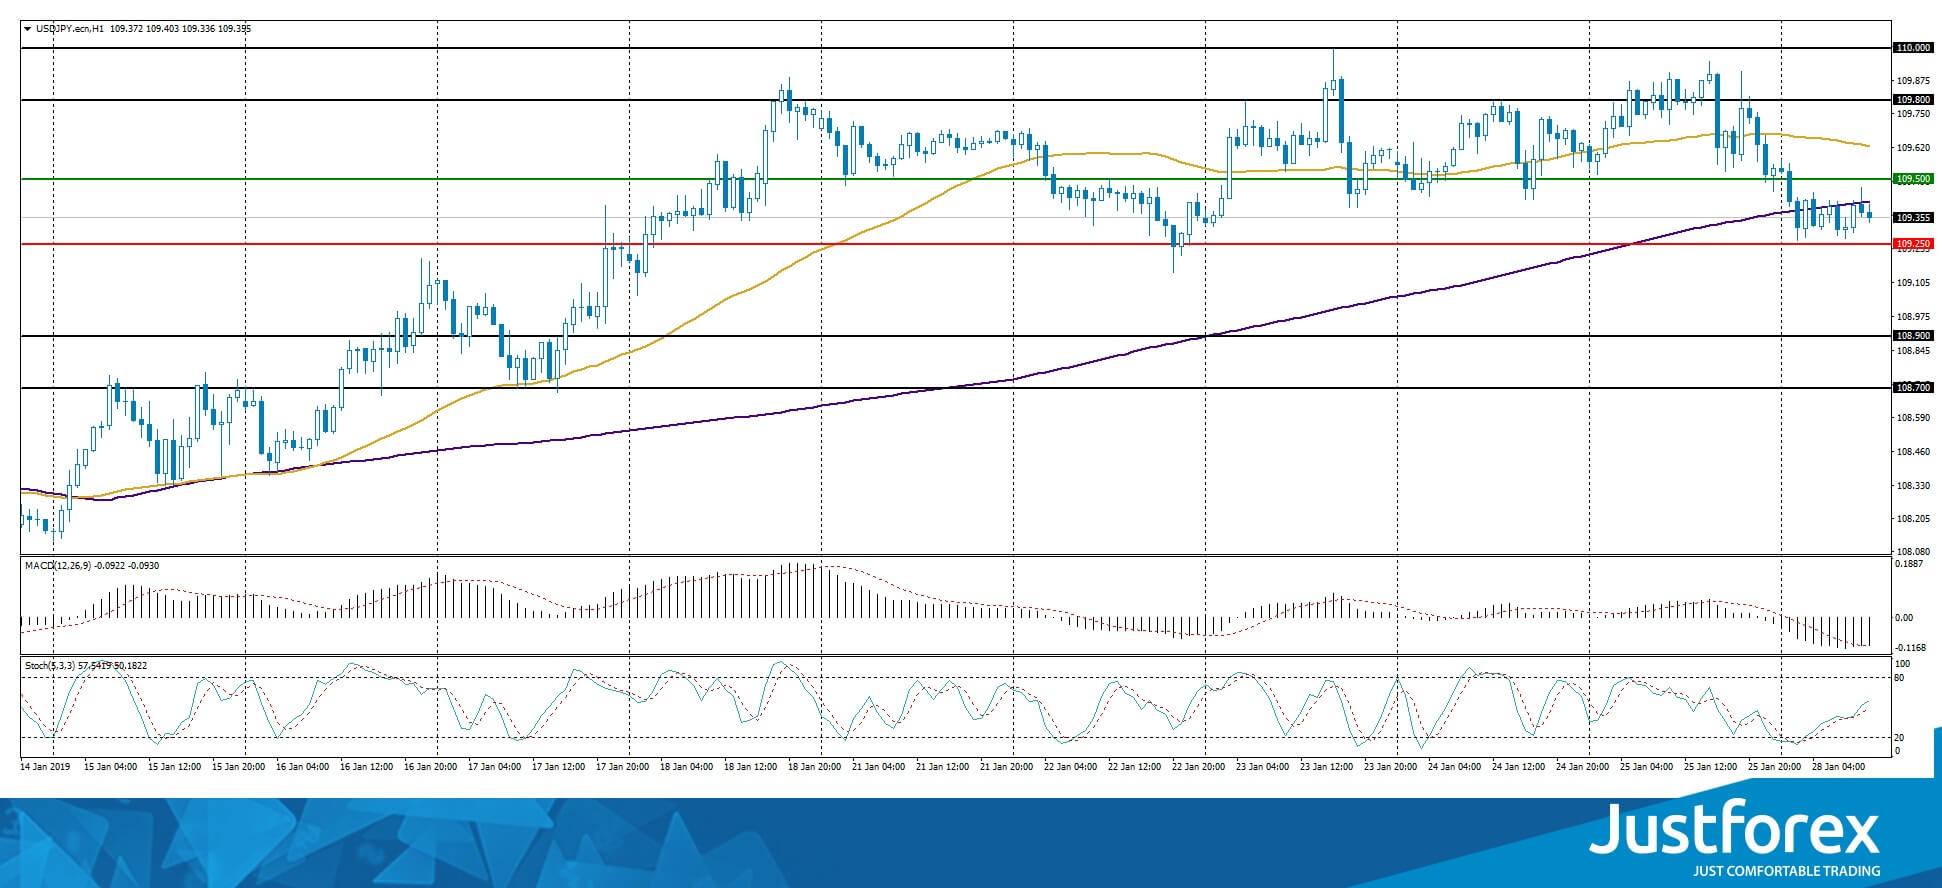
The indicators do not provide precise signals, the price has crossed 200 MA.
The MACD histogram is in the negative zone and below the signal line, which gives a strong signal to sell USD/JPY.
The Stochastic Oscillator is in the neutral zone, the %K line is above the %D line which points to a bullish mood.
Trading recommendations
Support levels: 109.250, 108.900, 108.700
Resistance levels: 109.500, 109.800, 110.000
If the quotes fix below the local support of 109.250, expect the quotes to descend toward 108.900-108.700.
Alternatively the quotes can grow toward 109.750-110.000.
FOMC Preview – How Dovish is the Fed?
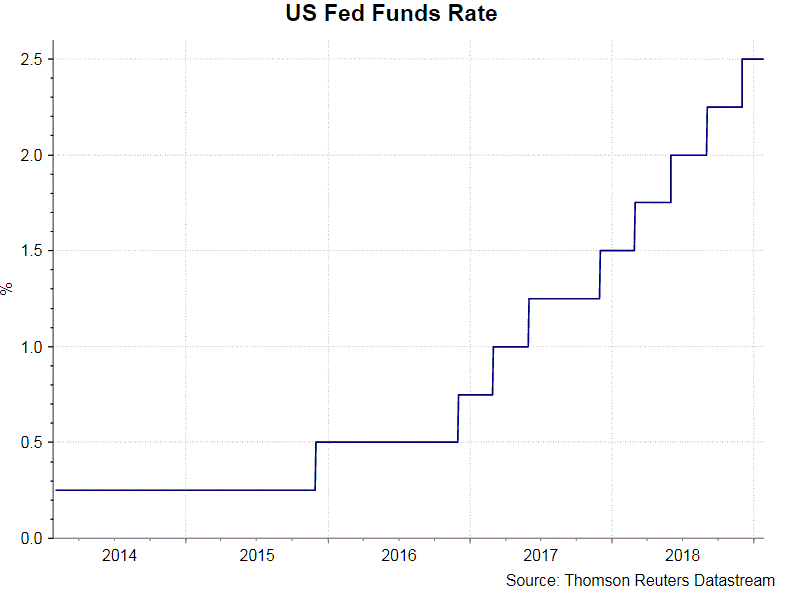
There are several issues we are expecting from the FOMC meeting later this week. While it is widely anticipated that the Fed would leave its policy rate unchanged at 2.25-2.5%, the potential changes in the accompanying statement and the message conveyed by chair Jerome Powell would be indicative of the future rate path.
Policymakers might revise slightly lower their economic assessment and adjust the forward guidance, emphasizing the data-dependence of the next rate hikes. There should also be updates on the balance sheet reduction plan. Growing concerns over global growth slowdown and softening of sentiment, we expect the Fed would stay put at least in the first quarter. Yet, as economic uncertainties diminish and the growth outlook stabilizes, the Fed would still implement rate hikes later this year.
 Economic Assessment
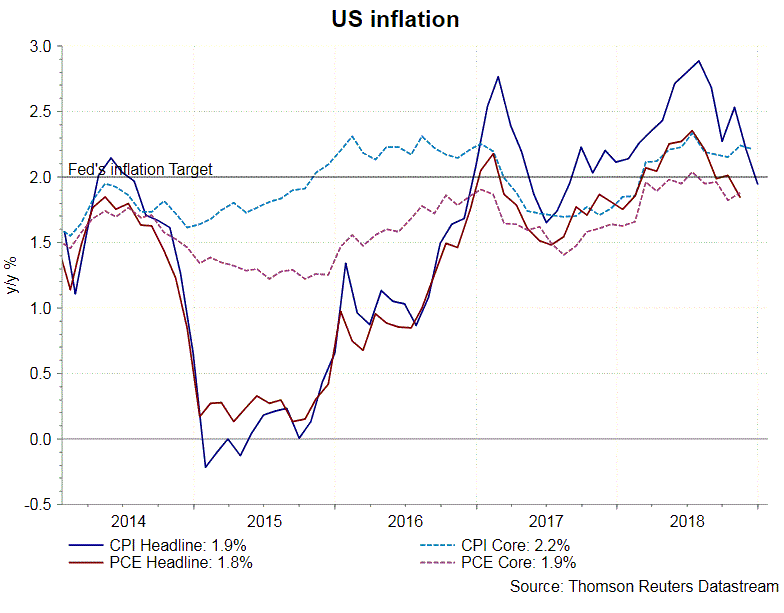
Economic developments since the December show that the US growth is losing momentum. Headline CPI eased to +1.9% y/y in December form +2.2%. Core inflation stayed unchanged at +2.2%.
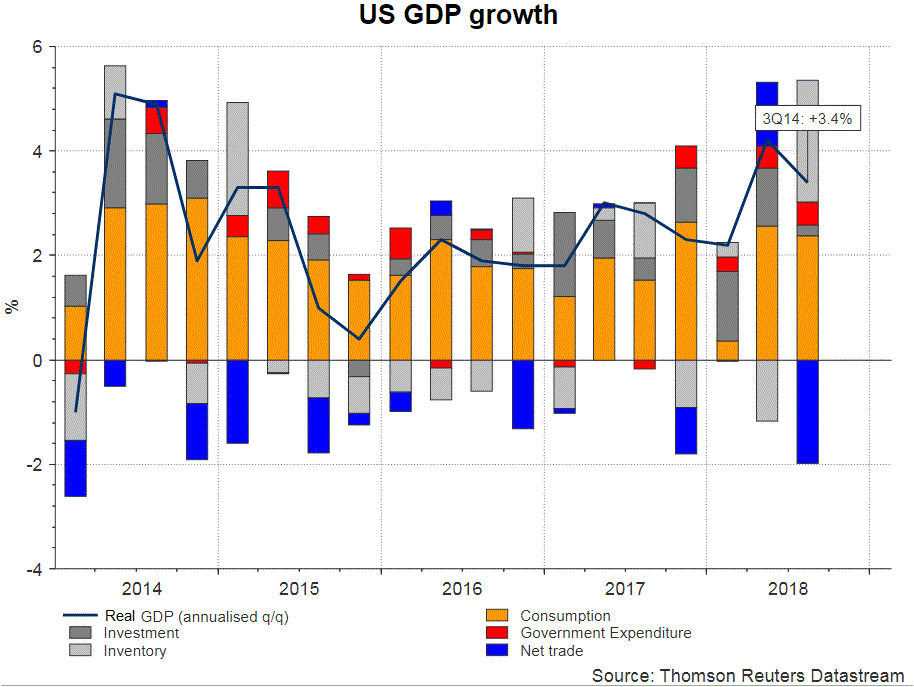
Final reading of GDP growth eased to an annualized +3.4% q/q in 4Q18, compared with +4.2% in the prior quarter. This signaled the fading effect of the tax reform plan. The employment situation remained resilient.
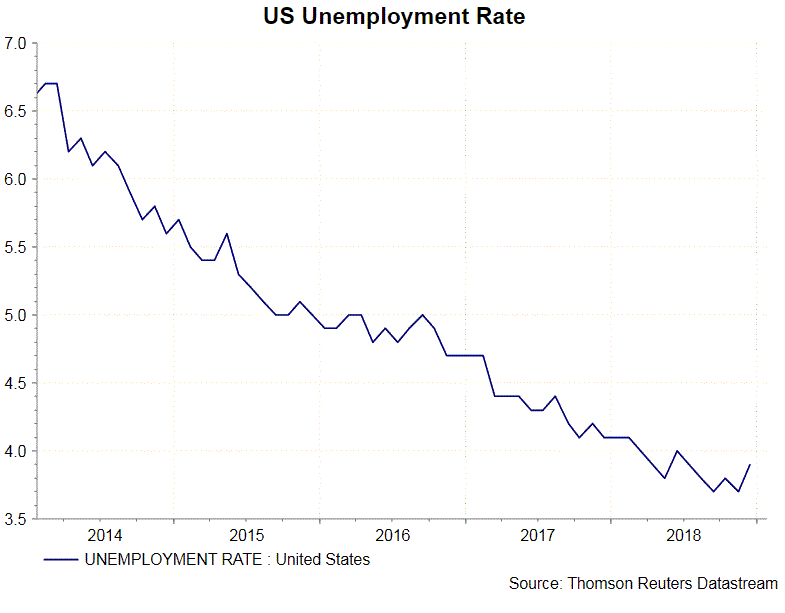
Nonfarm payrolls soared +312K last months, compared with consensus of +177K and November’s +176K. The unemployment rate climbed +0.2 percentage point to 3.9% in December. This is still far below the Fed’s long-term target of 4.5-4.6%. Growth in average earnings improved to +3.2%, beating consensus of +3% and November’s +3.1%.
Meanwhile, shortly after the last FOMC meeting, the US government was forced to shut down. The economic impacts of one-month shutdown (Dec 22, 2018 – Jan 25, 2019) probably add to the downside of US growth outlook.
The Fed might suggest that that economic activity has remained “solid” or “firm”, compared with usual description of “strong”. This can help convey a message of moderation of economic growth. Indeed, the number of times that the Fed used “strong” to describe the economy has dropped in November and December, from August and September.
Forward Guidance
At the December meeting statement, the members “judged” that there would be “some” further gradual increases in the Fed funds rate. Meanwhile, they added that “risks to the economic outlook are roughly balanced”, adding the pledge that they would “continue to monitor global economic and financial developments and assess their implications for the economic outlook”. The subtlety in the language was overturned by more dovish stance in the minutes. Recall that the minutes revealed that “many participants” preferred to be “patient about further policy firming”, amidst “muted inflation pressures”.
The focus here is how the Fed adjusts its forward guidance. Would it reiterate that “some further gradual increases” in the policy remains insight? Would it explicitly call for “patience” and indicate that the next monetary decision is “data-dependent”? The latter would signal that the Fed has turned quite dovish. We expect it to reiterate further gradual rate hikes while giving more emphasizes on upcoming economic data.
Early End to Balance Sheet Reduction?
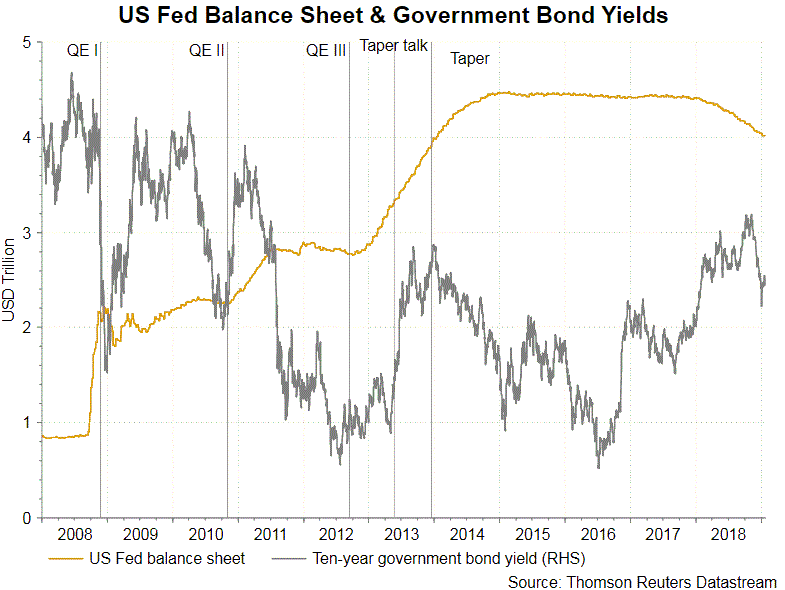
The market moved rigorously after a WSJ report suggesting that the Fed members are considering to end the balance sheet reduction plan earlier than previously expected. The dovish statement from the report lifted stocks and dampened US dollar. Powell would certain receive questions on the issue at the press conference, if the accompanying statement fails to make itself clear.