Sample Category Title
Forex Technical Analysis: EUR/USD, USD/JPY, GBP/USD
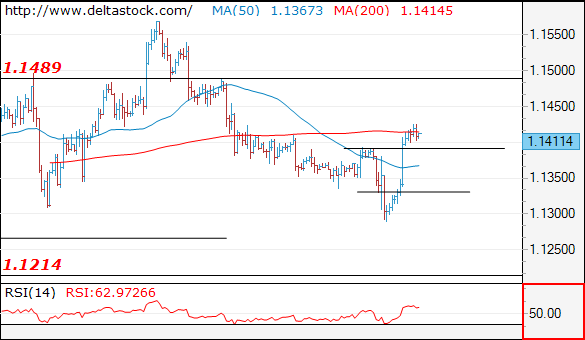
EUR/USD
Current level - 1.1414
The violation of 1.1390 signals a completion of the downtrend since 1.1570 high and the bias is rather positive, with a risk of a rise towards 1.1490. It is still unclear if the rebound above 1.1290 is only a corrective pattern, but an eventual slide below 1.1390, to 1.1330 support will confirm such a scenario.
| Resistance | Support | ||
| intraday | intraweek | intraday | intraweek |
| 1.1450 | 1.1630 | 1.1390 | 1.1214 |
| 1.1570 | 1.1820 | 1.1330 | 1.1100 |
USD/JPY
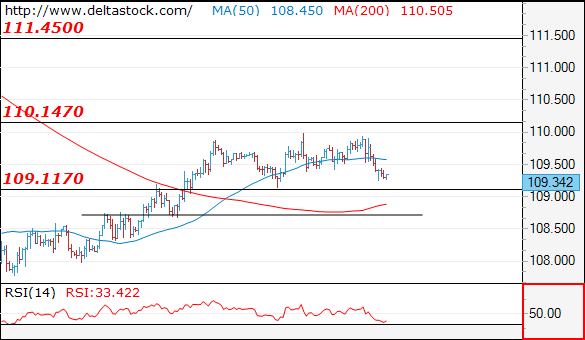
Current level - 109.34
Current slide below 110.20 resistance should be the final leg of the consolidation pattern above 109.10, before advancing upwards, to 111.45.
| Resistance | Support | ||
| intraday | intraweek | intraday | intraweek |
| 109.90 | 111.45 | 109.10 | 106.70 |
| 110.20 | 112.20 | 109.10 | 104.60 |
GBP/USD
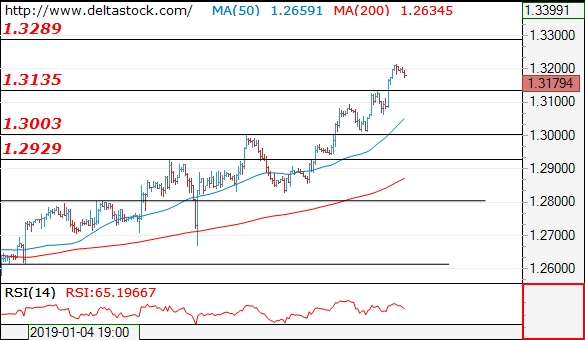
Current level - 1.3179
The uptrend is intact above 1.3135, for a rise towards 1.3290 resistance. Crucial on the downside is 1.3060 low.
| Resistance | Support | ||
| intraday | intraweek | intraday | intraweek |
| 1.3210 | 1.3290 | 1.3135 | 1.3000 |
| 1.3290 | 1.3480 | 1.3000 | 1.2800 |
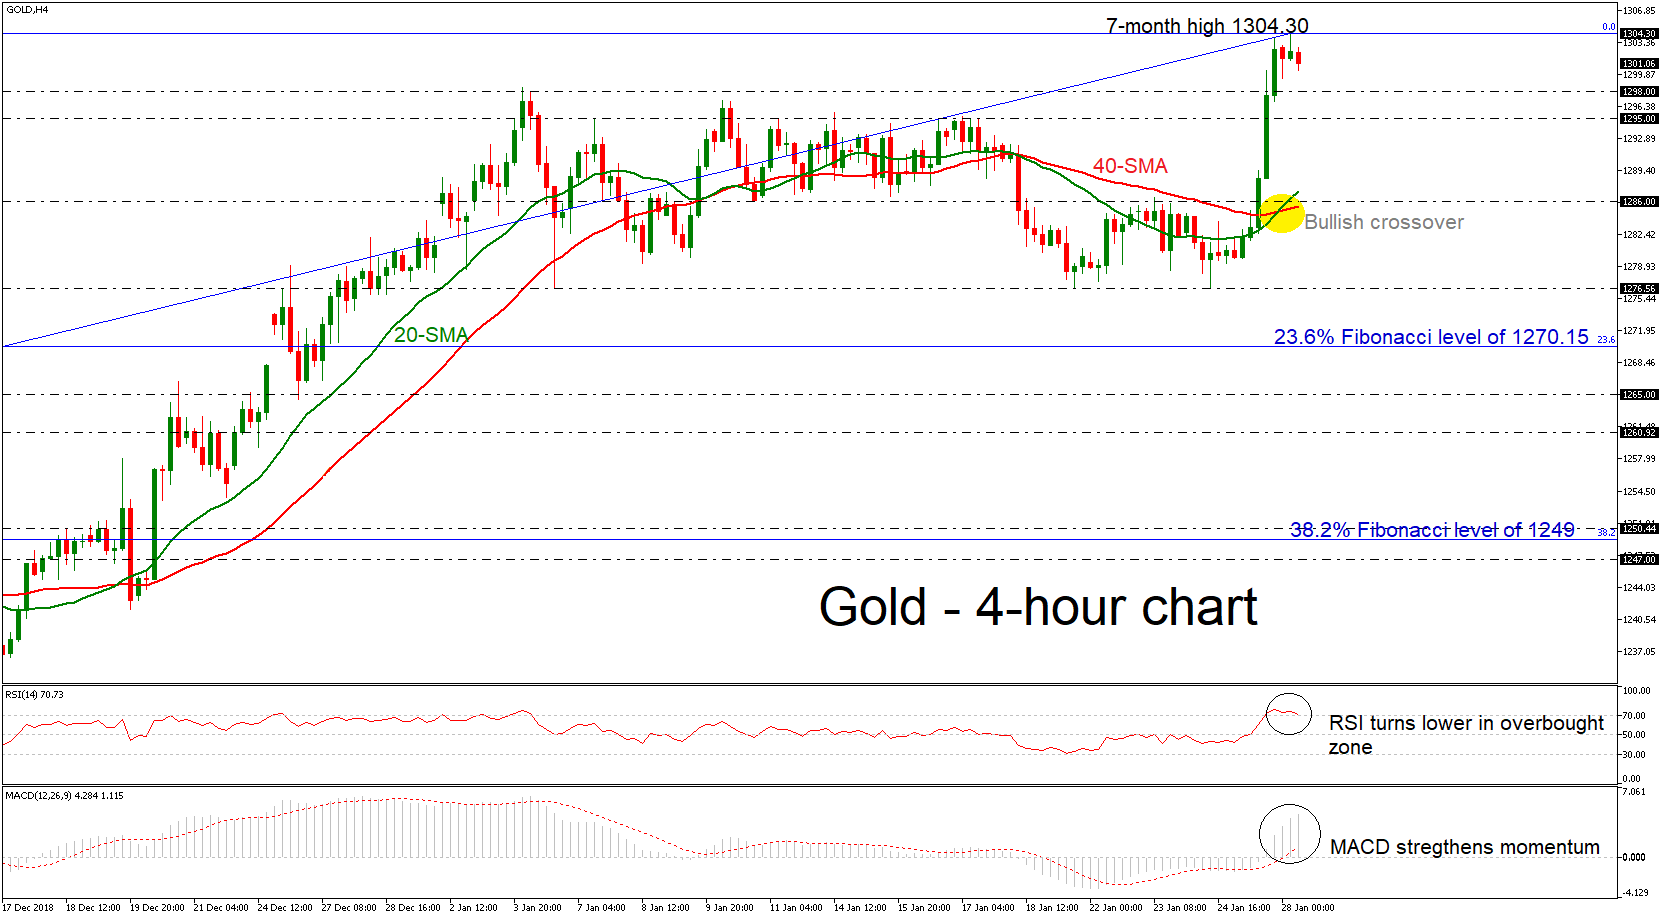
Gold Touches Fresh 7-Month High Above 1300
Gold had one of its best trading sessions for this year so far on Monday, reaching a fresh 7-month high of 1304.30. However, currently, the price holds marginally below this peak. The technical indicators are still located in bullish area, with the MACD stretching further above its red signal line and the RSI moving above 70. Yet the latter could also be an indication that the rally is overdone, and hence negative corrections should not come as a surprise in the next few sessions as it is pointing to the downside.
Should the price retreat, immediate support is coming from 1298, before dipping towards the 1295 barrier. Moving lower, the focus would shift to the 1286 hurdle, which stands around the bullish crossover of the 20- and 40-simple moving averages (SMAs) in the 4-hour chart. Lower still, a violation of this area would increase chances that the bullish phase has ended, and a downward correction is in progress in the near term.
In the alternative scenario, traders would be eagerly looking for a break above today’s top of 1304.30 to increase buying orders. If that’s the case, the rally could last until 1309, taken from the high on June 10. If bullish forces appear even stronger, 1326 should be another resistance to keep in mind, identified by the highs on May 6.
The recent bullish action turned the bigger picture more positive as well, and with the shorter-term moving averages (MA) increasing distance from the price, we could expect further improvement in the market.
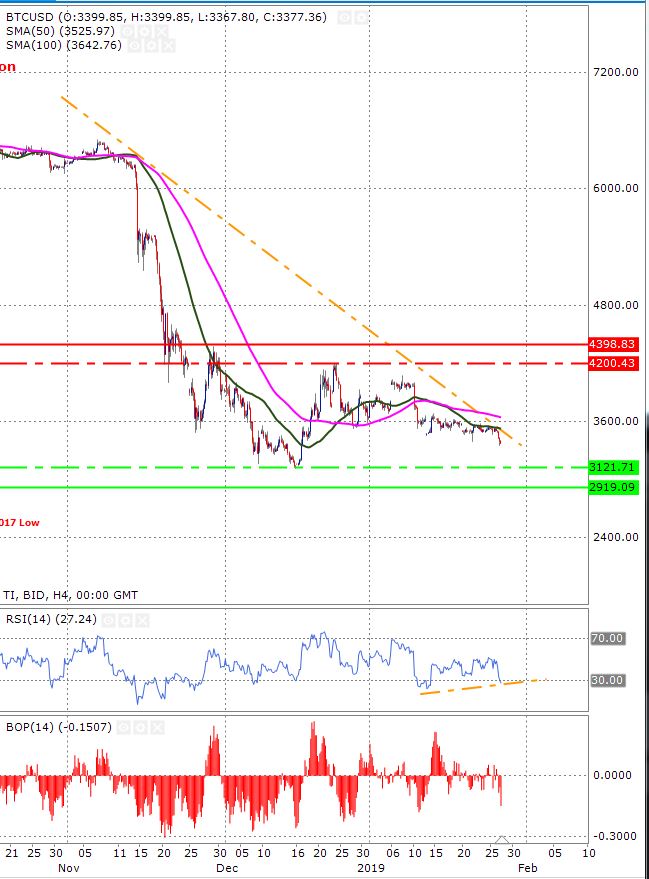
Cryptos: Bitcoin’s Price Under Selling Pressure
Bitcoin price is trading below its downward trend line on intraday (4-hour) time frame. This confirms that the trend is to the downside and as long as the price stays below this trend line, this will be the dominant trend. Another confirmation of the downtrend comes from the fact that the price is trading below the 50 and 100-day moving averages (shown in dark green and pink colour respectively). Moreover, the 50-day moving average is also trading below the 100-day moving average which further strengthens the above argument. Finally, the balance of power indicator isn’t supporting the bull case either, it is well below the zero level and this shows that the selling pressure is the dominant force.
The price of Bitcoin has been trading mostly sideways during the past three days and the fact that it failed to break above the 50-day moving average shows that the bulls have no momentum behind them. Having said this, things could change in the coming days because of the Relative Strength Index has dipped into oversold zone. A reading near 30 shows that the price is oversold and it generally brings new buyers in the market and reading near 70 sends the message that it is overbought.
The support zone is shown by the dotted and solid light green horizontal lines and the resistance is shown by the dotted and solid red lines.
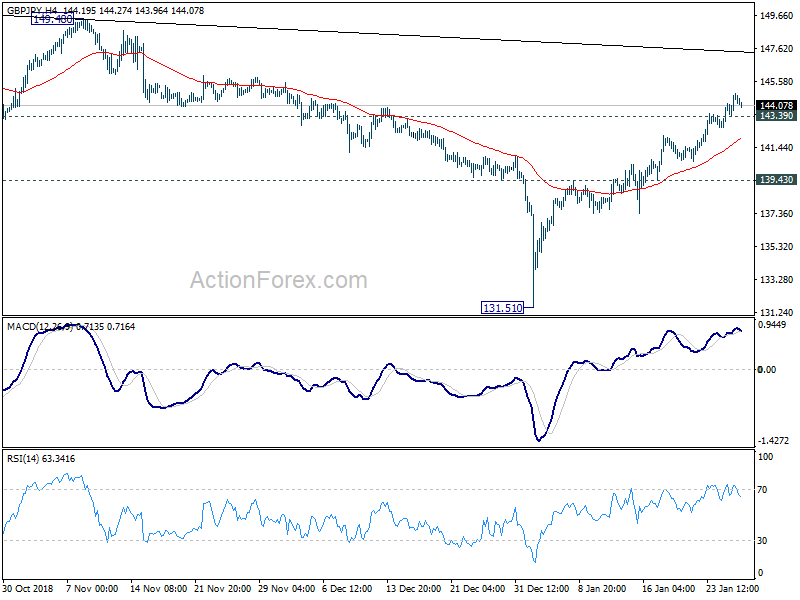
GBP/JPY Daily Outlook
Daily Pivots: (S1) 143.51; (P) 144.18; (R1) 145.27; More...
Intraday bias in GBP/JPY remains on the upside as rise from 131.51 is in progress for trendline resistance at around 147.35. We'd expect strong resistance from there to limit upside at first attempt. On the downside, below 143.39 minor support will turn intraday bias neutral first and bring consolidations. But further rise will remain in favor as long as 139.43 resistance turned support holds.
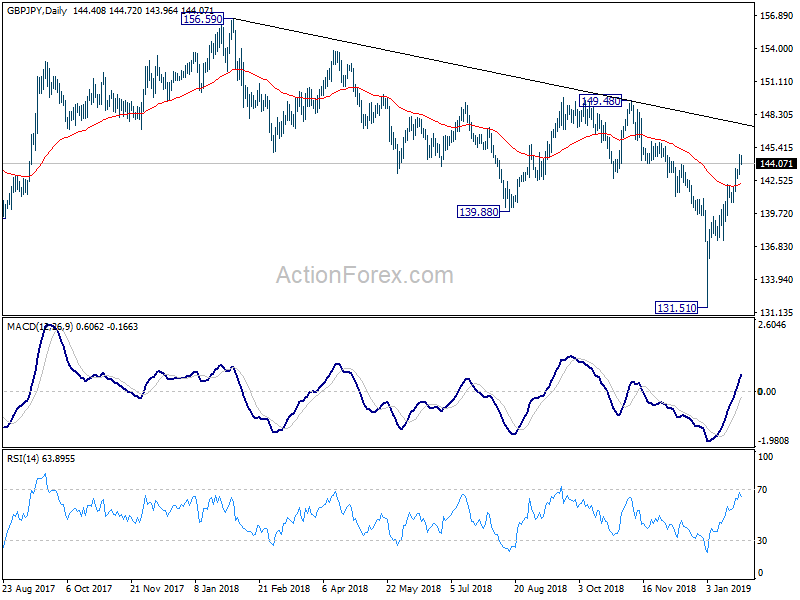
In the bigger picture, the strong rebound from 131.51 suggests that medium term fall from 156.59 (2018 high) has completed already. The corrective structure of such decline is turn argues that it's the second leg of the corrective pattern from 122.36 (2016 low). And this pattern is starting the third leg. On the upside, decisive break of 149.38 will pave the way to 156.59 resistance and above.
Dollar Takes A Hit On Speculation For Dovish Fed
- Reports the Fed may halt its balance sheet unwind hurt dollar, boost stocks
- Sterling marches higher ahead of decisive week for Brexit
- ECB President Draghi & BoE Governor Carney speak today
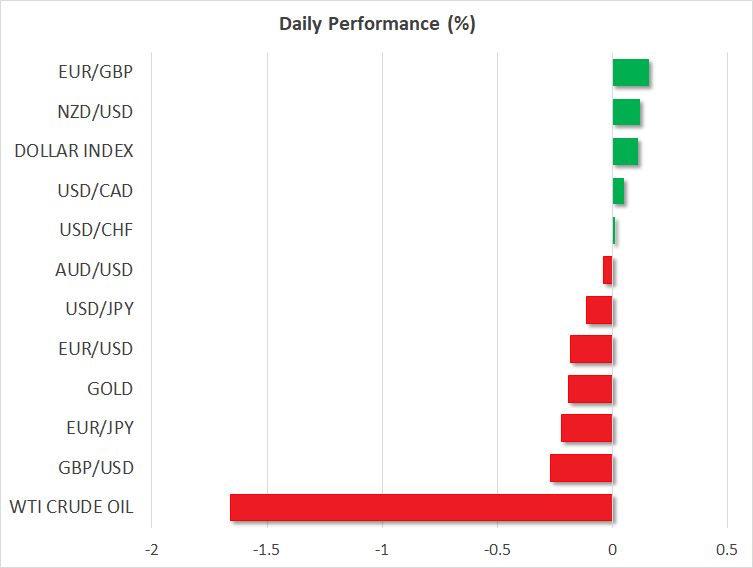
Dollar slumps, equities advance on Fed reports & trade optimism
It was a lively session for both currency and equity markets on Friday. The dollar slumped while stock indices climbed, amid renewed speculation that the Fed may turn even more dovish and the US-China talks could bear fruit soon. On the former, a WSJ report suggested Fed officials are considering halting their balance sheet reduction early. The shrinking of the balance sheet amounts to tightening policy; since QE ballooned the Fed’s portfolio to stimulate the economy, it’s unwinding drains liquidity and has similar effects to rate hikes. Therefore, pausing this process is the equivalent of easing monetary conditions, and if this narrative is validated at Wednesday’s Fed meeting, similar market reactions could ensue. Namely, the greenback could suffer while stocks cheer.
On the trade front, sentiment was supported by headlines that Chinese vice-ministers are heading to Washington to lay the groundwork for top-level talks commencing on Wednesday. The early arrival of the Chinese delegation seemingly refueled hopes that a deal may be in sight, further diverting funds into equities and commodity-currencies such as the aussie and kiwi, and out of “safer” instruments like the yen and dollar. Besides these crucial trade talks and the Fed meeting, there is also a plethora of key economic data on the schedule this week, including a US employment report on Friday.
Pound outperforms ahead of deciding week for Brexit
Once again, the British pound was by far the best performer among the major currencies, without any major update on Brexit. Sterling/dollar briefly crossed above the 1.32 mark to record a fresh 3½-month high, as investors unwound more of their previous bearish bets on the UK currency, and amid broad weakness in the dollar.
It’s a critical week for Brexit, as Parliament will vote tomorrow on PM May’s Plan B, and the amendments to it. The narrative behind the pound’s recent rally has been that the risk of no-deal is diminishing as lawmakers get more involved, so for the currency to continue marching higher, it may require clear signals on that front. Specifically, whether MPs vote for the Cooper amendment could be key – this being a plan to avoid a no-deal outcome by extending the exit date. Overall, while the long-term outlook for the pound is clearly brighter, the magnitude and speed of the currency’s latest gains suggest some cause for caution, as the next step in Brexit remains uncertain and sentiment may reverse quickly on any discouraging news.
Coming up: ECB and BoE chiefs deliver remarks, earnings season fires up
While the week is definitely packed, Monday is relatively quiet in terms of data releases. ECB President Mario Draghi and BoE Governor Mark Carney will deliver remarks at 1400 GMT and 1430 GMT respectively. Focus could fall predominantly on Draghi, as the ECB appears to be turning more cautious in light of weakening economic data.
In stocks, the earnings season goes into full swing this week. Caterpillar will release its results today, two hours ahead of Wall Street’s opening bell. The guidance by management could prove crucial for broader market sentiment, as the company is often seen as the “canary in the coal mine” for global growth prospects.
Apple will report its own earnings on Tuesday, Microsoft and Facebook on Wednesday, while Amazon will be in focus on Thursday, among many others.
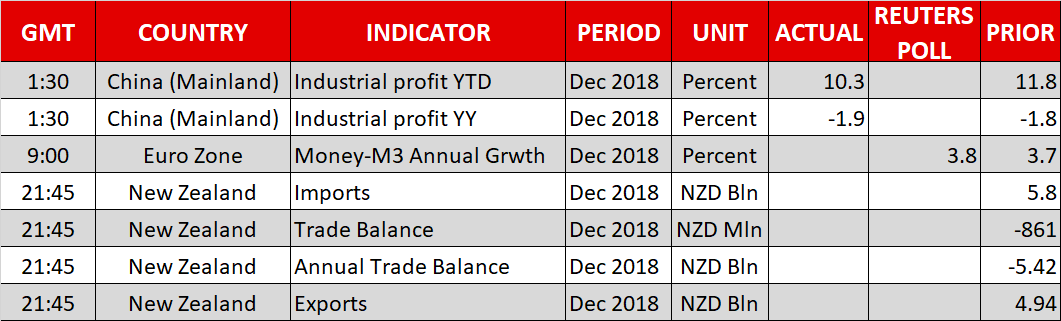
EUR/JPY Daily Outlook
Daily Pivots: (S1) 124.04; (P) 124.68; (R1) 125.58; More....
Intraday bias in EUR/JPY remains on the upside at this point. Rebounds should 118.62 should have just resumed for 55 day EMA (now at 126.38). On the downside, break of 123.78 support is now needed to indicate completion of rebound form 118.62. Otherwise, near term outlook will remain cautiously bullish in case of retreat.

In the bigger picture, medium term rebound from 109.03 (2016 low) has completed at 137.49 already, with corrective structure. Fall from 137.39 is possibly just the second leg of the corrective pattern from 109.03. Break of 133.12 resistance should start the third leg to 137.49 and above. Nevertheless, break of 118.62 will resume the decline from 137.49 for 109.03/114.84 support zone instead.

EUR/GBP Daily Outlook
Daily Pivots: (S1) 0.8616; (P) 0.8650; (R1) 0.8682; More...
Intraday bias in EUR/GBP remains neutral at this point, with focus on 0.8620 key support level. At this point, we'd continue to expect strong support from 0.8620 to contain downside to bring rebound. On the upside, above 0.8725 minor resistance will turn bias to the upside for 0.8763/8862 resistance zone first. However, sustained break of 0.8620 will resume larger decline from 0.9305 and target 100% projection of 0.9305 to 0.8620 from 0.9101 at 0.8416.
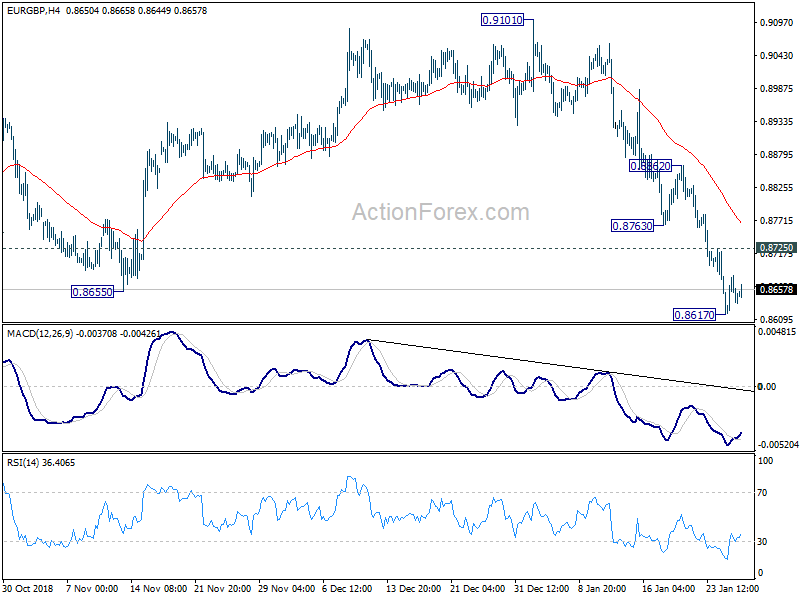
In the bigger picture, EUR/GBP is seen as staying in long term range pattern started at 0.9304 (2016 high). The medium term range is set between 0.8620 and 0.9101. Downside breakout of 0.8620 will pave the way back to 0.8312 support . Break of 0.9101 will bring retest of 0.9304/5 resistance.
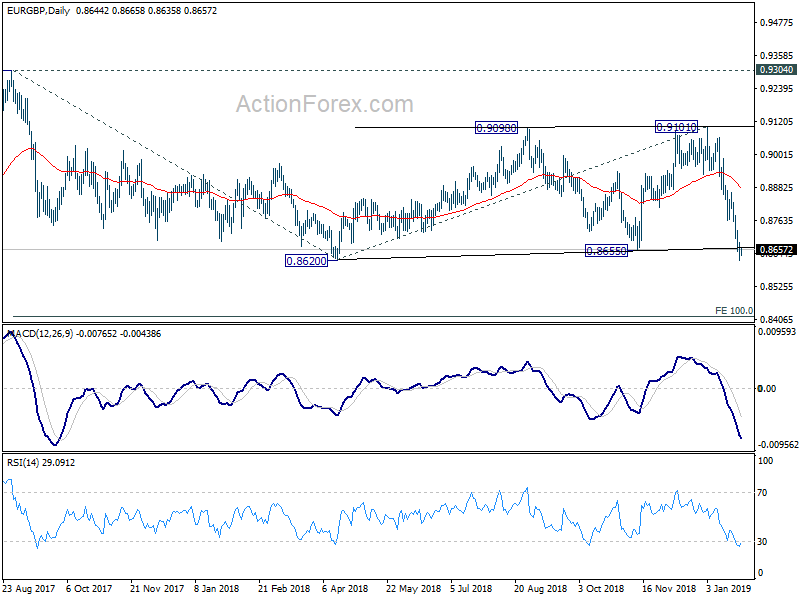
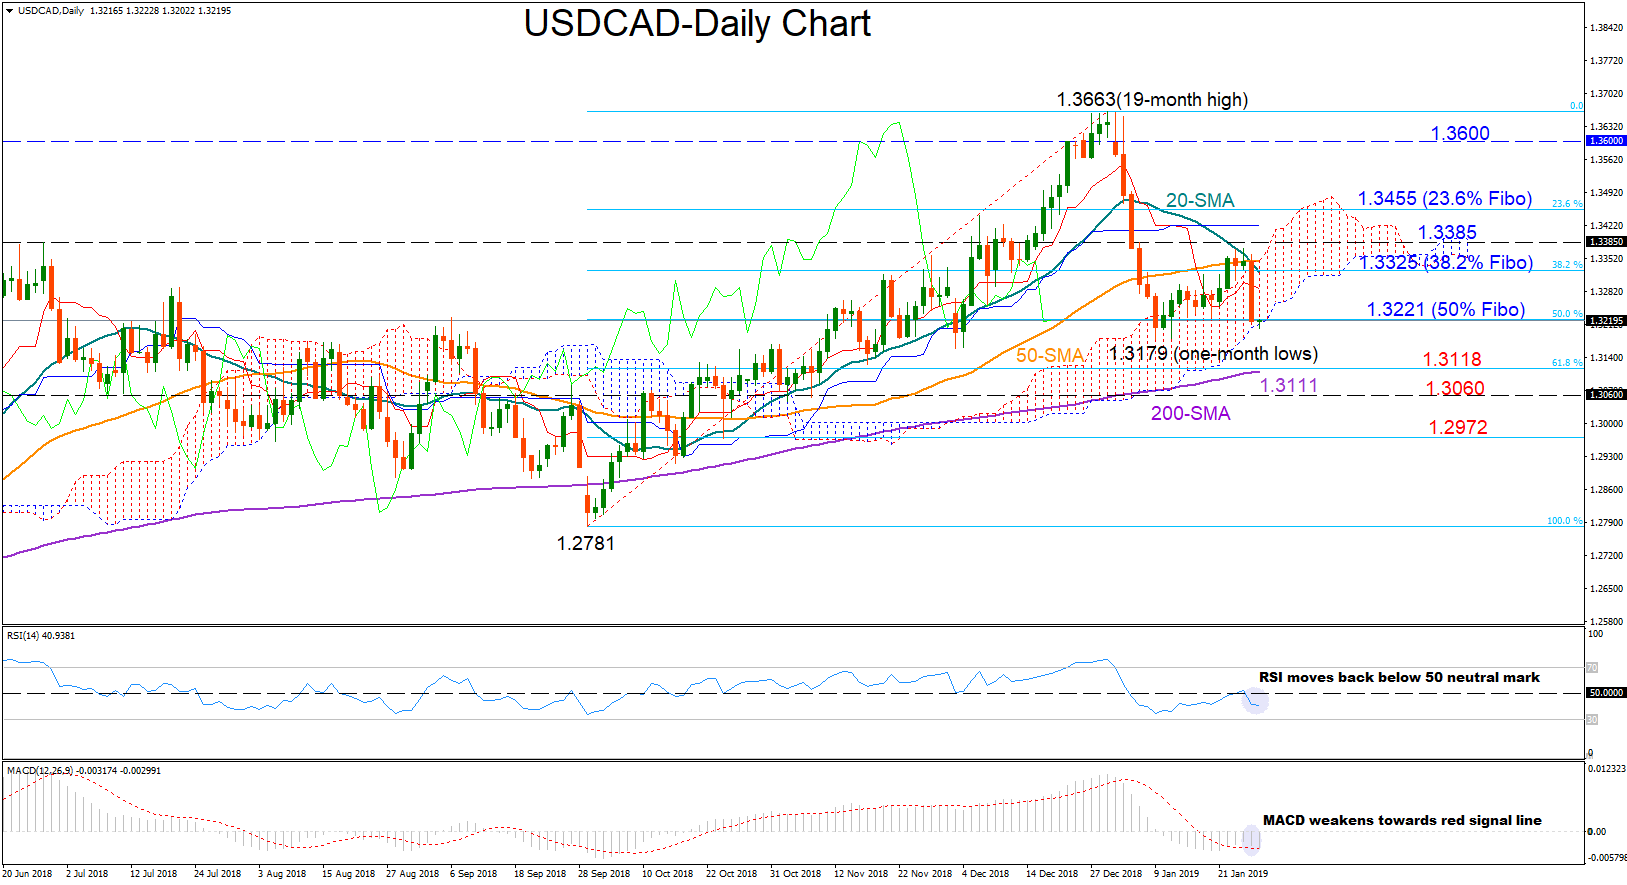
USDCAD Collapses Below 1.3300
USDCAD lost almost 1% on Friday, reversing all the gains it gathered to close negative in the previous week. While negative momentum has somewhat slowed down on Monday, the RSI and the MACD suggest that the downside is likely to continue as the former weakens below its 50 neutral threshold and the latter returns below its red signal line.
An extension lower could reach the previous low of 1.3179, whereas any violation at this point would open the way towards the 200-day simple moving average which currently stands at 1.3111; marginally below the 61.8% Fibonacci of the upleg from 1.2781 to 1.3663. Should the bears beat that obstacle too, support could then run towards the 1.3060-1.2972 congested area.
On the flipside, a rally above the 50% Fibonacci of 1.3221, could potentially stop near the 38.2% Fibonacci of 1.3325, while resistance between 1.3370-1.3385 should be kept in mind as well. Slightly higher the 23.6% Fibonacci of 1.3455 could also halt upside movements, while the 1.3600 round level is expected to be a bigger challenge as any decisive close above that mark could reassure that the uptrend off 1.2781 is not over yet.
Turning to the medium-term picture, the pair has erased half of its rebound from the 1.2781 trough, shifting the bullish outlook to a neutral one. Still, a confirmation that the bullish phase has ended, may come only below the one-month low of 1.3179.
EUR/AUD Daily Outlook
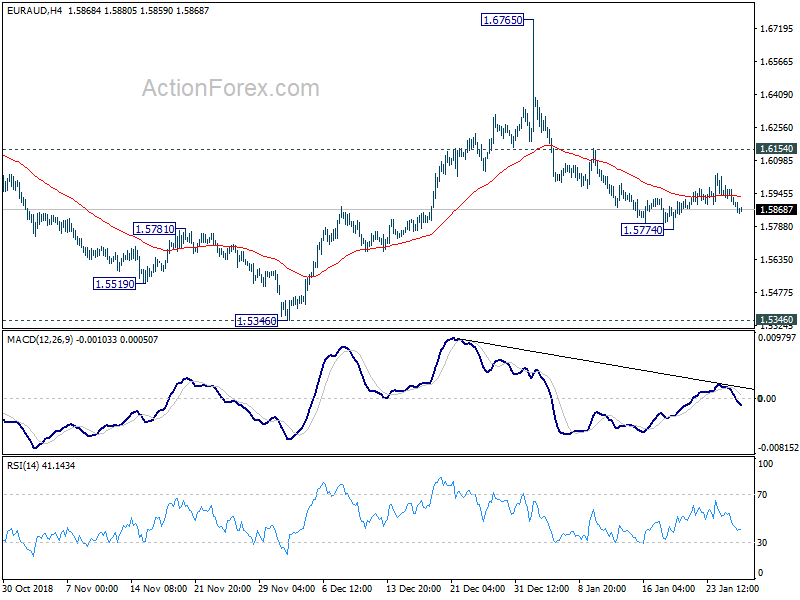
Daily Pivots: (S1) 1.5852; (P) 1.5917; (R1) 1.5954; More....
Intraday bias in EUR/AUD remains neutral as it's staying in consolidation above 1.5774. With 1.6154 resistance intact, deeper fall is expected. On the downside, break of 1.5774 will resume the decline from 1.6765 and target 1.5346 key support next. On the upside, break of 1.6154 will argue that the pull back has completed. Intraday bias will then be turned back to the upside for retesting 1.6765.
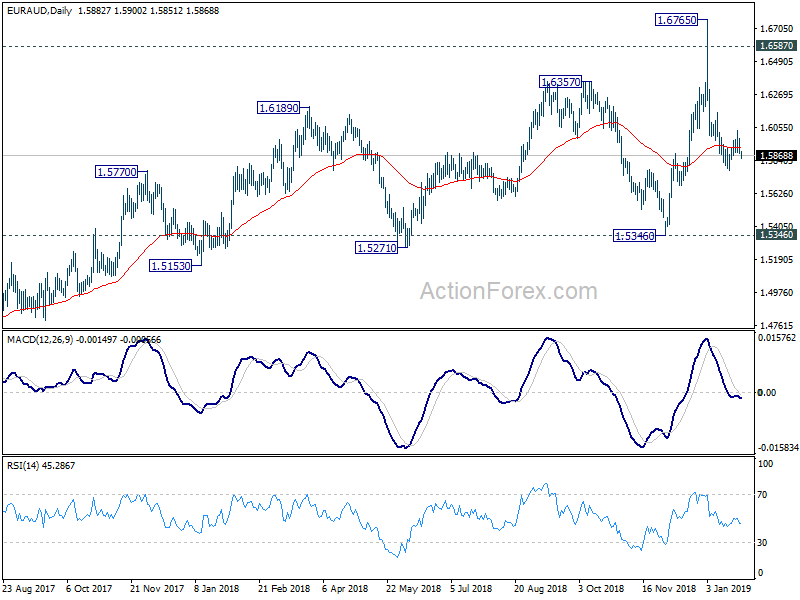
In the bigger picture, the failure to sustain above 1.6587 key resistance (2015 high) argues that up trend from 1.1602 (2012 low) is not ready to resume yet. But still, as long as 1.5346 support holds, outlook will remain bullish. Break of 1.6765 will target 61.8% retracement of 2.1127 (2008 high) to 1.1602 at 1.7488 next. However, firm break of 1.5346 key support will indicate trend reversal, with bearish divergence condition in weekly MACD, and turn outlook bearish.
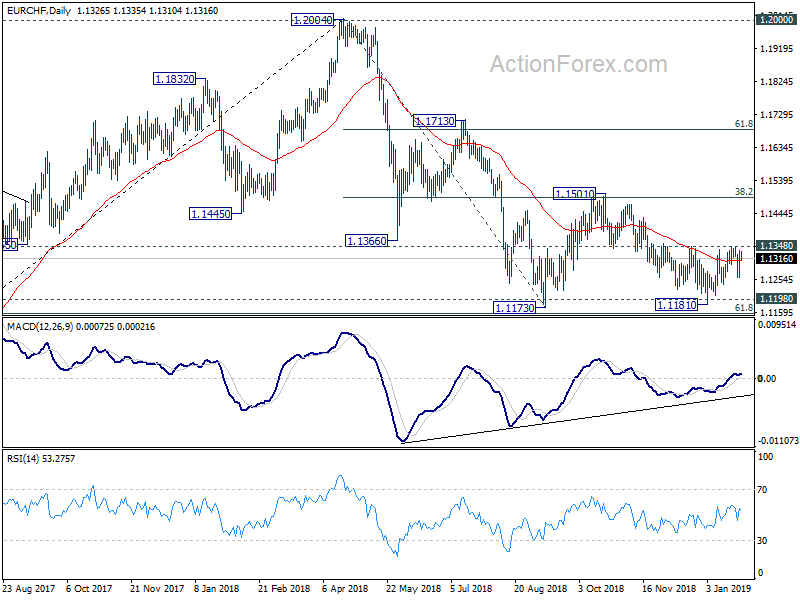
EUR/CHF Daily Outlook
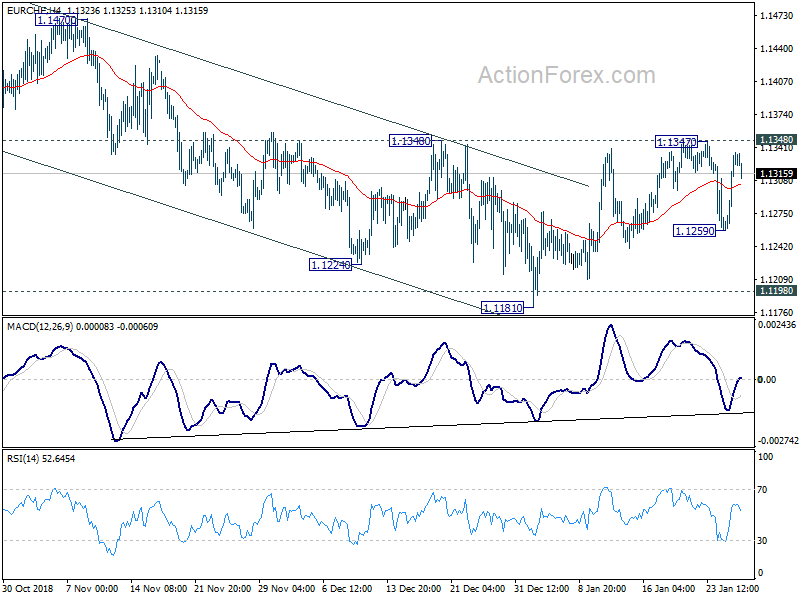
Daily Pivots: (S1) 1.1280; (P) 1.1309; (R1) 1.1360; More...
Intraday bias in EUR/CHF remains neutral at this point. We continue to favor the case that choppy decline from 1.1501 has completed at 1.1181 already. On the upside, decisive break of 1.1348 will confirm this bullish case and turn bias to the upside for retesting 1.1501 next. On the downside, in case of another fall, we'd expect strong support from 1.1154/98 support zone to contain downside to bring rebound.
In the bigger picture, price actions from 1.2004 medium term top is seen as a correction only. Downside should be contained by support zone of 1.1198 (2016 high) and 61.8% retracement of 1.0629 to 1.2004 at 1.1154 to complete it and bring rebound. A break of 1.2 key resistance is still expected in the medium term long term. However, sustained break of the mentioned support zone will mark reversal of the long term trend. In that case, 1.0629 key support will be back into focus.