Sample Category Title
USD/JPY Surges To 110.00 Level
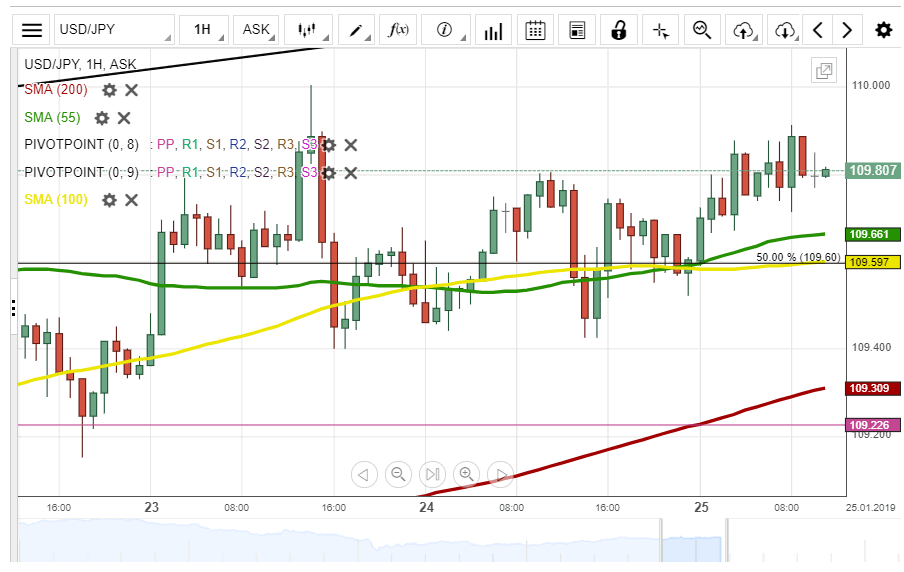
During Friday's morning hours, the currency exchange rate was located at the 109.85 mark.
In regards to the near-term future, most likely, the rate will keep surging upwards to the 110.00 level. Besides, the 55-hour simple moving average will support the rate during the day.
Moreover, the Dukascopy Analyst team predicts, that the rate might surge to the 111.00 level next week!
XAU/USD Is Retraced By 200-Hour SMA
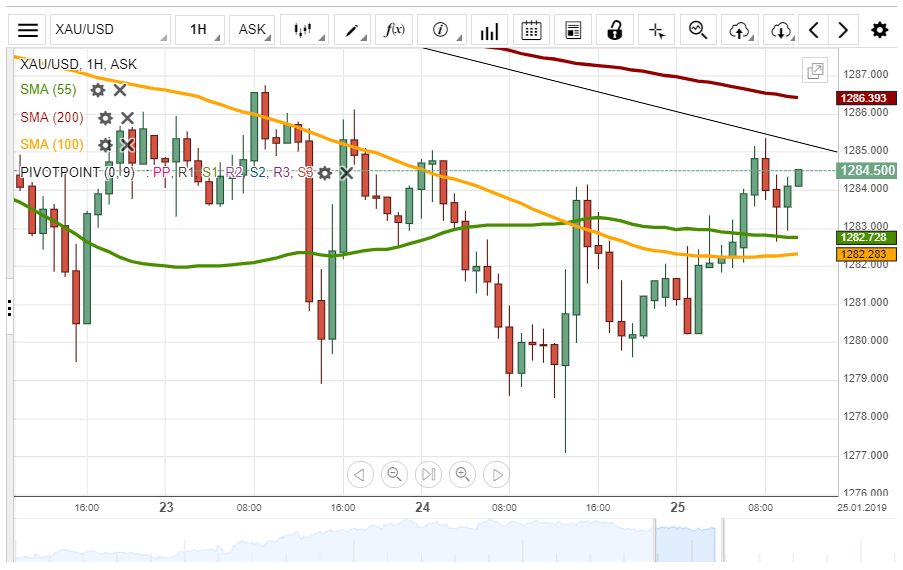
On Friday morning, the yellow metal was trading between the 200-hour and the 55-hour simple moving averages at the 1,283.19 mark.
In regards to the near-term future, most likely, the 200-hour simple moving average will retrace the gold to the 1,276.00 level.
On the other side, the 55-hour and the 100-hour simple moving averages could support the rate to break the resistance of the 200-hour SMA to the 23.60% Fibonacci retracement level at the 1,291.57 mark.
EURUSD Oversold Indicators Correcting
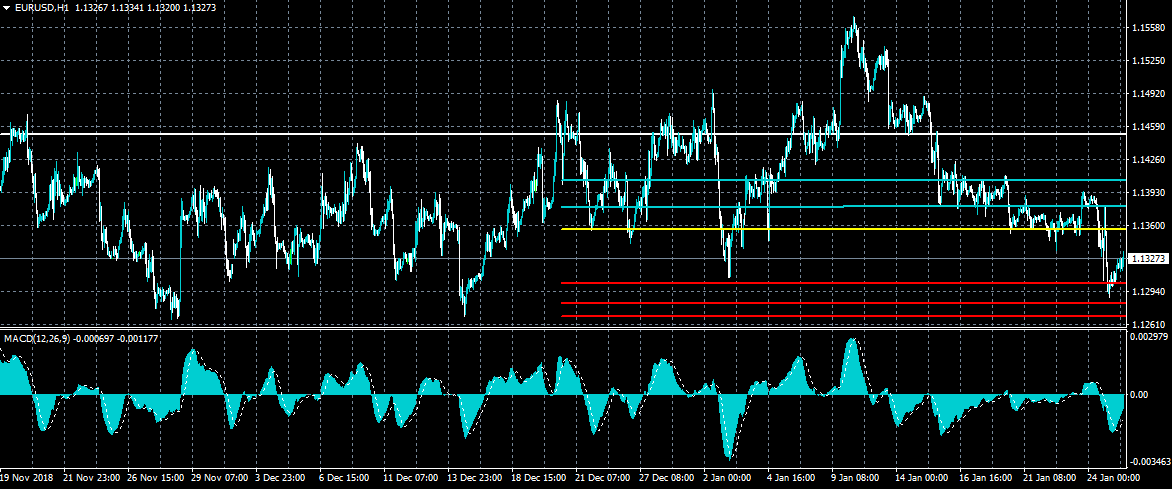
The euro has started to correct higher against the US dollar during the European trading session, with buyers still defending the 1.1300 support level. The MACD indicator is starting to trend higher on the lower time frames, although the corrective move appears weak. Overall, the trend remains bearish with the head and shoulders pattern seen across the lower time frames continuing to take shape.
The EURUSD pair is strongly bearish while trading below the 1.1300 level, key technical support is found at the 1.1260 and 1.1214 levels.
If the EURUSD pair moves above the 1.1360 level, buyers may test towards the 1.1380 and 1.1410 resistance levels.
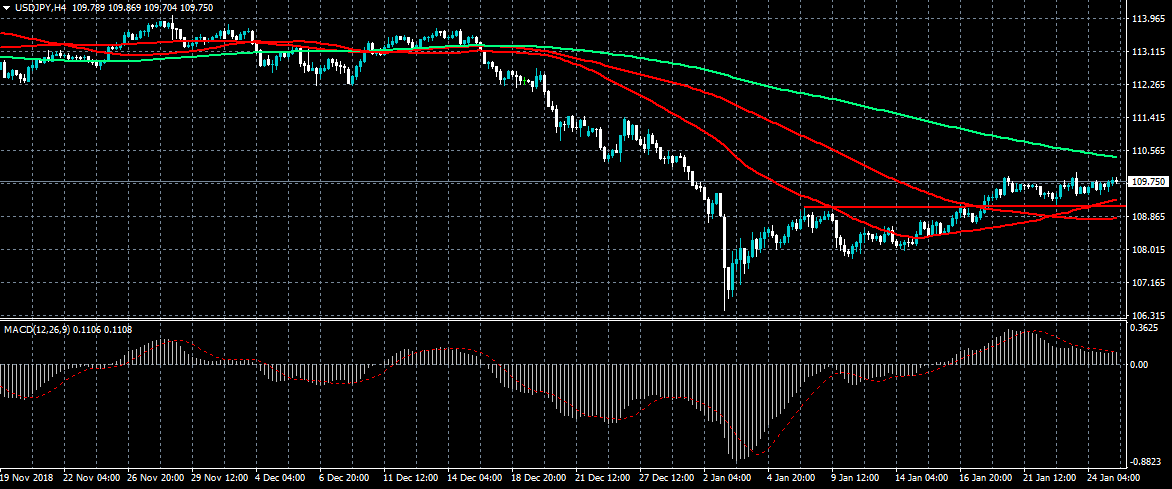
USDJPY Struggling To Find Direction
The US dollar is struggling to find a directional bias level against Japanese yen currency, with the pair largely unchanged from its opening price on Friday. Sellers may start to take control of short-term price action if buyers fail to create new higher price highs. USDJPY buyers need to break above the key 110.00 level to encourage technical buying towards the 110.40 resistance area.
The USDJPY pair is intraday bearish while trading below the 109.60 level, key technical support is found at the 109.14 and 108.85 levels.
If the USDJPY pair moves above the 110.00 level, buyers may test towards the 110.40 and 110.80 levels.
GBPJPY Retreats From 7-Week High, Holds In Upward Sloping Channel
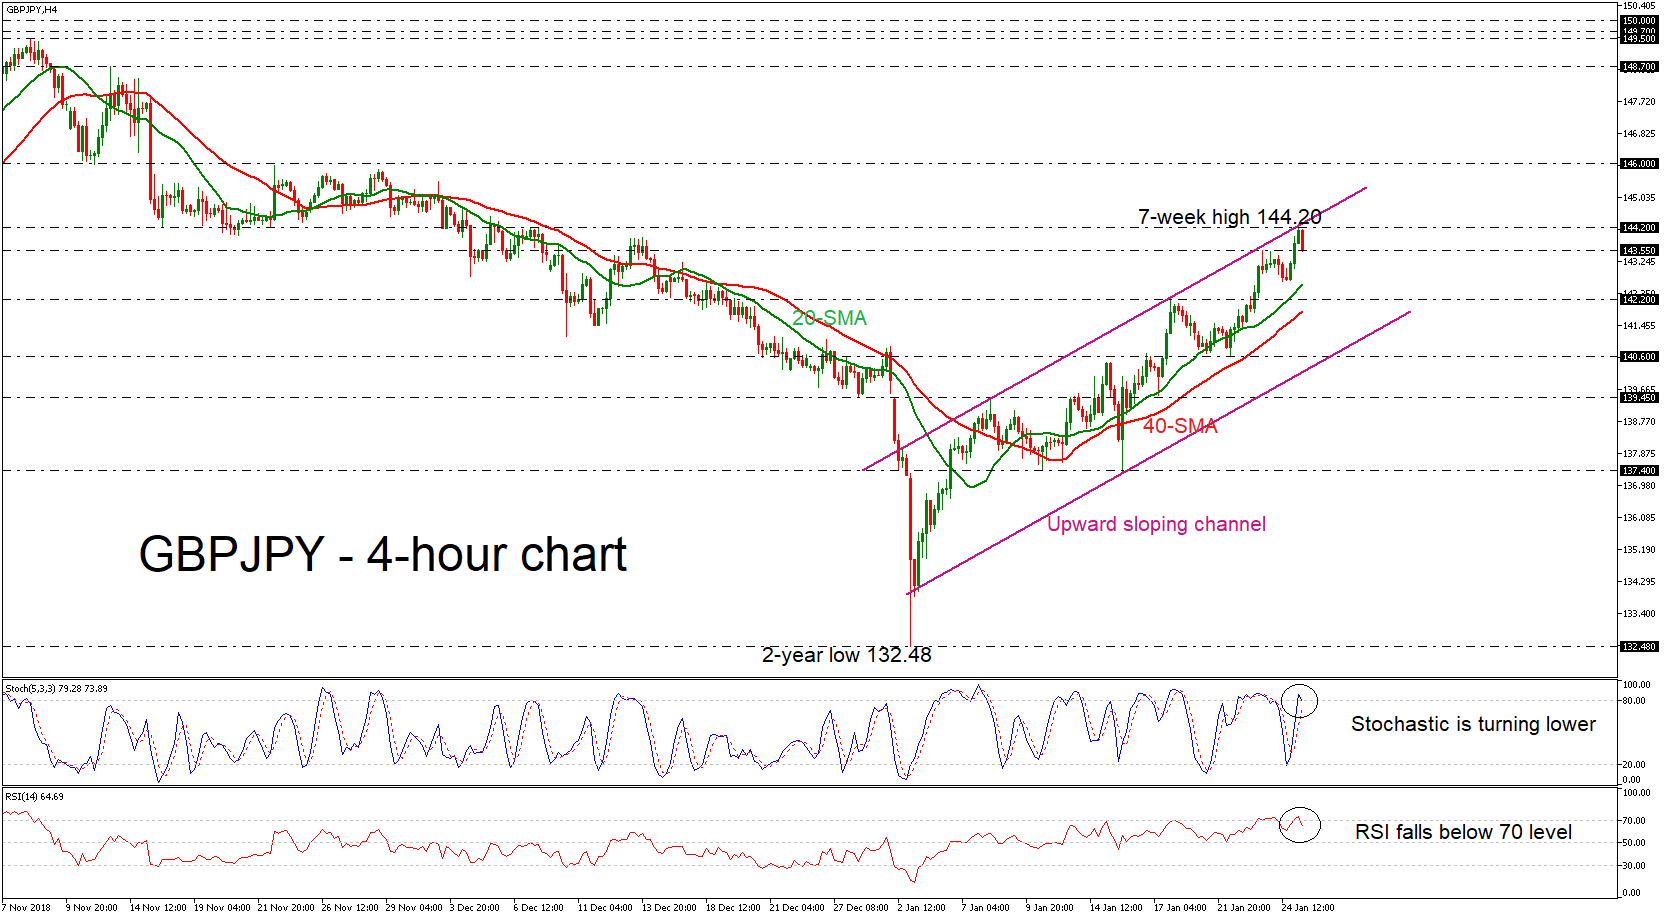
GBPJPY has rebounded somewhat from the seven-week high of 144.20 that it reached earlier today. Currently, the price has been stuck in a channel tilted to the upside following the pullback on the more than two-year low of 132.48. The stochastic oscillator is turning to the downside and the RSI has slipped below the overbought level and is approaching the neutral threshold of 50.
If prices continue to head lower, support should come from the 20-day simple moving average (SMA) near the 142.65 mark. A drop below the 20-day SMA would reinforce the negative move and open the way towards the 142.20 level, which has been a major support and resistance area in the past. More losses could open the door for the 140.60 hurdle
Should the pair manage to strengthen its positive momentum, the next resistance could come around the 146.00 strong psychological level, where it topped on November 22. If there is a break above this region, the next target could come in 148.70, taken from the high on November 13.
Having a look at the bigger structure, GBPJPY is trying to switch the bearish structure to a more bullish one but first needs to jump above the 146.00 area.
The Analytical Overview Of The Main Currency Pairs
The EUR/USD currency pair
Technical indicators of the currency pair:
Prev Open: 1.13803
Open: 1.13010
% chg. over the last day: -0.59
Day's range: 1.13205 – 1.13345
52 wk range: 1.1214 – 1.2557
Yesterday EUR/USD saw aggressive sell-offs. EUR is weakened against the USD due to the statements by the Mario Draghi that the EU economic reports are below the forecasted. However, the key interest rate remained without any changes, just as expected. You should open positions from the key levels of 1.13100 and 1.13400. The trading instrument begins to recover.
The Economic News Feed for 25.01.2019:
IFO Business Climate Index (GER) – 11:00 (GMT+2:00);
Basis Orders on Durable Goods (US) – 15:30 (GMT+2:00);
Primary Real Estate Sales (US) – 17:00 (GMT+2:00);
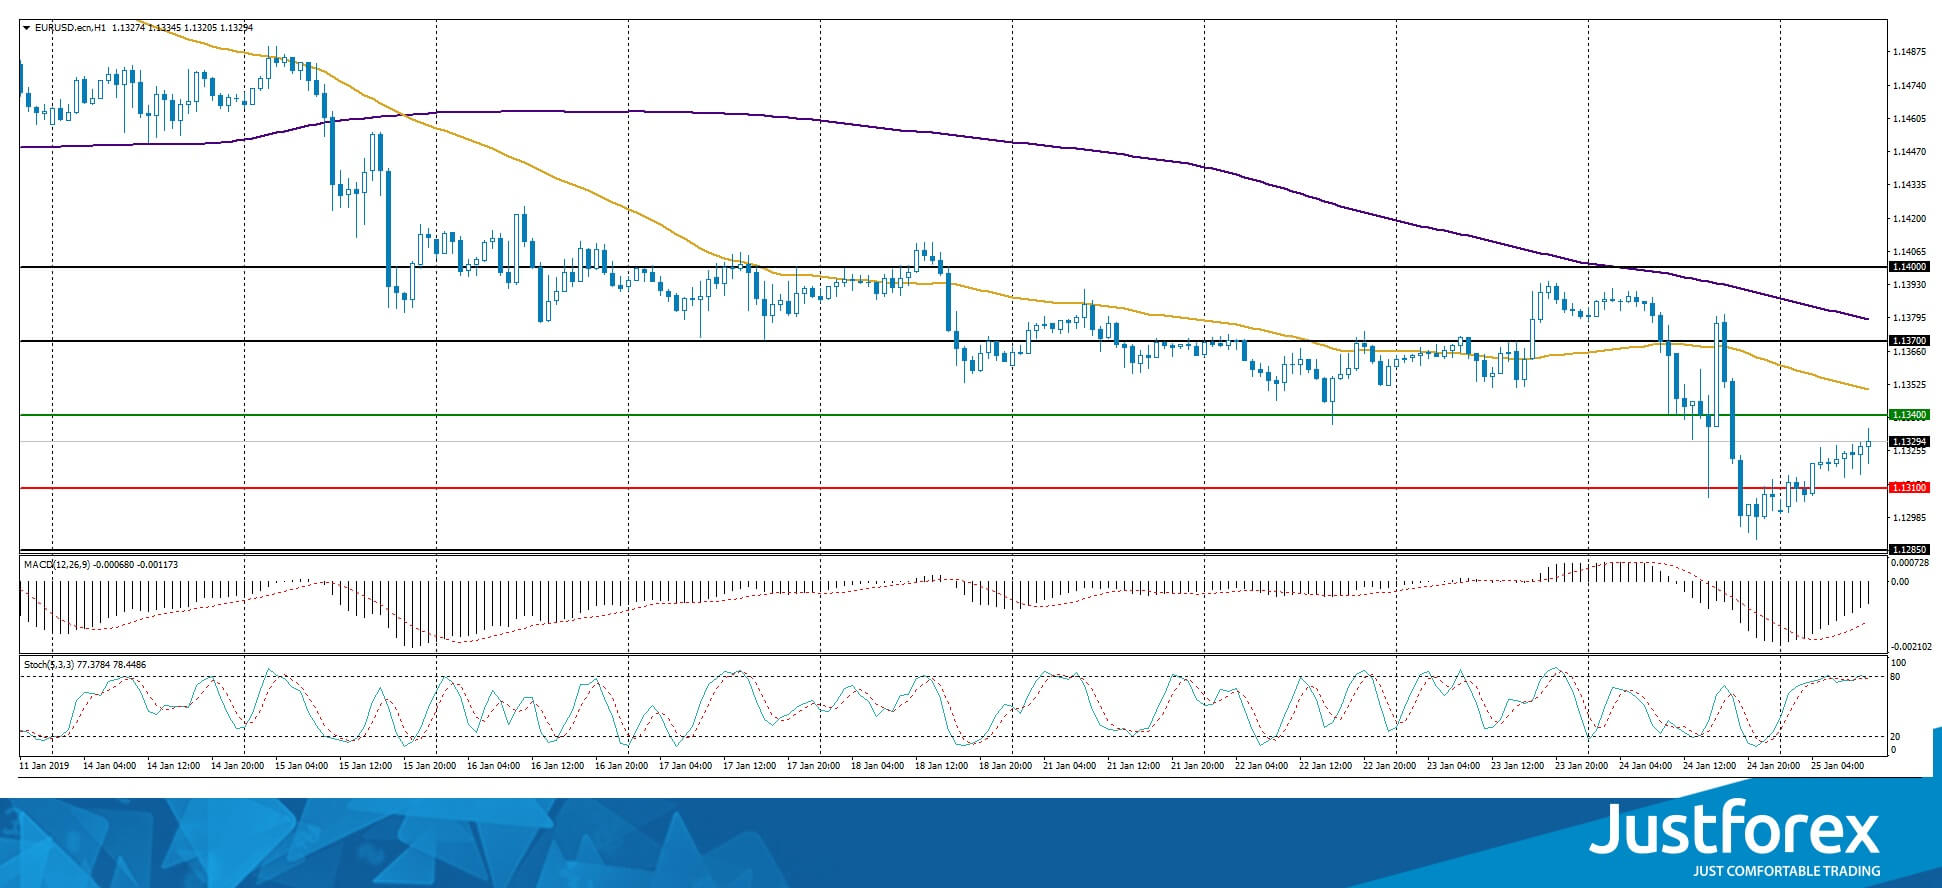
The indicators point to the power of the sellers, the price fixed below 50 MA and 200 MA.
The MACD histogram is in the negative zone but above the signal line, which gives a weak signal to sell EUR/USD.
The Stochastic Oscillator is near the overbought zone, the %K line is crossing the %D line. There are no signals.
Trading recommendations
Support levels: 1.13100, 1.12850
Resistance levels: 1.13400, 1.13700, 1.14000
If the price fixes below 1.130100 expect the EUR/USD quotes to fall toward 1.12850-1.12500.
Alternatively, the currency pair can grow toward 1.13700-1.14000.
The GBP/USD currency pair
Technical indicators of the currency pair:
Prev Open: 1.30680
Open: 1.30624
% chg. over the last day: +0.39
Day's range: 1.30700 – 1.30890
52 wk range: 1.2438 – 1.4378
Yesterday, GBP/USD was in a variety of trends. The GBP was supported by the news that the Democratic Union Party of Northern Ireland decided to approve of the Theresa May`s Brexit plan next week. You should open positions from the key levels of 1.30600 and 1.31200. The trading instrument has prospects to descend further.
The Economic News Feed for 25.01.2019 is calm.
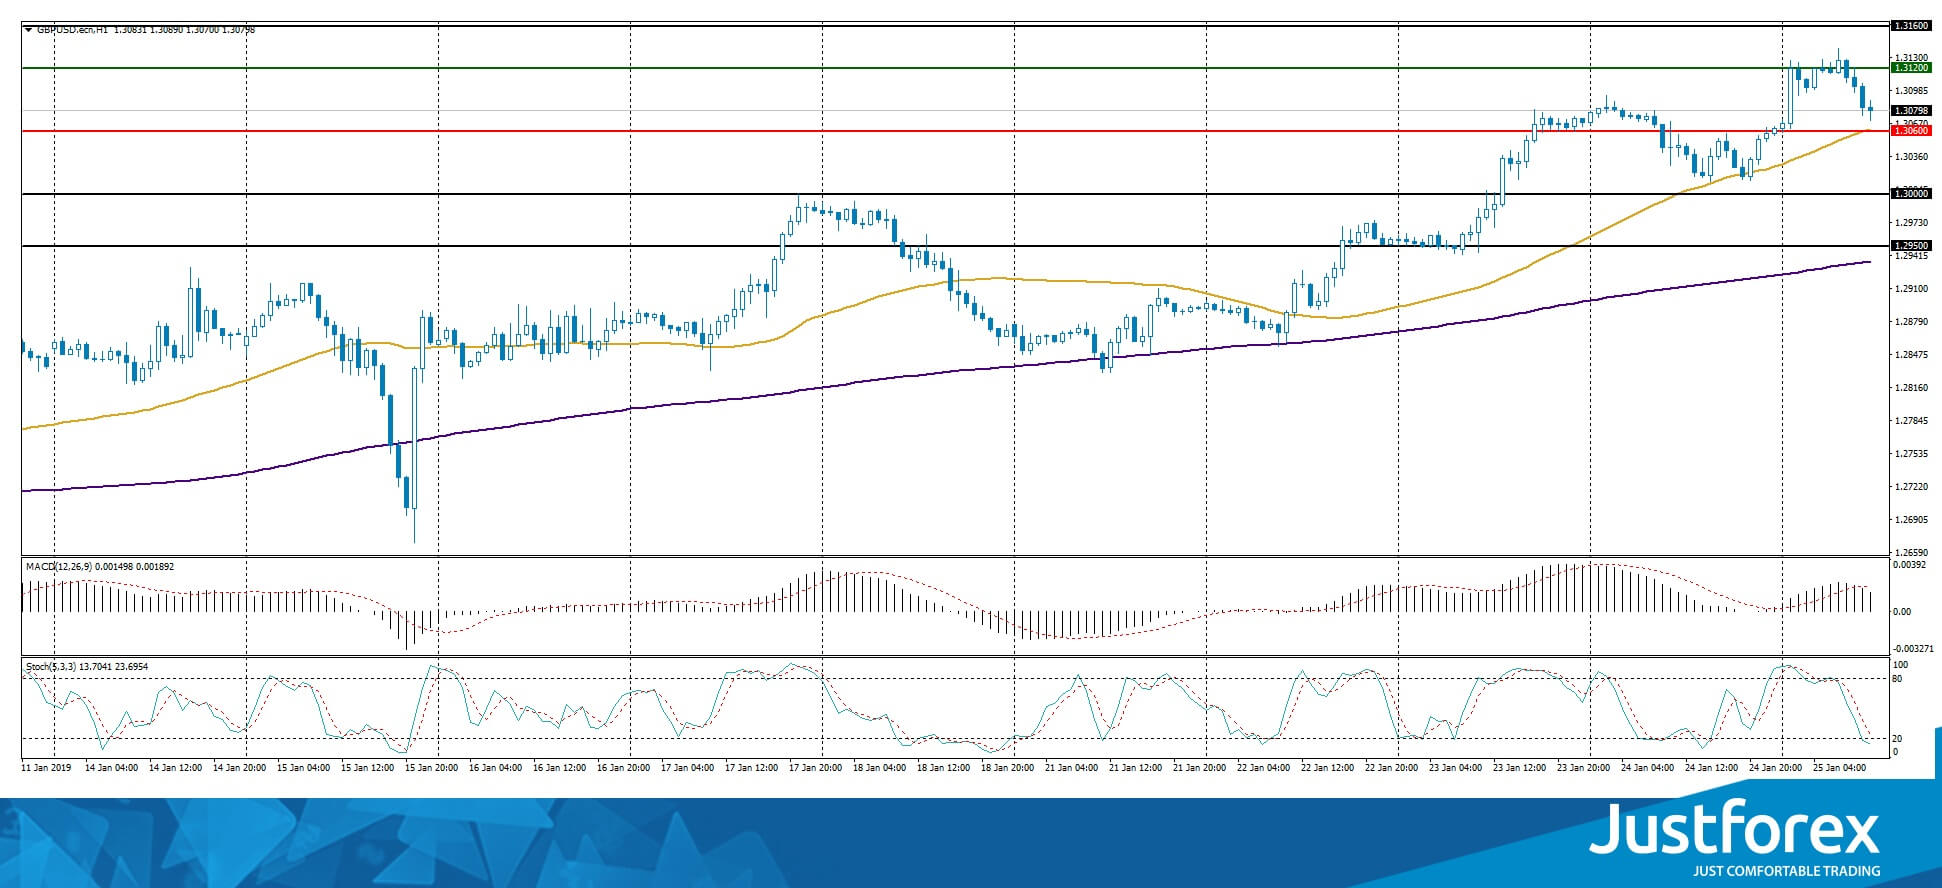
The indicators point to the power of the byers, the price fixed above 50 MA and 200 MA.
The MACD histogram is in the positive zone but below the signal line, which gives a weak signal to buy GBP/USD.
The Stochastic Oscillator is near the oversold zone, the %K line is below the %D line which points to a bearish mood.
Trading recommendations
Support levels: 1.30600, 1.30000, 1.29500
Resistance levels: 1.31200, 1.31600
If the price fixes below 1.30600, the quotes are going to fall towards the round 1.30000.
Alternatively, the quotes can rise toward 1.31600-1.31800.
The USD/CAD currency pair
Technical indicators of the currency pair:
Prev Open: 1.33400
Open: 1.33455
% chg. over the last day: +0.08
Day's range: 1.33121 – 1.33278
52 wk range: 1.2248 – 1.3664
Yesterday USD/CAD remained in a variety of trends. Right now the technical picture is still ambiguous as the investors await the additional drivers. The key levels are 1.33100 and 1.33400. You should open positions from these levels and keep an eye on the oil quotes dynamics.
The Economic News Feed for 25.01.2019 is calm.
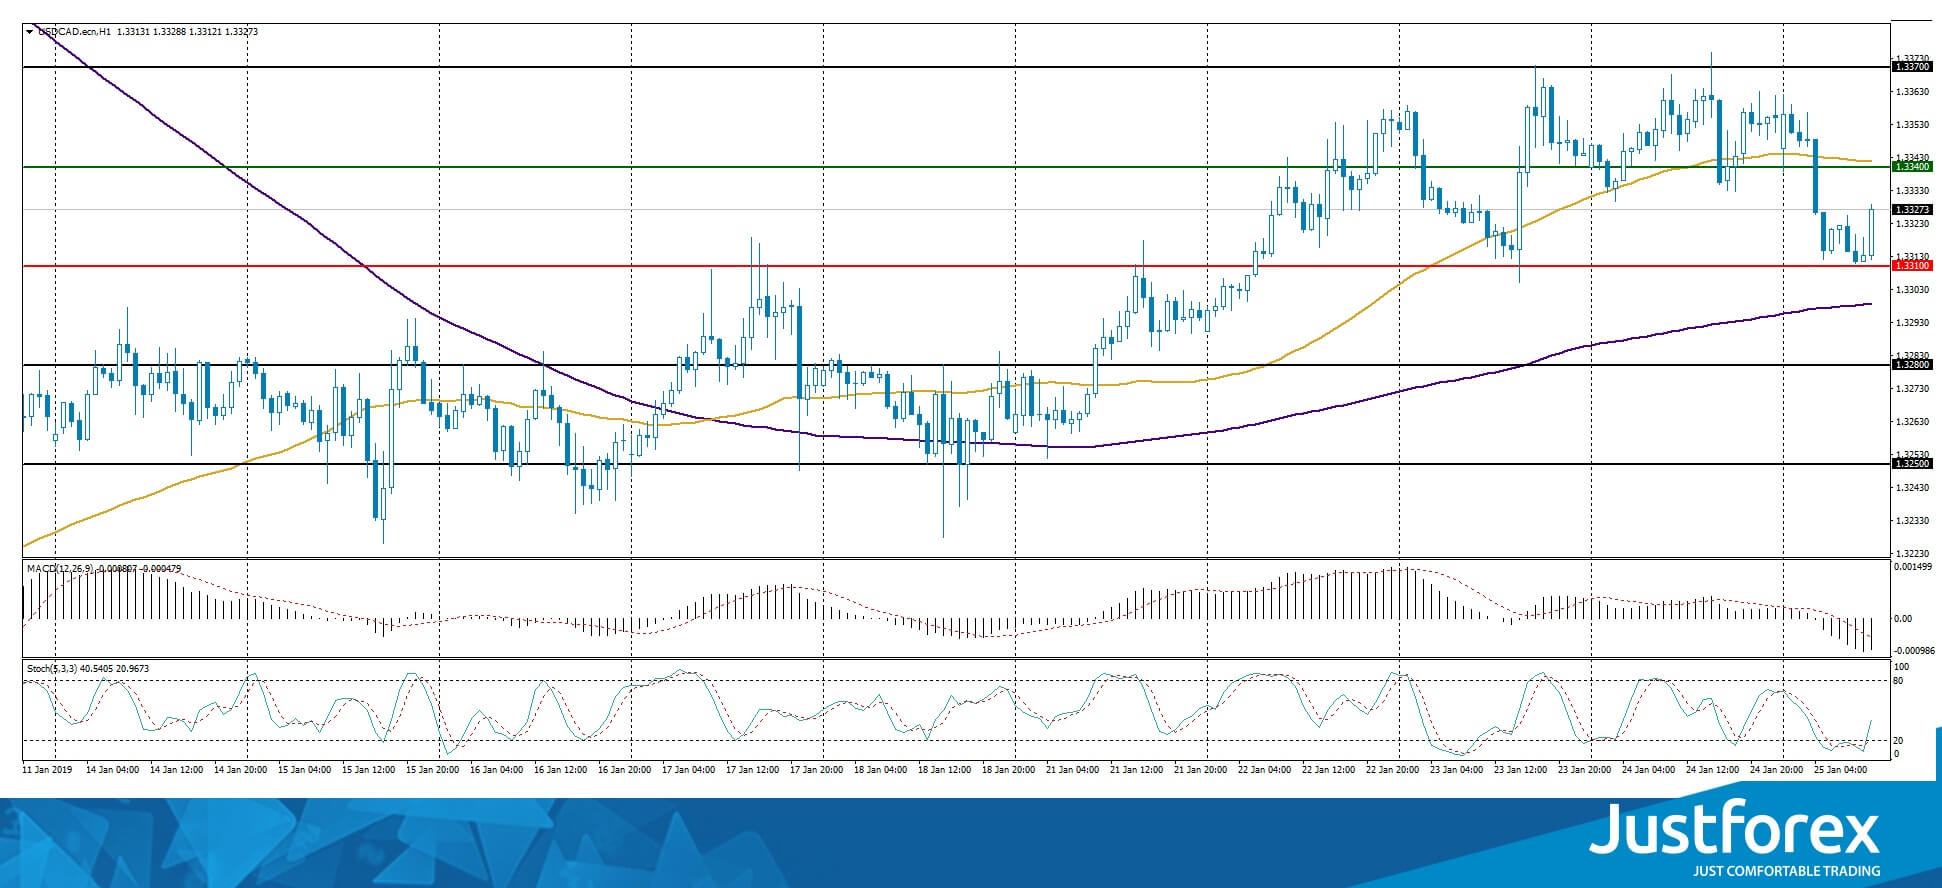
The price fixed between 50 MA and 200 MA which act as the dynamic support and resistance levels.
The MACD histogram is in the negative zone and below the signal line which gives a strong signal to sell USD/CAD.
The Stochastic Oscillator is in the oversold zone, the %K line is crossing the %D line. There are no signals.
Trading recommendations
Support levels: 1.33100, 1.32800, 1.32500
Resistance levels: 1.33400, 1.33700
If the price fixes above the mirror support of 1.33400, consider buying USD/CAD. The price will move toward 1.33700-1.34000.
Alternatively the quotes can fall toward 1.32800-1.32500.
The USD/JPY currency pair
Technical indicators of the currency pair:
Prev Open: 109.564
Open: 109.625
% chg. over the last day: +0.00
Day's range: 109.811 – 109.822
52 wk range: 104.56 – 114.56
USD/JPY is currently in a variety of trends. The investors are waiting for additional divers. The key levels are 109.700 and 110.000. You should open positions from these levels. Keep an eye on the US Treasury 10-year yield.
The Economic News Feed for 25.01.2019 is calm.
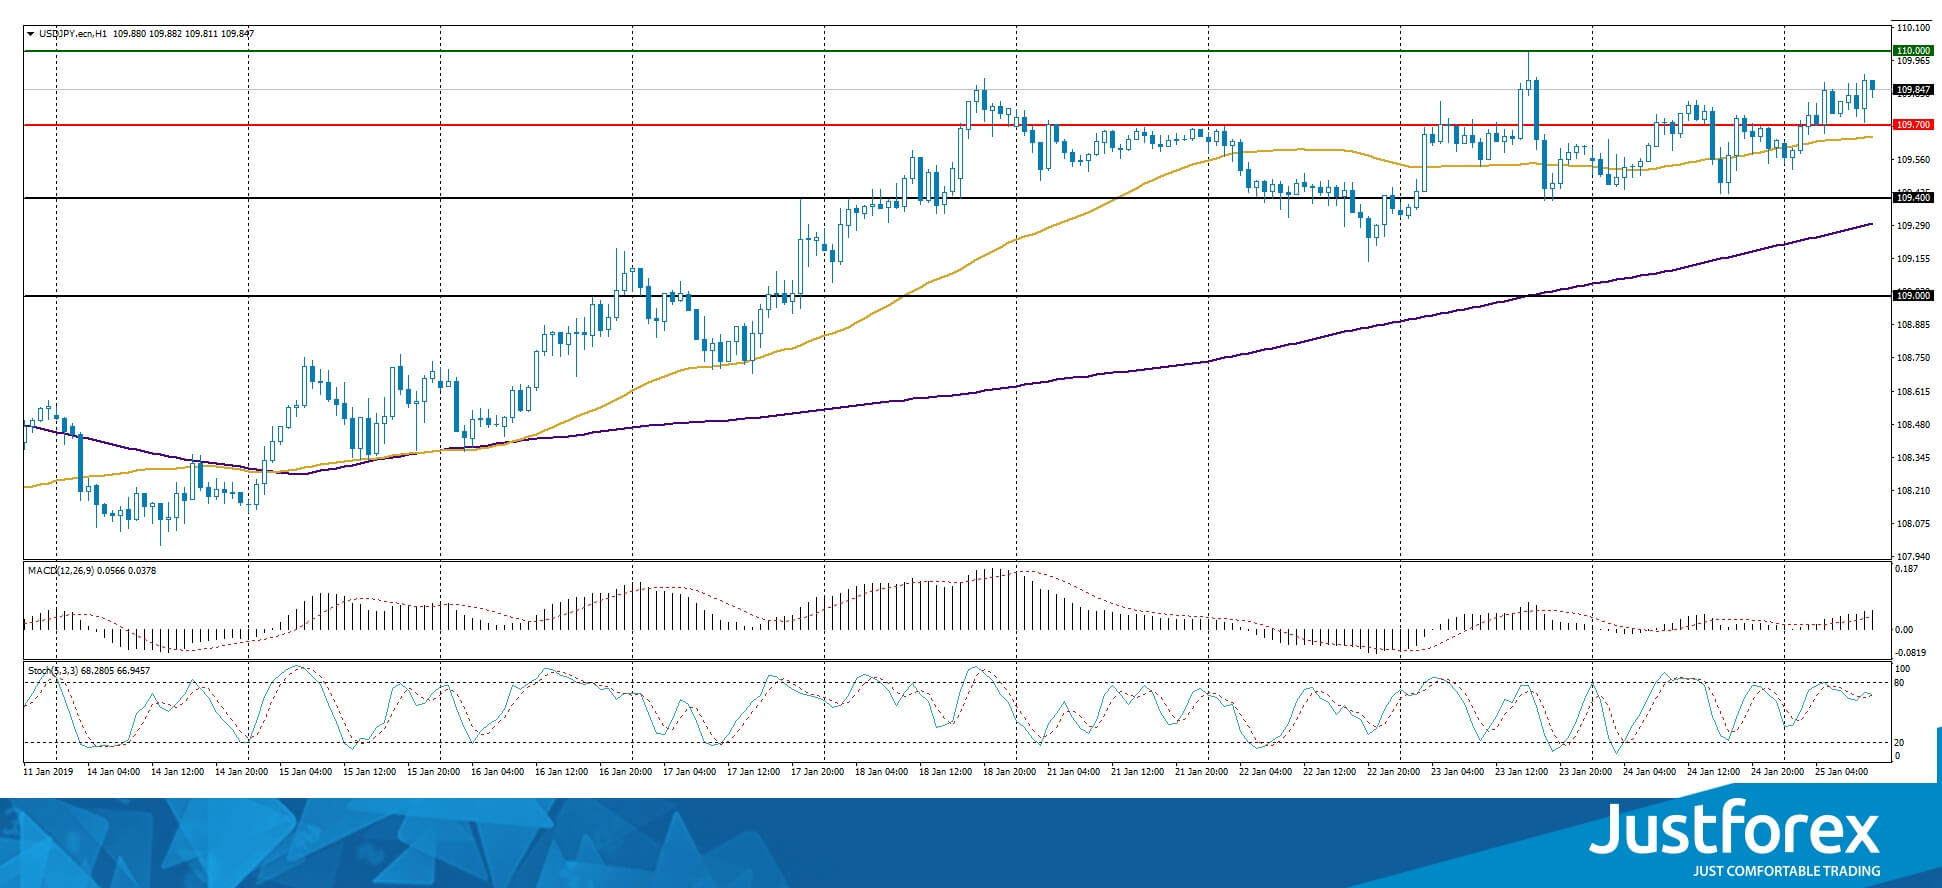
The price fixed above 50 MA and 200 MA which points to the power of the buyers.
The MACD histogram is in the positive zone and above the signal line which gives a strong signal to buy USD/JPY.
The Stochastic Oscillator is in the neutral zone, the %K line is crossing the %D line. There are no signals.
Trading recommendations
Support levels: 109.700, 109.400, 109.000
Resistance levels: 110.000, 110.250
If the price fixes above the round 110.000 consider buying USD/JPY. The movement will tend toward 110.250-110.500.
Alternatively the quotes can fall toward 109.400-109.000.
The US Dollar Index Is In Plus
The US dollar strengthened slightly against a basket of major currencies. Yesterday, the White House Press Secretary, Sarah Sanders, said that the US President, Donald Trump, would consider a bill to end the US government shutdown if it would contain funds to build a wall on the border with Mexico. It should be recalled that the US government has not worked for more than a month since December 22. The US dollar index (#DX) closed yesterday in the positive zone (+0.55).
The British pound strengthened against the US dollar amid news that the Democratic Unionist Party of Northern Ireland intends to support the Brexit plan proposed by Theresa May next week. On January 29, a vote on Theresa May's Brexit plan B should take place.
The euro weakened against the US currency. Yesterday, the ECB left the interest rate unchanged at 0.00%, as experts expected. However, at the ECB press conference, Mario Draghi said that the economic data of the Eurozone is still lower than forecasted. The head of the ECB believes that economic growth will continue to slow down in the near future.
The "black gold" prices are rising due to concerns of reducing the supply of fuel from Venezuela. At the moment, futures for WTI crude oil are testing the mark of $53.60 per barrel. At 20:00 (GMT+2:00) the US Baker Hughes total rig count will be published.
Market Indicators
- Yesterday, there was a variety of trends in the US stock market: #SPY (+0.05%), #DIA (-0.10%), #QQQ (+0.65%).
- The 10-year US government bonds yield fell slightly. At the moment, the indicator is at the level of 2.74-2.75%.
The News Feed on 25.01.2019:
- German IFO business climate index at 11:00 (GMT+2:00);
- Core durable goods orders in the US at 15:30 (GMT+2:00);
- New home sales in the US at 17:00 (GMT+2:00).
EUR/USD – Euro Shrugs As German Business Climate Falls
EUR/USD has steadied in the Friday session, after posting considerable losses on Thursday. Currently, the pair is trading at 1.1317, down 0.23% on the day. On the release front, it’s a quiet end to the week. The sole eurozone events, German Ifo Business Climate, fell for a fifth successive month, dropping to 99.1 points. There are no U.S events on the schedule.
There were no surprises from the ECB on Thursday, as the central bank maintained policy as well as guidance for “rates to remain at their present levels at least through the summer of 2019”. With the ECB finally winding up its massive stimulus scheme, market focus has shifted to the timing of a rate hike. However, with the eurozone economy showing signs of weakness, we’re unlikely to see a rate hike before the fourth quarter, at the earliest. The ECB remains cautious, and said that risks “have moved to the downside”. This dovish stance indicates that the euro will not be receiving any support from the bank, and will have to rely on stronger data in order to attract investors.
The eurozone manufacturing sector continues to show worrying signs of a slowdown. Eurozone manufacturing PMI fell to 50.5, just above the 50-point threshold which separates contraction from expansion. This marked a six successive drop in the score. Germany fared even worse, as manufacturing PMI slipped to 49.7, pointing to contraction. It was the lowest reading since June 2013. The weak reading underscore the toll that the global trade war has taken on the eurozone and German economies, with less demand for exports weighing on manufacturing production.
Stocks Higher As Weekly Losses Pared
It's been a mixed week for markets but stocks are in the green in Europe on Friday and US futures are pointing to similar gains at the open.
Trade negotiations between the US and China continue to be a major focal point for investors, with an apparent softening of tensions since the G20 in December contributing to the improved risk appetite we're currently seeing. The rhetoric coming from these talks has broadly been positive but this week, it has been a little mixed suggesting talks may have stalled with just over a month to go until the 90 day deadline.
Claims on Thursday by Wilbur Ross that the two sides are "miles and miles away" from an agreement with "lots and lots of issues" come on the back of speculation earlier in the week that planned preparatory talks - ahead of a meeting at the end of the month - had been cancelled. This was denied by Larry Kudlow, although that failed to kill suspicions that talks aren't going as well as previously claimed.
This is keeping the dollar supported throughout the week, with the greenback having previously performed well when relations have deteriorated. It is paring gains today though, off around 0.2%, but this is probably just a case of profit taking heading into the weekend and a belief that progress is still being made, regardless of any setbacks we may now be seeing.
That's providing some relief for gold which has been wrestling with $1,280 throughout the week. This has been a challenge against the backdrop of a stronger dollar, which is typically a negative for gold prices. A pause in the stock market has probably helped support gold, with the rally over the last few weeks having weighed on the traditional safe haven. The two key levels here remain unchanged - $1,300 to the upside and $1,280 to the downside – heading into what could be a very turbulent week.
Oil prices have pared gains from earlier in the European session. WTI and Brent had previously trading more than 1% higher, despite EIA having reported a large inventory build – eight million barrels - a day earlier. This comes as tensions escalate over Venezuela, with the US and others no longer recognising Nicolas Maduro as President, much to the disapproval of Russia and China. Both continue to face key resistance around $65 (Brent) and $55 (WTI), a break of which could be the catalyst for a much stronger move higher.
EUR/USD Outlook: Bounce Is Seen As Positioning For Fresh Weakness, Daily Cloud Base To Cap Upticks
The Euro edged higher in early Friday's trading as traders booked profit after Thursday's 0.7% daily fall, sparked by dovish stance from ECB chief Mario Draghi, who highlighted further downside risk and weaker than expected near-future economic data.
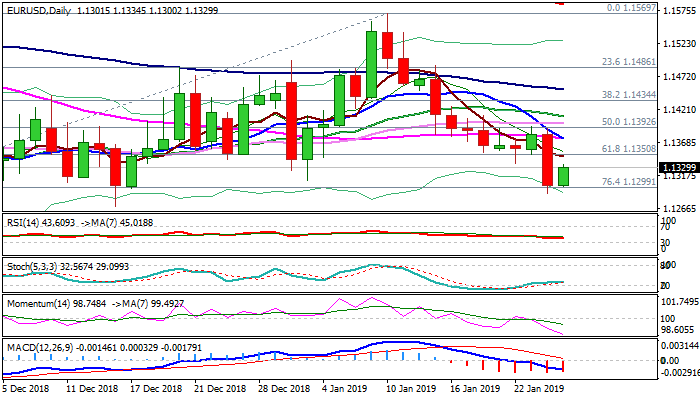
Extension of larger downtrend from 1.1569 (2019 high) generated strong bearish signal on Thursday's close below key support at 1.1350 (daily cloud base/Fibo 61.8% of 1.1215/1.1569 rally).
In addition to weak PMI's and soft tone from ECB, another negative factor was release of weaker than expected German Ifo business climate data which came at 99.1, undershooting forecast at 100.7. Recovery action wasn't affected by weak data so far, as traders took profit after Thursday's fall and positioning for fresh downside. Daily studies in full bearish setup support scenario, with extended corrective upticks to be capped under broken 1.1350 pivot and maintain bearish bias. Break below cracked Fibo support at 1.1299 (Fibo 76.4% of 1.1215/1.1569) would expose a double-bottom at 1.1267/69 (28 Nov/14 Dec lows) and open way towards key med-term support at 1.1215 (2018 low posted on 12 Nov).
Res: 1.1334, 1.1350, 1.1375, 1.1409
Sup: 1.1300, 1.1269, 1.1215, 1.1186