Sample Category Title
Stocks Rise as Fed Considers Early End to Balance Sheet Shrinking
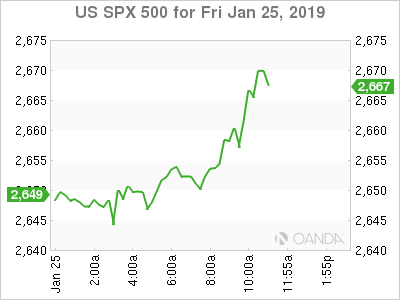
US stocks open widely higher after the Wall Street Journal reported that that the Fed is considering to weigh an earlier than expected end to the bond portfolio runoff. Stocks were punished last month when Fed Chair Powell said the balance sheet downsizing was on automatic pilot. The Fed also was very coy in giving specifics on when the balance sheet could end. The report noted that a survey of financial institutions by the New York Fed could see the portfolio which is around $4 trillion right now, shrink to $3.5 trillion, higher than than prior estimates of $1.5 trillion to $3.0 trillion. The S&P 500 is up 1.1% and the Nasdaq is higher by 1.2%.
Both European and Asian equities finished the week on a positive note, shrugging off trade war concerns and the German IFO survey which is supportive to the view that the ECB is nowhere near raising rates this year. Risk assets were also supported by hope that US may have a stopgap solution to end the partial government shutdown. Safe-haven currencies also fell driving both the dollar and yen lower against the high-beta currencies.
Week Ahead – Dollar to Seek Direction from Trade Talks, FOMC and NFP; Eurozone GDP and Aussie Inflation also...
The next seven days will be an important one for the US dollar as high-level US-Sino trade talks, the policy meeting by the Federal Reserve as well as key data releases will likely determine the currency’s next turn. The Australian dollar will also be in focus as inflation and other closely-watched indicators will be on the agenda, while in the Eurozone, flash GDP estimates could exert more negative pressure on the beleaguered euro.
Aussie vulnerable from Australian inflation and Chinese PMIs
The Australian dollar posted some significant losses this week on rising expectations that the Reserve Bank of Australia could cut rates later this year. Any signs of weakness therefore from the raft of data due from Australia and China could put the aussie back on a negative footing. First on the horizon are Chinese industrial profits for December on Monday, followed by the National Australia Bank’s business confidence gauge on Tuesday, also for December.
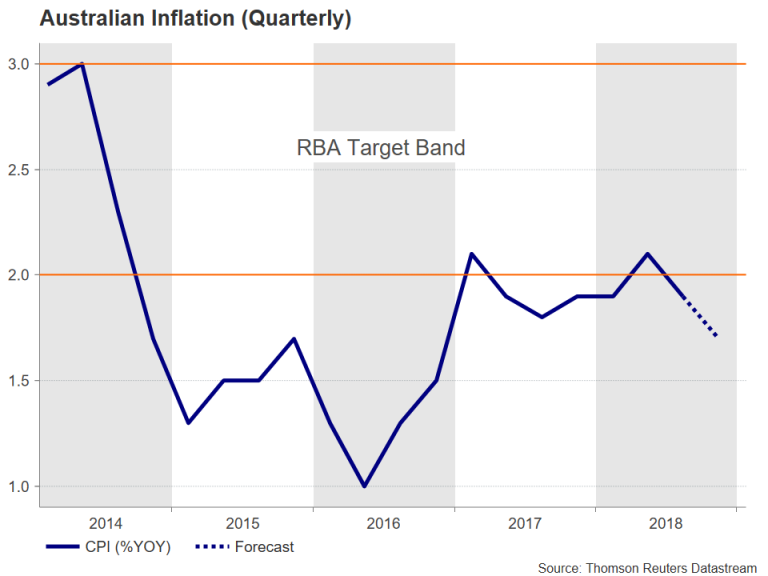
The highlight will be Wednesday’s inflation report for the fourth quarter out of Australia. The quarterly rate of CPI is forecast to have risen by 0.4% in the final three months of 2018, which would produce an annual rate of 1.7%. If confirmed, this would represent a 0.2 percentage points slowdown from the prior quarter and a further deviation from the RBA’s 2-3% target band.
The inflation theme will continue on Thursday and Friday with the release of export prices and the producer price index, respectively, both for the fourth quarter. Private sector lending figures are also out on Thursday, along with China’s official manufacturing PMI. The Caixin/Markit manufacturing PMI will follow suit on Friday. Both indices are forecast to slip further into negative territory in January, underlining the weakening picture in the world’s second largest economy.
Japanese economy to remain under the spotlight
After the BoJ meeting and worse-than-expected export numbers this past week, investors will be watching retail sales, industrial output and unemployment figures for December for clues on whether the slump in manufacturing is becoming broader based. Retails sales and industrial production are up first, with the job numbers coming up on Friday.
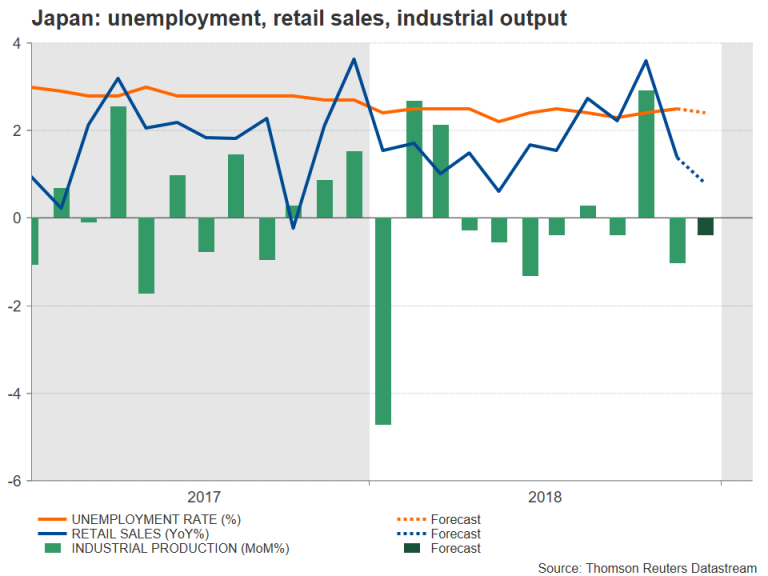
The yen is unlikely to see significant action from the data, but traders could respond to Thursday’s Summary of Opinions of the Bank of Japan’s policy meeting held during the past week. The Bank lowered its forecast for inflation and the Governor, Haruhiko Kuroda, warned of growing downside risks at his press conference. Should the Summary reveal even deeper concerns by other board members about the worsening outlook, the yen could face some downside pressure.
More pain, no joy from Eurozone GDP data
The euro slipped to a 5-week low of $1.1286 on Thursday as ECB President, Mario Draghi, answered reporters’ questions at the bank’s post-meeting press briefing. Draghi acknowledged for the first time that “the risks surrounding the euro area growth outlook have moved to the downside”. His downbeat remarks will likely bring next week’s releases under intense scrutiny, especially the GDP estimates.
But first on the Eurozone calendar is the economic sentiment indicator on Wednesday. The index is forecast to drop to a fresh two-year low in January, in further evidence of deteriorating conditions in the euro area. On Thursday, the first estimate of GDP growth for the fourth quarter will be attracting headlines. The Eurozone economy is projected to have expanded by lowly 0.2% quarter-on-quarter. This would be unchanged from the prior period but would bring the annual rate down to just 1.2%. A lower-than-expected reading could pull the euro to fresh lows versus the greenback and possibly threaten the $1.12 handle. In addition to the Eurozone-wide numbers, investors will also be watching France’s and Italy’s growth estimates on Wednesday and Thursday, respectively, as there are concerns that the two economies are headed for contraction in the first quarter and Italy could already be in recession.

Last but not least, the flash inflation readings for January will be important too. Headline inflation in the euro bloc is expected to ease further in January to 1.4% year-on-year.
Pound bulls pin hopes on EU Withdrawal Bill amendment
UK lawmakers will vote on Theresa May’s ‘Plan B’ on Tuesday, setting the stage for another showdown with the government. However, with Plan B looking very much like Plan A, MPs will be rushing to pass amendments to the bill, some of which are aimed at blocking a crash exit from the EU. If none of the amendments pass and the deal is rejected, pound bulls could be set for large losses, with cable probably sharply reversing some of its recent gains, having rallied above the $1.31 level this week.
Away from the Brexit saga, the Markit/CIPS manufacturing PMI will be monitored on Friday.
Trade talks, Fed and nonfarm payrolls to take centre stage
Worried traders will be hoping for more soothing words from Fed Chairman, Jerome Powell, on Wednesday when he holds his first post-meeting press conference for 2019. US data will also be on the radar with a flurry of economic indicators scheduled for release, though some like the advance GDP estimate for the fourth quarter and PCE inflation print for December will likely be delayed due to the ongoing government shutdown.
Not affected by the shutdown is the January jobs report on Friday, but ahead of that there’s plenty of other January data to draw traders’ attention. Among which, the more notable releases are the Conference Board’s consumer confidence index on Tuesday, the ADP employment report on Wednesday, the Chicago PMI on Thursday, as well as the ISM manufacturing PMI soon after the NFP numbers on Friday.
Given the concerns about the US housing market, Tuesday’s S&P CoreLogic Case-Shiller house price index for November and Wednesday’s pending home sales for December will be looked at too.
The week’s focal point, however, will be the next round of US-China trade discussions on Wednesday/Thursday, and the FOMC meeting on Wednesday where the Fed will make its first policy statement since the shift to a more “patient” mode. China’s Vice Premier Liu He will be in Washington hoping to find a way to resolve the ongoing trade row. The absence of substantial progress in the talks could spark another bout of risk aversion, which would boost the greenback.
As for the Fed gathering, no change in policy is expected and there are no economic projections for the January meeting but starting this month, all meetings will be followed with a press conference, so the dollar will likely be highly sensitive to remarks by Powell on the growth outlook.
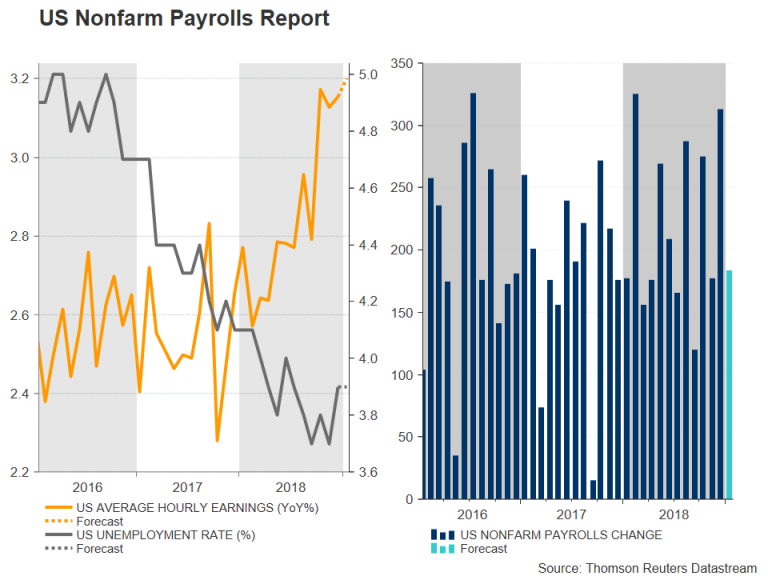
Friday’s jobs report could also prove market moving, but based on the forecast, nothing dramatic is being anticipated. The US economy is predicted to have created 183k jobs in January, slowing from December’s 312k surge. A smaller number could raise concerns about the impact of the government shutdown. The unemployment rate is forecast to hold at 3.9%, while average hourly earnings are expected to have risen by 3.2% y/y in January, unchanged from the prior month.
Australia & New Zealand Weekly: Why RBA Will Keep Rates on Hold
Week beginning 28 January 2019
- Australia: CPI, private credit, trade prices, CoreLogic home prices, Australia Day.
- NZ: trade balance, Auckland Anniversary Day.
- China: NBS and Caixin PMI's.
- Euro Area: CPI, GDP, unemployment, ECB President Draghi speaks.
- UK: BOE Governor Carney speaks
- US: FOMC meeting, non-farm payrolls, (GDP and PCE releases likely to be delayed due to shutdown).
- Key economic & financial forecasts.
Information contained in this report current as at 25 January 2019.
Why the RBA will keep rates on hold; next Fed hike delayed to June due to shutdown
After the usual summer recess the Reserve Bank will conduct its Board meeting on February 5, followed by a speech from Governor Lowe on February 6 and the February Statement on Monetary Policy which will print on February 8.
Of course there will be no rate change following the Board meeting but there will be considerable interest in the Governor's Statement and the subsequent communications.
Recall that the minutes of board meetings have usually contained words along the lines of "members continued to agree that the next move in the cash rate was more likely to be an increase rather than a decrease." Alternatively the November Statement on Monetary Policy noted "further reducing unemployment and ensuring inflation is consistent with the target. If that progress is made higher interest rates are likely to be appropriate at some point."
But those sentiments were expressed when markets had been anticipating rate hikes. At the beginning of 2018 when Westpac was predicting the cash rate would remain on hold in both 2018 and 2019, markets had priced-in a full 25bps rate hike by end 2018. Today, markets are assessing that the next move in the cash rate will be down by 25 basis points with a probability of 60% (13bps) by year's end.
In defence of the economists, only 11 of the 20 forecasters (Bloomberg Survey, January 12, 2018) predicted a hike or hikes in 2018 but this group did include the other three major banks, AMP, and most major investment banks.
There is no survey evidence to check how many of the "nochange nine" supported the Westpac view that rates would remain on hold through 2019 as well.
There is also, at this stage, little support from the economists for the "market view" that rates will be cut by end 2019. Since that survey in January last year Westpac has extended its "on hold view" through 2020.
The key as to whether the Reserve Bank will placate markets and adopt a pure neutral bias by eliminating the "next move up" in its commentary will hinge on how it reassesses its forecasts which will be released with the February Statement on Monetary Policy which prints on February 8.
Recall that, based on its forecasts in the November SOMP, the conclusion that the cash rate would eventually rise was reasonable.
Growth was forecast at 3.5% in 2018; 3.25% in 2019; and 3% in 2020.
Trend growth is assessed by the RBA as 2.75% (1 ppt for productivity growth and 1.75 ppt's for labour force growth).
Three consecutive years of comfortably above trend growth could be expected to erode significant excess capacity and boost employment growth so that inflation would lift into the 2-3% target range and the unemployment rate would approach the NAIRU.
Accordingly, the Bank forecast core inflation to lift to 2.25% in 2019 and 2020 and the unemployment rate to fall to 4.75% by end 2020.
Their views on the labour market have been cautious. The unemployment rate has already reached 5% while the Wage Price Index growth rate has lifted in recent quarters to 2.3%. Scrutiny of a chart which, for the first time, was provided in the November SOMP points to a cautious forecast of WPI annual growth reaching 2 ½ per cent by end 2020.
But the September quarter GDP report has disrupted the RBA's comfortable position. With growth only printing 0.3% in that quarter it would be necessary for Q4 to print 1.2% to achieve the November forecast of 3.5%.
The 2018 growth forecast is likely to be lowered from 3.5% to 3.0%. But what will this mean for the 2019 and 2020 growth forecasts?
We know that the Bank has assessed a minimal wealth effect on consumption and the Q3 growth report is unlikely to have changed that view. Even further negative evidence on house prices in Sydney and Melbourne is unlikely to change the qualitative assessment that the wealth effect was minimal while house prices were booming and therefore will be minimal in reverse.
Westpac differs in that regard pointing to a fall in the savings rates in NSW and Victoria over the year to September 2018 of 1.7 ppt's. We expect some reversal of that effect in 2019 and 2020 pushing growth in consumer spending down from our previous forecast of 2.6% in each year to 2.4%.
We expect the Bank will maintain its current view that consumer spending will run at a growth rate of 3% in both 2019 and 2010. We also differ on the likely downtrend in residential construction in 2019 and to a lesser extent in 2020, "Dwelling investment has remained high and... should remain at a high level for the next year or so" (Nov SOMP).
Westpac's growth forecasts are 2.6% in 2019 and 2.6% in 2020. Those forecasts are only slightly below trend and consistent with steady rates in 2019 and 2020.
We expect the RBA will forecast growth of 3% in 2019 and 3% in 2020. That higher growth will reflect a limited slowdown in housing construction and no meaningful wealth effect. Those growth forecasts are still above trend and likely to ensure the view that the next move in rates will be up.
If we thought the RBA was likely to lower its growth forecasts in 2019 and 2020 to 2.5% or less then we would certainly expect it to adopt an easing bias .
If a central bank expects below trend growth, particularly in the "policy" year, which in 2019 will be 2020, then we would expect an easing bias.
Other factors which may impact market thinking are the higher recent levels of BBSW and associated out of cycle hikes by some banks. The RBA will probably view those developments as likely to exacerbate housing price weakness but due to an insignificant wealth effect, will unlikely materially change their forecasts.
In regards to the US, we now expect the FOMC to remain on hold due to the Government Shutdown but continue hiking in June and September.
Readers will be aware that our forecast for FOMC policy had been three more rate hikes in March; June; and September.
Equity market volatility has undoubtedly unnerved the FOMC (S&P 500 down 20% by late December from its previous peak followed by a 12.5% rally to date). But more importantly the Government shutdown has impacted confidence and data availability. Under such a cloud of uncertainty there is little prospect for the FOMC to change rates much before mid-year.
Accordingly we do not expect the next FOMC rate hike until the June meeting this year. We do expect a follow up move in September, retaining our original timetable for the federal funds rate to peak in September 2019.
We maintain our core view that the US economy remains strong largely through a robust consumer, boosted by rising wages and strong jobs growth. We do not expect to see a marked slowdown in jobs growth and consumer spending until the September quarter.
As with our views for Australia, we are out of step with current market pricing which largely expects US rates to now be on hold.
The week that was
This week, the heat remained in Australia's labour market, but dissipated further in China's economy. For Brexit and the US shutdown, a resolution remains out of reach.
Starting with Australia's labour market, employment growth again came in above expectations in December, with almost 22k new positions created in the month. At 2.2%yr, annual growth has cooled markedly over 2018 (from a peak of 3.6%yr at January); however, it remains well in excess of population growth, keeping pressure on the unemployment rate, currently 5.0%. Victoria remains the strongest of the states, their unemployment rate having fallen 1.1ppts in 2018 to 4.4% to be on par with NSW. The other states have rates nearer 6%. Looking ahead, we expect a moderation in job gains on the back of softer household demand and uncertainty around the Federal Election. That shift is likely to see the unemployment rate drift up to 5.3% around mid-2019.
Before moving on to the northern hemisphere, it is worth noting that New Zealand reported Q4 inflation this week. The result highlighted an interesting tension for the RBNZ, with tradable goods prices taking the heat out of headline inflation in the quarter (0.1% in the quarter, as tradeable prices fell 0.4%) while annual inflation remained just below the RBNZ's 2.0%yr target band mid-point at 1.9%yr – supported by the underlying trend in non-tradeable (domestic) inflation. Our New Zealand team expects that the underlying inflation pulse will gradually strengthen hence. It will be some time before the RBNZ have to consider reacting.
Next Wednesday sees the release of Australia's Q4 CPI. Our preview emphasises that another soft outcome is expected: a 0.3% quarterly gain for both headline and core inflation, for an annual pace near 1.5%yr. As in New Zealand, external price pressures are weak in Australia (1.1%yr); however, here domestic pressures are more subdued (1.8%yr), thanks in no small part to weak housing inflation.
Turning to China, the headlines surrounding Q4 GDP marked the update as unquestionably weak and cause for concern. Given annual growth came in at its weakest pace since the GFC (6.4%yr), pessimism is understandable, but not well founded.
First and foremost, this outcome comes after a very deliberate and purposeful policy shift by the central government to improve the quality of growth and guarantee long-term financial stability. This is the primary factor behind the softer growth of 2018, not trade tensions. More sustainable, higher productivity growth is most certainly in China's long-term interest. Second, with the economy now more focused on quality, Chinese authorities are beginning to become more pro-active on growth, particularly investment in infrastructure. There is therefore a strong likelihood of the 6.0% annualised growth of Q4 being a near-term floor for GDP.
This does not mean that growth in China will take off however. The focus on quality will remain in place and, as per the most recent credit data and policy actions, support for growth from credit provision will only build slowly. Essential to China's longterm prosperity is that new loans made to firms and households are based on strong standards, and further that markets and household wealth are stewarded well.
Finally to the North Atlantic, headlines regarding Brexit and the US shutdown continue to pile up, but progress towards a resolution is non-existent. Indeed, if anything, it seems the political malaise surrounding both issues is getting worse. It is little wonder then that such concern was shown by the world's political and business leaders towards the outlook at the Davos World Economic Forum, ahead of which the IMF cut its global growth forecasts.
The one policy event of note this week was the ECB's January meeting. Having balanced belief in the real economy and concern over the risks in recent engagements, in this instance the focus shifted more towards the risks which "have moved to the downside". No change in forward guidance on rates has been seen yet, but is likely in March – if current trends and/or uncertainties persist – with rate hikes (the deposit rate) likely off the agenda until the December meeting – at least.
Looking ahead, next week should bring some positive headlines on trade, with high-level US/China trade talks due in Washington. The FOMC's January meeting will also be a focus. On the other political matters however, low expectations are probably best.
Chart of the week: Australia employment
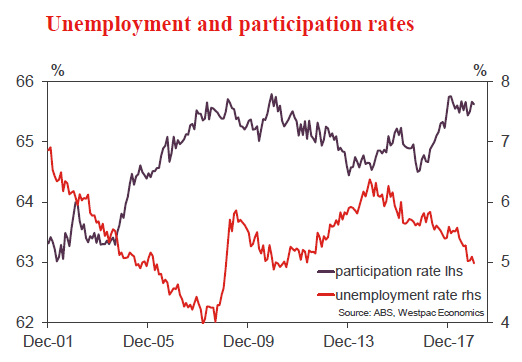
Employment ended 2018 with a sound run. In the year to December total employment grew 268.6k, or 2.2% While it is true that the momentum in the Australian labour market eased through 2018 - annual growth peaked at 3.6%yr in January - it can still be described as sound.
Given the December gain in employment it is not surprising that the unemployment rate eased back 0.1ppt to 5.0% (market median was for 5.1%). This fall was helped by a 0.1ppt moderation in the participation rate to 65.6% which limited the rise in the labour force to just 7.5k.
For 2019 we are looking for a pause in the pace in employment growth due to the economic uncertainties surrounding the Federal Election at the same time as we expect to see a moderation in momentum in NSW and Victoria on the back of a moderation in housing activity. We are expecting this to slow employment growth to below the pace of growth in the labour force lifting the unemployment rate to 5.3% around mid-2019.
New Zealand: week ahead & data wrap
Middle ground
Inflation in New Zealand is now settling into the middle of the Reserve Bank's target range, after years of underperforming. We're forecasting a lift in domestically-generated inflation over the next few years, but it will be a gradual process and there are some potential stumbling blocks along the way.
The Consumer Price Index for the December quarter was up by 1.9% on a year earlier, putting it close to the midpoint of the Reserve Bank's 1-3% target range. The various 'core' inflation measures also sat around 2% or a little below, indicating that this was a broad-based result with no obvious distortions from temporary factors.
The December quarter itself saw a 0.1% increase, slightly below the RBNZ's forecast of a 0.2% rise. However, that hides some important detail. At the time the RBNZ was preparing the forecasts for its November Monetary Policy Statement, fuel prices had rocketed up to new record highs on the back of rising world oil prices, a lower exchange rate, and an increase in the fuel excise duty. But fuel prices then fell surprisingly sharply into the yearend, taking some of the heat out of the overall inflation rate. This will also act to dampen inflation in the early part of 2019, but it's a temporary influence that the RBNZ can look through.
In contrast, prices for non-tradable goods and services were up 2.7% on a year ago, the fastest increase since June 2014, compared to the RBNZ's forecast of a slowdown to 2.4%. That difference is important because non-tradables inflation tends to be more persistent over time, and because it's considered to be more of a product of monetary policy settings.
For much of this decade, inflation has been at the low end or even below the RBNZ's 1-3% target range. That era of uncomfortably low inflation now seems to have passed; the next question is whether inflation could test the upper end of the target range, given that monetary policy remains very stimulatory. We're expecting a gradual pick-up in inflation pressures over the next few years, but there are a few hurdles that need to be crossed yet.
Firstly, a pickup in inflation will depend on continued solid growth in demand. We expect GDP to grow by around 3% over this year, with support from increased government spending, export earnings, and construction. Recent data, both here and overseas, has been on the softer side of expectations, so we'll be watching the numbers closely to get a clearer picture of the economy's momentum.
Tradables prices have been a persistent drag on overall inflation in past years, notwithstanding the recent bounce in world oil prices. More recently there have been signs of a mild pick-up (or a slower rate of decline) in tradables inflation, reflecting the lower New Zealand dollar over the last year. We're expecting a further fall in the exchange rate this year, which would flow through into prices for imported goods. But this doesn't have a sustained impact on the rate of inflation.
To get a sustained rise, it needs to come from domestic sources, most importantly a pickup in wage growth. There's a lot of evidence that the labour market is becoming tighter. The unemployment rate is at its lowest in a decade, and increasingly employers are having difficulty in finding workers.
To date, we haven't seen that translate into faster wage growth, outside of government-mandated increases such as fair pay settlements and minimum wage hikes. It may be that the labour market has only recently moved into territory that could be considered 'tight' by historic standards, and that wage growth tends to have a lagging relationship with the economic cycle. Moreover, wage growth – as measured by the Labour Cost Index, which adjusts for changes in job composition and productivity gains – tends to evolve quite slowly. It could be some time before a pickup in the pace of wage growth becomes apparent in the data. Nevertheless, we think the right conditions are in place for a pickup over the next few years.
One final challenge to our view is that some of the most important components of non-tradables inflation may have already peaked. Prices for new home builds, which make up over 5% of the CPI, have slowed in the last year or so, in line with the slowdown in growth in house sales prices. With a range of Government policies aimed at dampening speculative demand in the housing market, we expect prices for both existing and new homes to remain under pressure over the next few years.
The outlook for rents, which make up almost 10% of the CPI, is less clear. There has been very little variation in rental growth at the national level in recent years. But the regional split is more telling: rental growth is actually slowing in Auckland, even as it picks up in other parts of the country.
The bottom line is that any pickup in home-grown inflation is likely to be a slow one, and it will be some time before the RBNZ needs to act to contain it. We're expecting the Official Cash Rate to remain at its current very low level through to the end of next year, with rate hikes progressing at a very gradual pace from then on.
On a different note, this week we saw the first release of the net migration figures based on a new methodology, which uses actual outcomes 16 months after someone has entered or left the country, rather than their stated intentions on departure cards. This produces a somewhat different picture of migration over history – net inflows peaked slightly earlier, and at a lower level, than under the previous method. However, it remains the case that net migration is in decline, which is a key reason why we expect the economy's potential growth to take a step down over the next few years.
Data Previews
Aus Q4 Consumer Price Index
- Jan 30 Last: 0.4%, WBC f/c: 0.3%
- Mkt f/c: 0.4%, Range: 0.3% to 0.6%
The September Quarter CPI printed 0.4%qtr,/1.9%yr compared to the market expectations for 0.5%qtr. The average of the core measures rose 0.3%qtr while the annual pace printed 1.7%yr, a further deceleration from 1.8%yr in Q2 2018 and 2.0% in Q1. There were isolated inflationary pressures in petrol and tobacco as well as embryonic indicators of an easing in the retail disinflationary pulse but the moderation in housing was significant.
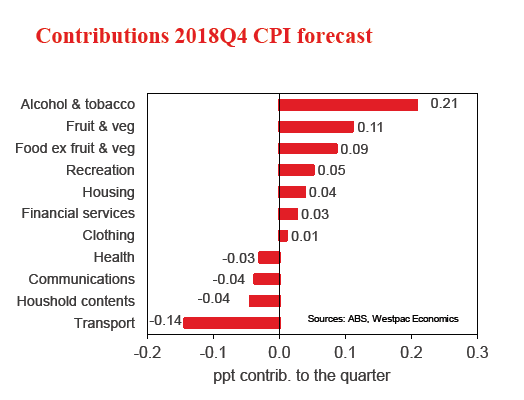
Westpac's forecasting 0.3%qtr for the December quarter will see the annual pace ease to 1.5%yr from 1.9%yr. Falling auto fuel, moderating housing costs & a lack of pass-through from a weaker AUD are more than offsetting a strong rise in tobacco prices. It is worth remembering that market forecasters have now overestimated the quarterly rise in the CPI for every quarter in the last two years.
Aus Dec private credit
- Jan 31, Last: 0.3%, WBC f/c: 0.3%
- Mkt f/c: 0.3%, Range: 0.3% to 0.5%
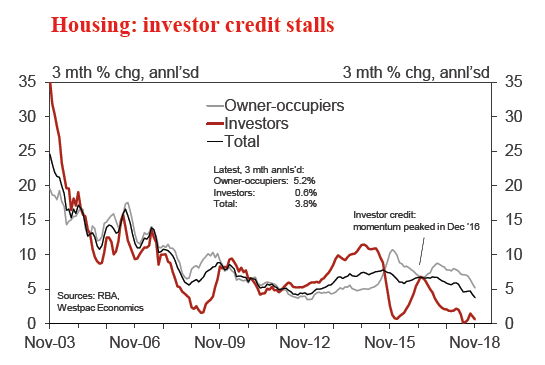
Private sector credit growth is relatively modest at 4.4% for the year, moderating progressively over the past three years as housing cools - slowing from 6.6% in 2015 to 5.6% in 2016 and 4.8% in 2017.
The November outcome was a soft one, up only 0.3%, including a +0.3% for housing and a -0.3% for personal.
Housing credit, at this late stage of the cycle, is slowing as tighter lending conditions and weaker demand see new lending decline, particularly for investors. In November housing credit grew by 0.3%, 4.9%yr (including investors, at flat mth, 1.1%yr).
Business credit, 4.4% above the level of a year ago (including a 3.0% jump over the past five months), is volatile around a modest uptrend as businesses increase investment in the real economy.
Aus Q4 import price index
- Jan 31, Last: 1.9%, WBC f/c: -0.5%
- Mkt f/c: 0.3%, Range: -1.4% to 3.5%
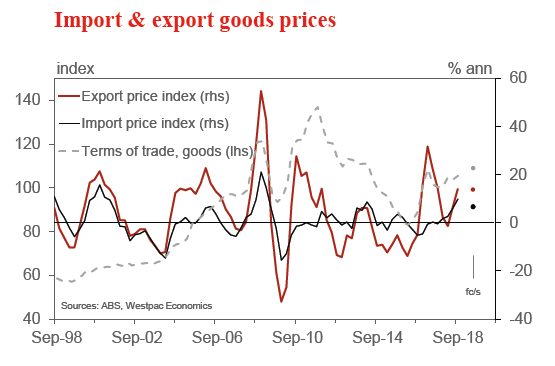
Prices for imported goods increased by 1.9% in the September quarter to be almost 10% above a year earlier. The lift in prices is centred on a jump in global energy prices and the impact of a lower Australian dollar.
For the December quarter, import prices are expected to ease a little, down a forecast 0.5%.
Key to the expected fall for Q4, oil prices - which corrected lower after a strong run.
Outside of fuels, there was upward pressure on the cost of imports. Notably, the Aussie took another step lower, down 0.8% on a TWI basis and falling almost 2% against the USD.
Aus Q4 export price index
- Jan 31, Last: 3.7%, WBC f/c: 2.7%
- Mkt f/c: 2.7%, Range: 1.5% to 3.5%
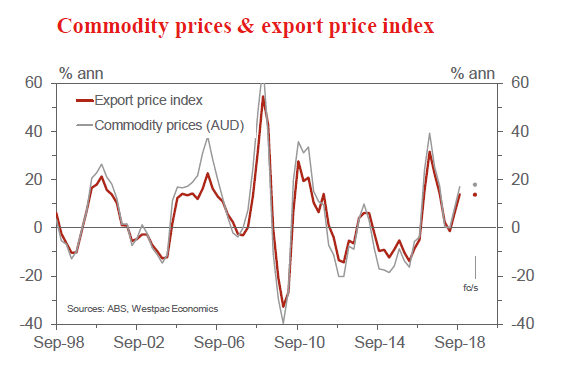
Export prices increased in 2018 on higher commodity prices (across iron ore, coal and oil/LNG) and a weaker Australian dollar.
For Q3, the export price index printed at 3.7%qtr, 14.0%yr.
In Q4, export prices were up again (on higher commodity prices and a lower dollar) - we expect a rise of around 2.7%, which would hold annual growth close to 14%.
The terms of trade for goods, on these estimates, increased by around 3% in the December quarter, capping off a positive year for Australian national income growth.
As to prices for services, an update will be available with the release of the Balance of Payments on March 5.
Aus Jan CoreLogic home value index
- Feb 1, Last: –1.3%, WBC f/c: –1.0%
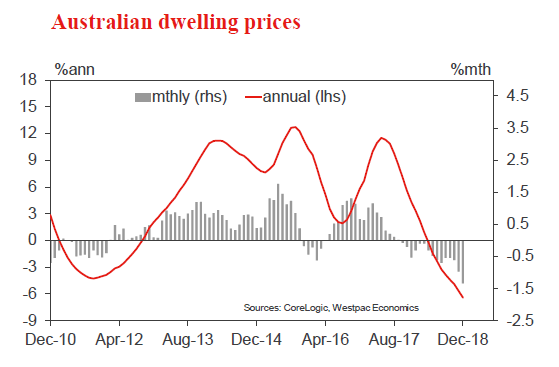
The Australian housing market's very weak finish to 2018 looks to have carried into early 2019. The CoreLogic home value index fell 1.3% in the December month, marking the biggest monthly fall in the correction to date, albeit likely accentuated by seasonal weakness heading into year end.
Both cyclical and seasonal weakness carried into January although extremely low levels of activity during the summer holiday period mean all housing related data should be treated with caution. The daily index points to a 1% decline for the month taking the cumulative decline since the late 2017 peak to –7.7% nationally.
US Jan FOMC meeting
- Jan 30, last 2.375%, WBC 2.375%
The first meeting for the FOMC for 2019 will be a focus for markets, particularly Chair Powell's press conference – now scheduled for every meeting.
Since December's meeting, the market's awareness of global and financial risks has clearly grown. And their confidence in the US real economy diminishes every day that the Federal Government keeps its doors shut.
FOMC officials have focused on global risks to date. While these factors will remain front of mind, a more in-depth discussion of the shutdown's impact is anticipated.
With many partial data prints unavailable, a March hike is clearly off the agenda. The market will therefore focus on what will and won't see the FOMC act from June on.
US Jan employment report
- Feb 1, nonfarm payrolls, last 312k, WBC 150k
- Feb 1, unemployment rate, last 3.9%, WBC 3.9%
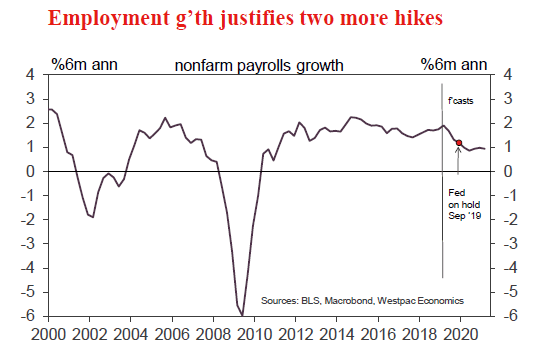
The very, very strong 312k nonfarm payrolls print of Dec (with an additional 58k in back revisions to the prior two months) was largely ignored by financial markets. This occurred because, around the same time, the ISM's disappointed and, more importantly, Fed Chair Powell put forward a more cautious view of the outlook.
There is no reason to disregard the strength of this data print. Though being 100k over the month average of 2018, there is however reason to expect some payback in Jan. We consequently look for a 150k gain in the month.
There has been considerable uncertainty over the impact of the shutdown on these numbers. It won't affect the payrolls count, but it is likely to add to unemployment owing to temporary layoffs.
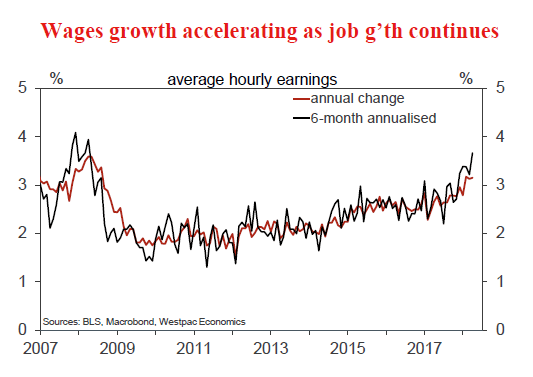
Weekly Focus: US-China Trade Talks are the ‘Name of the Game’
Market movers ahead
- Trade talks between China and the US are the 'name of the game' next week, with the meeting taking place on 30-31 January.
- In the UK, the House of Commons is due to vote on Prime Minister Theresa May's Brexit Plan B (and amendments) on Tuesday.
- The government shutdown may affect the US jobs report, while we do not expect the FOMC meeting to bring any new signals.
- In the euro area, we do not expect the Q4 GDP flash report to show any significant rebound from the lacklustre Q3 number.
- The euro area HICP inflation number for January is set to show a further decline to 1.3%, driven by lower energy prices.
Weekly wrap-up
- In the UK this week, Prime Minister May presented her Brexit Plan B on Tuesday, which, as expected, did not really provide any clarification.
- As expected, the ECB made no changes to its policy rate or forward guidance at its meeting this week and we still believe a rate hike in December is likely.
- Euro area PMI revealed further weakness, while the US counterpart painted a stronger picture of the US economy.
- Ahead of the crucial US-China trade talks next week, US Commerce Secretary Wilbur Ross said this week that while the two countries are still 'miles away' from a deal, he thinks there is a fair chance they will reach one eventually.
XAU/USD Outlook: Fresh Advance Turns Focus Towards Pivotal $1300 Resistance Zone
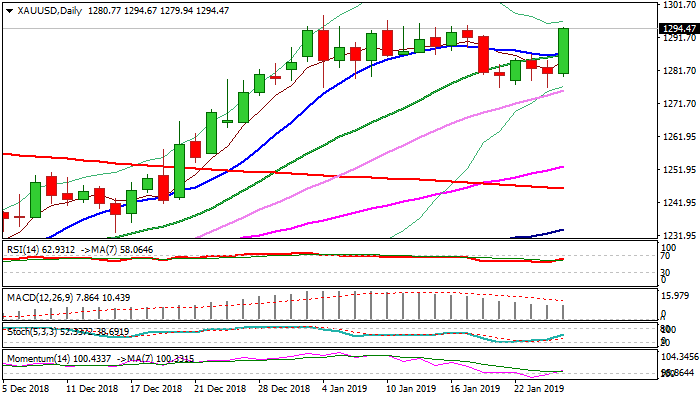
Spot gold surged to one week high at the beginning of American session on Friday as US stocks rose on upbeat earnings reports, sending the greenback lower across the board.
The yellow metal accelerated higher and emerged from four-day $1286/76 congestion, shifting near-term focus higher and signaling that broader bulls remain intact after corrective pullback from $1298 high based at $1276, contained by rising 30SMA.
Fresh advance so far retraced over 61.8% of $1298/$1276 pullback and also generated bullish signal on break above converged 10/20SMA's, close above which would confirm bullish stance.
The high of 2019 at $1298 (posted on 4 Jan) is coming in focus as bulls regained traction after corrective phase and look for renewed attack at psychological $1300 barrier. Initial bullish signal would be generated on eventual weekly close above cracked Fibo barrier at $1286 (61.8% of $1365/$1160), with extension and close above $1300 needed to signal bullish continuation.
Broken converged 10/20SMA's mark initial support at $1286, guarding lower pivot at $1276, loss of which would be bearish.
Res: 1295; 1298; 1300; 1306
Sup: 1286; 1279; 1276; 1273
Sunset Market Commentary
Markets
Global core bonds edged lower today with US Treasuries underperforming German Bunds. Risk sentiment turned positive as hope on progress at the high-levels trade talks between the US and China got lifted overnight. China is said to send three vice ministers to Washington on Monday to lay the groundwork for the high-level trade talks starting next Wednesday. Fourth quarter corporate results are printing marginally above expectations, too. European equities trade higher today, weighing core bonds down. Disappointing German Ifo Business expectations in January and the more dovish ECB stance hold the German Bund in a more sideways pattern. The German yield curve moved higher with changes in the range of +0.3 bps (30-yr) to +1.6 bps (5-yr). The US presented a virginal white eco calendar today as the responsible government agencies remained closed in the light of the ongoing government shutdown. Given the uptick in risk sentiment, US Treasuries edged steadily down throughout the day. Investors are also starting to eye the Federal Reserve meeting of next week and maybe more importantly the high-level US-Sino trade talks. Risk sentiment holds steady as US investors join trading, pushing US equities higher after opening. The US yield curve shifts higher with changes in the range of +1.7 bps (2-yr) to +2.1 bps (10-yr). Peripheral spreads over the German 10-yr yield ease marginally today with Greece outperforming (-7 bps) as political tensions ease on the Macedonia name agreement.
Earlier this week, EUR/USD drifted south in the 1.12/1.15 trading range, mostly driven by negative headline news on the EMU economy. At the same time, the dollar also traded with a cautiously positive bias even as the US currency received only limited interest rate support. Today, at least the euro decline halted. German IFO sentiment was again weaker than expected, but this was no surprise anymore for EUR/USD traders. Initially, the euro didn’t react. Later in the session EUR/JPY, USD/JPY and EUR/USD all turned gradually north in a standard risk-on move. EUR/USD trades currently in the 1.1365 area. So, despite plenty of negative EMU headline news, the 1.1270 support area survived quite easily. USD/JPY tried to near the 110 barrier but a real re-test didn’t occur yet.
EUR/GBP tested the key 0.8620 support area overnight. Sterling was still propelled by investors’ hope that chances of a no-deal Brexit have substantially decreased. This morning, sterling also profited from press headlines that a new Brexit proposal of UK PM May might get the support of the DUP party if it included a time limit on the Irish backstop. However, during the European trading hours, sterling returned part of its most recent gains. Amongst others, comments from EU/Irish policy makers indicated that there were still plenty of obstacles on the way to a comprehensive agreement with all parties involved. CBI retail data were rather close to expectations and didn’t support any further sterling gains. EUR/GBP trades currently in the 0.8675 area. Cable hovers near the 1.31 level. So, despite today’s slowdown, sterling still closed the week with quite an impressive gain.
News Headlines
Swedish retail sales disappointed in December. Sales declined by -1.4% MoM (-1.1% YoY) vs. a 0.1% (1.2%) rise expected. With November data revised upwardly, one could suspect a so called “Black Friday” effect similar to poor UK data released earlier this month. A slowing December PPI published simultaneously sent the Swedish krona lower to EUR/SEK 10.30.
Participants to the ECB’s 2019Q1 Survey of Professional Forecasters lowered growth forecasts to 1.5% for 2019 (1.8% previously) and 1.5% for 2020 (1.6%). Inflation is expected at 1.5% in 2019 (down from 1.7%) and 1.6% in 2020 (1.7%). The first 2021 forecasts show 1.4% growth with inflation at 1.7%. Slipping expectations for longer term inflation (2023) from 1.9% to 1.8% might suggest waning confidence in the ECB’s abilities.
USD/JPY Mid-Day Outlook
Daily Pivots: (S1) 109.44; (P) 109.62; (R1) 109.82; More...
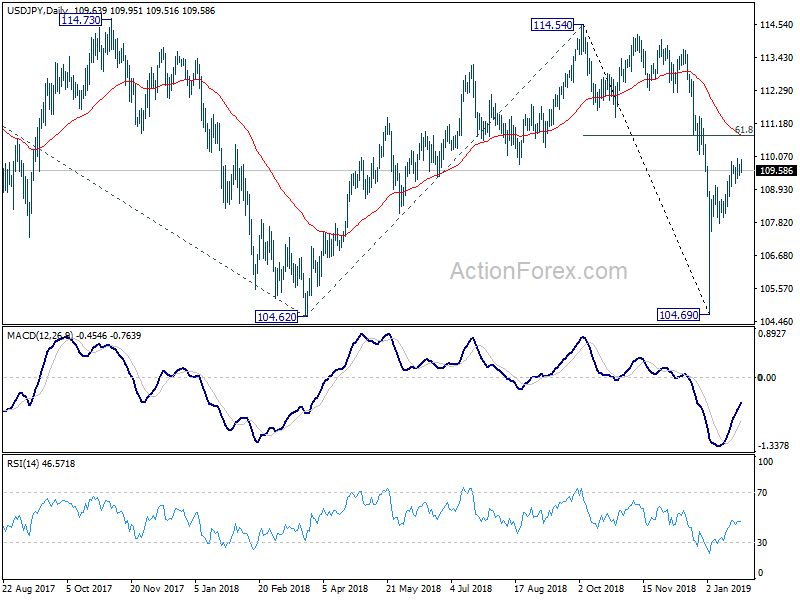
No change in USD/JPY's outlook. With 109.14 minor support intact, further rise is still mildly in favor. Rebound from 104.69 could target 61.8% retracement of 114.54 to 104.69 at 110.77. We'd look for topping signal above there. On the downside, break of 109.14 minor support will be the first sign of completion of the rebound. Intraday bias will then be turned back to the downside.
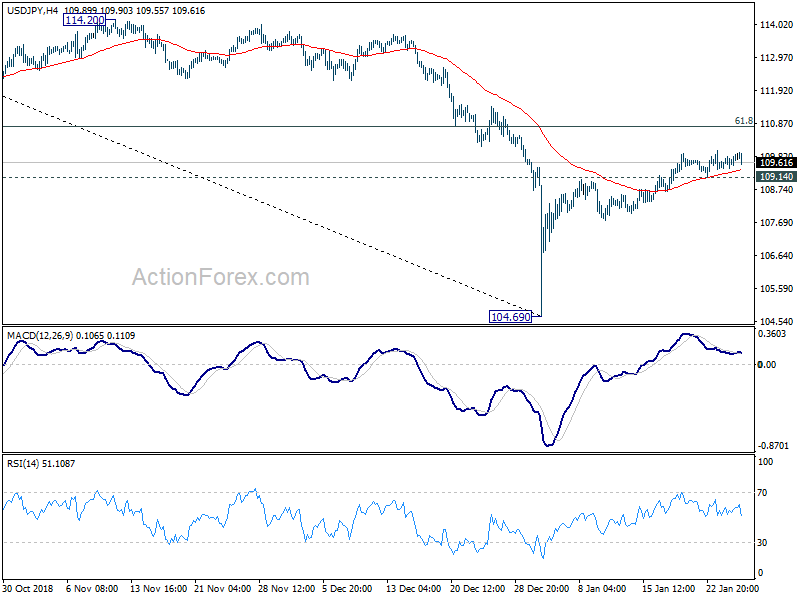
In the bigger picture, price actions from 125.85 (2015 high) are seen as a long term corrective pattern, no change in this view. Apparently, such corrective pattern is not completed yet. Fall from 114.54 is seen as part of the falling leg from 118.65 (2016 high). Break of 104.62 will target 100% projection of 118.65 to 104.62 from 114.54 at 100.51, which is close to 100 psychological level. But in that case, we'd expect strong support from 98.97 to contain downside to bring reversal. Also, this bearish case will remain the preferred one as long as 114.54 resistance holds.
USD/CHF Mid-Day Outlook
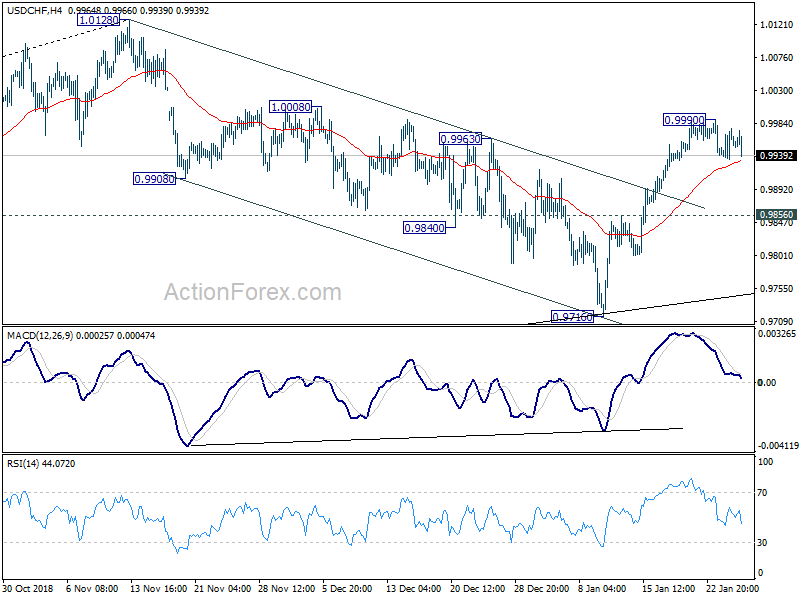
Daily Pivots: (S1) 0.9938; (P) 0.9958; (R1) 0.9981; More....
Intraday bias in USD/CHF remains neutral as consolidation from 0.9990 is in progress. Deeper retreat might be seen. But downside should be contained above 0.9856 support to bring another rise. As noted before, correction from 1.0128 should have completed at 0.9716 already. On the upside, above 0.9990 will target a test on 1.0128 high next.
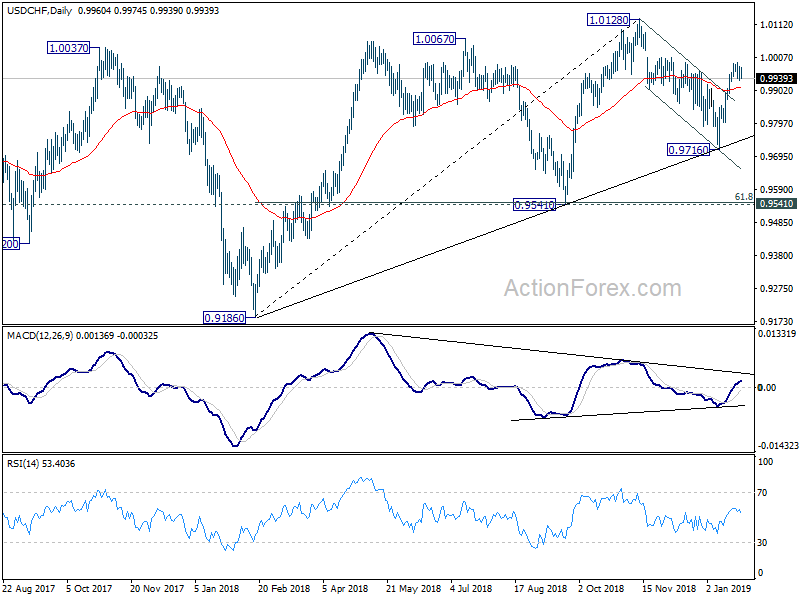
In the bigger picture, current development suggests that rise from 0.9186 has possibly completed with three waves up to 1.0128 already. Decline from 1.0128 could either be correcting this move, or reversing the trend. As long as 0.9541 support holds, we'd slightly favor the former scenario, and expect another rise through 1.0128 at a later stage. However, sustained break of 0.9541 will confirm trend reversal and bring deeper fall back to 0.9186 low.
GBP/USD Mid-Day Outlook
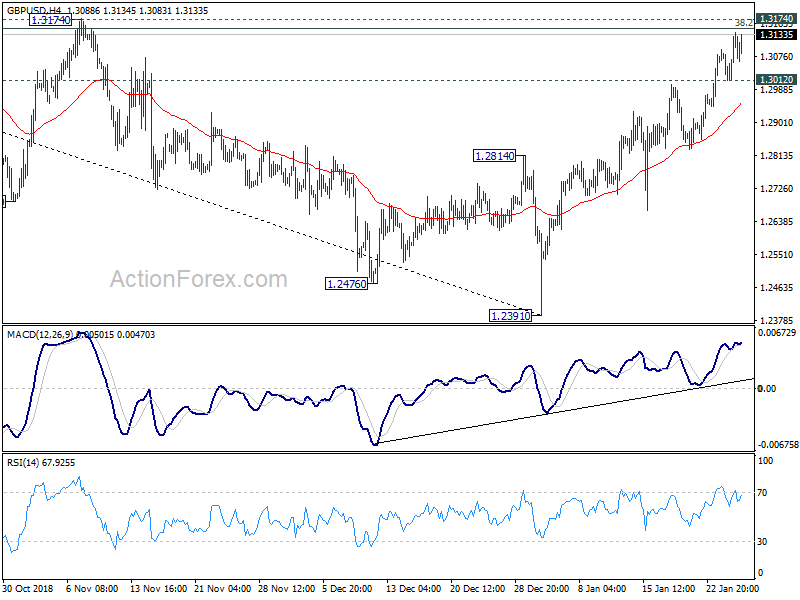
Daily Pivots: (S1) 1.3018; (P) 1.3057; (R1) 1.3101; More....
Intraday bias in GBP/USD remains on the upside for the moment and further rise could be seen for 1.3149/74 resistance zone (38.2% retracement of 1.4376 to 1.2391 at 1.3149). At this point, we'd still expect strong resistance from there to limit upside, at least on first attempt. On the downside, below 1.3012 minor support will turn intraday bias back to the downside for 1.2814 resistance turned support first. However, firm break of 1.3149/74 will pave the way to 61.8% retracement at 1.3618.
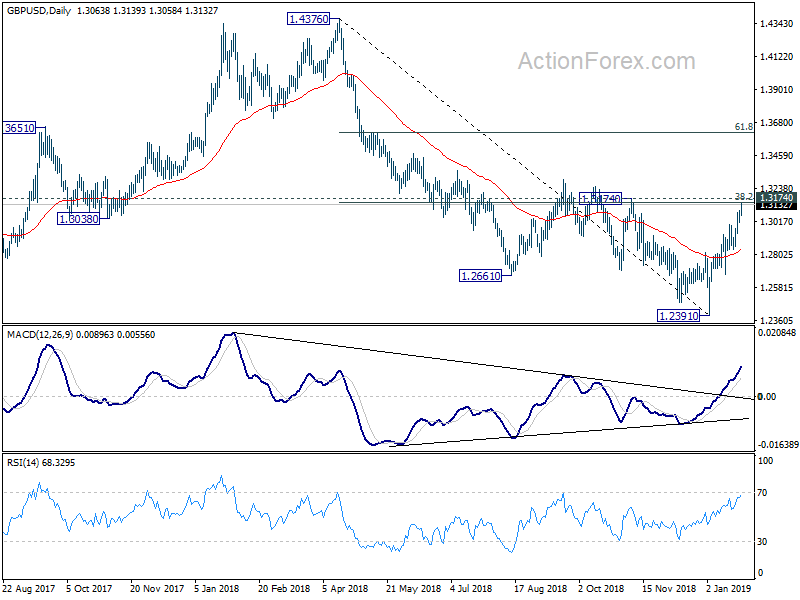
In the bigger picture, whole medium term rebound from 1.1946 (2016 low) should have completed at 1.4376 already, after rejection from 55 month EMA. The structure and momentum of the fall from 1.4376 argues that it's resuming long term down trend from 2.1161 (2007 high). And this will remain the preferred case as long as 1.3174 structural resistance holds. GBP/USD should target a test on 1.1946 first. Decisive break there will confirm our bearish view. However, sustained break of 1.3174 will invalidate this case and turn outlook bullish.
EUR/USD Mid-Day Outlook
Daily Pivots: (S1) 1.1266; (P) 1.1330; (R1) 1.1371; More.....
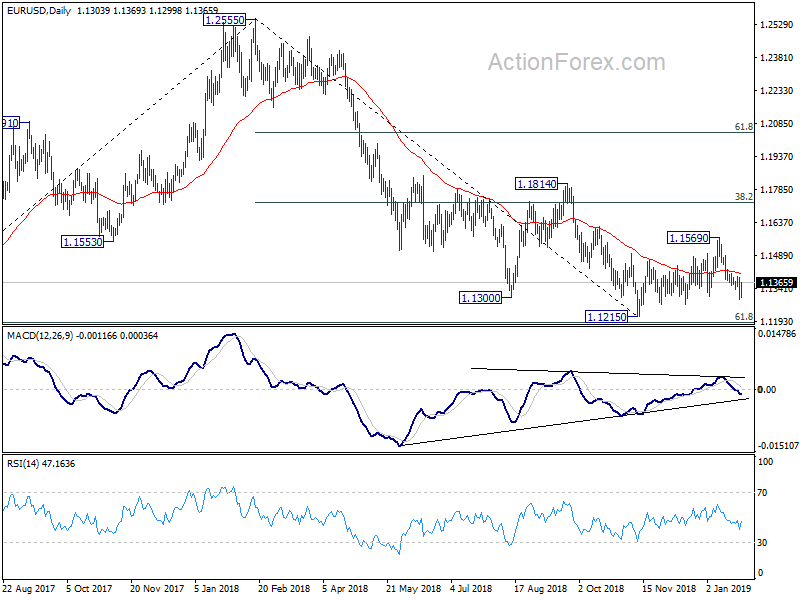
EUR/USD recovers strongly after making a temporary low at 1.1289. Intraday bias is turned neutral first. With 1.1394 minor resistance intact, further decline is still in favor. Break of 1.1289 will target 1.1215 low. Break will resume larger down trend from 1.2555. On the upside, break of 1.1394 resistance will argue that the corrective pattern from 1.1215 is extending with another rise. And, intraday bias will be turned to the upside for 1.1569 and above.
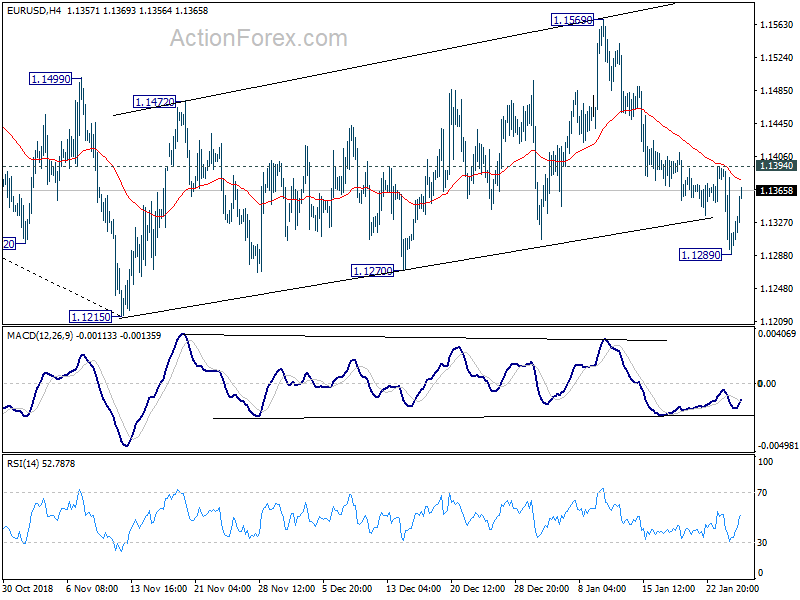
In the bigger picture, as long as 1.1814 resistance holds, down trend down trend from 1.2555 medium term top is still in progress and should target 61.8% retracement of 1.0339 (2017 low) to 1.2555 at 1.1186 next. Sustained break there will pave the way to retest 1.0339. However, break of 1.1814 will confirm completion of such down trend and turn medium term outlook bullish.