Sample Category Title
What If We Are Wrong – Risks In 2019
Today, I focus on risks to the global economy and the financial system in 2019. We expect the world economy to pick up speed from Q2 onwards, which financial markets appear to price in currently. However, our call hinges on several assumptions: (1) the US and China reach a trade deal in H1, where the latest developments support our view (see here), (2) the Eurozone growth slump since Q3 18 is due to trade war worries, oil price rises and bottlenecks in the German car sector. Eurozone growth is set to recover during 2019, (3) a no-deal Brexit is averted. Moreover, even if there were a no-deal Brexit, it would have limited spill over to the Eurozone, (4) no Italian debt-crisis over the next one to two years and (5) no black swans. What if we are wrong? How bad could it be?
First, let us take a step back and look at the typical causes of a financial crisis or economic downturn. Every financial crisis is different, which make them so hard to predict. The outcome of a crisis depends on fundamentals, confidence and the policy response, which are also difficult to predict. However, most financial crises are preceded by similar patterns. A major credit boom, a substantial increase in asset prices and a sharp rise in leverage typically precipitate a financial crisis, with the financial system and in particular banks at the epicentre of systemic risks. Moreover, fragilities in the balance sheets of households, corporations and governments often prolong and deepen a crisis. Sharp increases in inflation due to rising input costs, e.g. the oil price, may cause a large economic downturn. Contractionary monetary and fiscal policies could trigger a recession.
How do the typical causes of crises and recessions compare with the current risks to the world economy? A full-blown trade war between the US and China could trigger a sharp increase in input costs, dampen investments and tighten financial conditions. The IMF has analysed this in detail, assuming that the US imposes a 25% tariff on all imported cars, which Trump threatened to do last year (see p. 33 here). In the analysis, the fund incorporates the hit to business confidence, tightening of financial conditions and likely policy responses. The IMF estimates that the total hit to China's economy would peak at 1.6%. For the US, a full-blown trade war would shave off up to 1%, while the hit to the Eurozone would be around 0.5%. Hence, a full-blown US-China trade war and the US imposing tariffs on cars would have substantial negative implications for both China and the US. However, according to the IMF it would not push the economies into a recession.Hence, a full-blown US.
I am more worried that an escalation of the trade war could damage an already weakening Eurozone. The weakness in Eurozone exports in H2 18 dragged down domestic demand. What if the slowdown continues? In that regard, I am concerned about the combination of structurally low growth and high government debt in several large Eurozone countries. In highly indebted Italy and France, the percentage of government debt to GDP was roughly flat during the Eurozone boom years from 2015-18 (it actually rose in France). During the same period, the average nominal growth rates in Italy and France were 2.1% and 2.2%, respectively. On Friday, Bank Italia warned that Italy might have stumbled into recession in Q4. Meanwhile, France has a very modest buffer as growth dropped to 1.4% y/y in Q3 18, while the manufacturing PMI is below 50. We forecast Eurozone growth at 1.5% this year driven by a rebound in exports and solid domestic demand. However, if some of the risks I discuss here materialise, growth could in my view fall to, say, 0.5%-1.0%. In this case, Italy is doomed as it is set to fall into recession, putting renewed pressure on its fiscal situation. At its upcoming monetary policy meeting this week, we expect the ECB to state that risks to growth have shifted to the downside from its current assessment of balanced growth risks (see here for details). The ECB has other measures in its crisis arsenal (see here). However, I believe the bar for e.g. restarting QE or cut interest rates is very high.
On Brexit, we believe the overall damage to growth for the European economy of a no-deal Brexit would be relatively modest. However, in the case of a no-deal Brexit, slowing growth and falling house prices in the UK are set to hit its financial system hard. This could have kneejerk negative repercussions for the financial system in Europe, given the size of the UK's financial system and its interconnectedness with European banks. Over time, financial hubs in the Eurozone could benefit from a no-deal Brexit, but I do not believe that will be the immediate impact. Finally, a US corporate debt crisis or a financial crisis in China are low-probability events, but would have devastating consequences. However, those events are hardly unpredictable and therefore do not classify as black swans, although we should monitor the risks and the possible repercussions.
In closing, we have a positive view on the world economy and financial market performance this year, but risks are substantial. That was all for today's comment. I wish you a great Sunday night and coming week, best regards, Thomas.
Elliott Wave Hedging Suggests More Upside In CHK
Chesapeake Energy Corp’s (NYSE: CHK) most recent price action suggests the stock may be poised for a comeback in 2019. Beaten down to prices not seen since 2016 CHK is now tracing out what appears to be an impulsive five swing Elliott wave sequence from $1.71. Elliott wave hedging strategies used by us here at EWF suggests there will be more upside.
CHK 1HR CHART From $1.71 Low
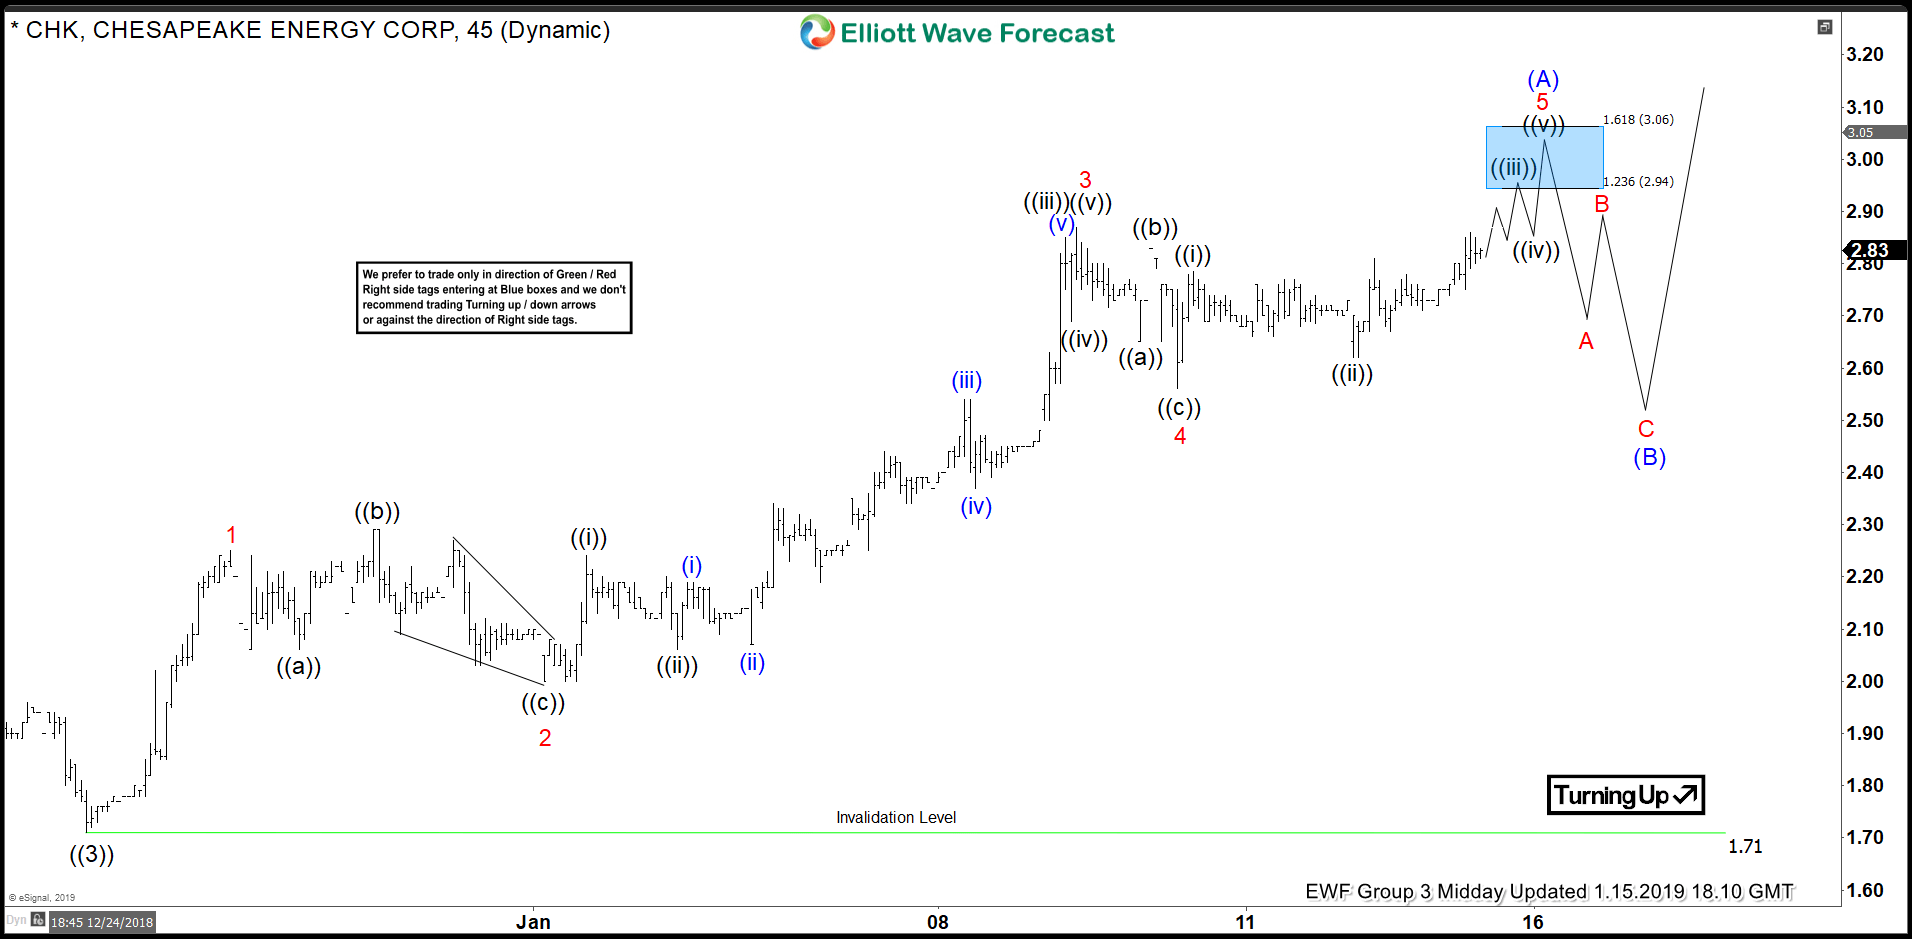
CHK Impulse from $1.71
The basics for Elliott wave analysis state that an initial five wave move solidifies a trend. The Elliott Wave Principle also suggests another five wave move in the same direction after a 3 wave countertrend completes. This staple of the Elliott Wave Principle is true no matter if CHK bottomed at $1.71 or if it is merely experiencing a bounce higher in a bear market. So the Elliott wave hedge for CHK suggests that after a corrective 3 wave move lower another five wave move higher will ensue minimal even if the coming impulsive five wave move higher is part of a corrective zigzag (5-3-5) pattern.
The Basic Elliott Wave Progression
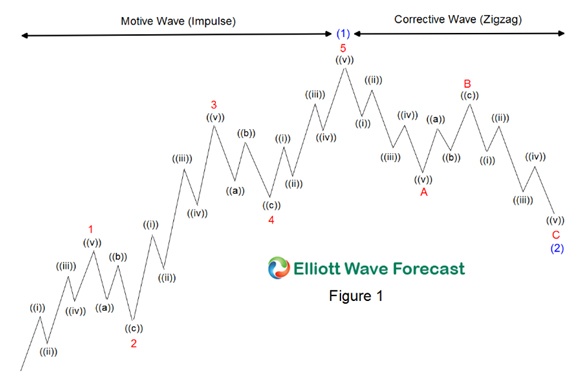
Impulsive and Corrective Elliott Wave Sequences. CHK is finishing wave (1) or wave (A)
Certainly nobody knows exactly how the price action will play out. Elliott wave analysis can give you multiple views since the overall count is subjective to the observer. Even though multiple views are possible within the guidelines on Elliott analysis there are times when these differences produce conclusion for price to move in the same direction for an actionable move. This is an Elliott wave hedge.
As you can see in the chart of CHK above we have the first 5 waves labeled ending wave (A). We very well could be ending a wave (1) instead. Looking at the chart directly above you can see that regardless if its an (A) or a (1) there will be a three wave move in the opposing direction. It is at the end of this three wave countertrend move that both actionary waves continue in the direction of the prior actionary wave. In the case of this stock the next actionary wave after three waves back lower are complete is higher regardless if its a wave (C) which is minimal or wave (3) which is much more bullish.
China Deal Optimism Props Risk Trades
Market ebullience intensifies after a brief pause on reports that US Treasury Secretary Mnuchin had proposed lifting some or all of the US tariffs on China. The reports were later denied but indices remain firmly in the green. The main risk to the prolonged rebound remains a sharper slowdown in China than expected. On Monday, Beijing will release key economic data and that argues for caution in the day ahead. On the wires just now, NY Fed president Williams stuck to somewhat dovish remarks saying no worrying signs of inflation pressures and interest rates are closer to normal. Fed funds rate probabilities for a 2019 Fed hike are at 21% vs 7% for a rate cut by year-end. Wednesday's GBPUSD long for Premium subscribers hit the final target of 1.2970 for 140 pips while Wednesday's Premium Dow30 long from 24080 is currently over 400 pts in the green. US industrial production rose 0.3% in December (vs exp 0.2%) after a downwards revised 0.4% in Nov. US markets close on Monday for Martin Luther King Holiday.
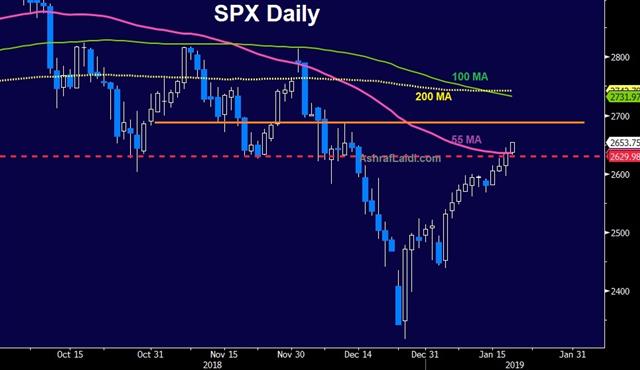
The underlying ebb and flow of the market at the moment is the balancing act between the negative risks of a slowdown in China and the positive risks of Chinese officials deploying stimulus to counteract it. That was crystalized at the start of the week when dismal trade numbers first hit risk trades, only for the moves to reverse on stimulus. Recall Wednesday's announcement from China's central bank to boost the biggest amount on record in money market injections (560 billion yuan or $80 billion) aimed at meeting seasonal demand for cash due to tax payments and the upcoming Chinese New Year Holidays.
The same risks are in play in the week ahead. On Monday (late Sunday in North America), China will release data on retail sales, industrial production and GDP. Chances are, those numbers will continue the streak of poor data. Also note that Monday is the Martin Luther King Jr. holiday so US traders won't return til Tuesday. There are other risks into the weekend as well.
China is expected to lower its growth target this year to 6.0-6.5% but even at the low end of that range, the target of doubling the economy in the decade will be met. It's a staggering achievement.
Onto Trump
Is Trump done? Key members of his cabinet have all quit. The people around him have abandoned him. Will he still be the Republican candidate in 2020? The only reason he was able to maintain his grip on the Republican party this long is the alliance with his base as well as large financial backing.
His best bet for survival is to re-boost the stock market by making a deal with China. Ashraf tells me that failure to do so in the next six weeks will get us back to heightened market volatility, especially if the Government shutdown extends to debt ceiling acrimony.
More broadly, it's over for him and it's just a question of how messy it will be. If this shutdown is any indication, it will be ugly but don't underestimate the chance that he walks away. If Trump clinches a deal with China he could claim victory for that and blame the rest on the Democrats. That's a temporary upside risk for markets.
Euro Reverses Its Losses In The Asian Session
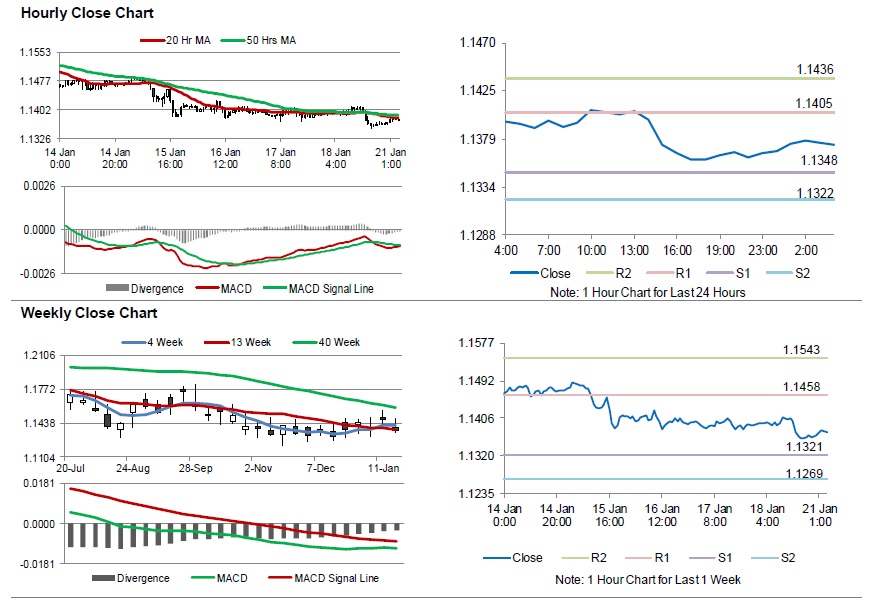
For the 24 hours to 23:00 GMT, the EUR declined 0.25% against the USD and closed at 1.1367 on Friday.
On the data front, Euro-zone’s seasonally adjusted current account surplus narrowed more-than-expected to €20.30 billion in November, compared to a revised surplus of €26.80 billion in the previous month.
In the US, data showed that the US industrial production advanced 0.3% on a monthly basis in December, higher than market expectations for a rise of 0.2%. Industrial production had registered a revised climb of 0.4% in the previous month. Moreover, the nation’s manufacturing (SIC) production rose to a 10-month high level of 1.1% on a monthly basis in December, boosted by gains in automobile production and beating market expectations for a gain of 0.3%. In the prior month, manufacturing production had recorded a revised rise of 0.1%.
On the other hand, the US preliminary Reuters/Michigan consumer sentiment index declined to a level of 90.7 in January, falling to its lowest level since October 2016 and amid mounting worries over nation’s economic growth. In the preceding month, the index had registered a level of 98.3, while market participants had anticipated the index to fall to a level of 96.8.
In the Asian session, at GMT0400, the pair is trading at 1.1374, with the EUR trading 0.06% higher against the USD from Friday’s close.
The pair is expected to find support at 1.1348, and a fall through could take it to the next support level of 1.1322. The pair is expected to find its first resistance at 1.1405, and a rise through could take it to the next resistance level of 1.1436.
Trading trend in the Euro today is expected to be determined by Germany’s producer price index for December, scheduled to release in a while.
The currency pair is showing convergence with its 20 Hr moving average and trading below its 50 Hr moving average.
UK’s Retail Sales Increased Below Expectations In December
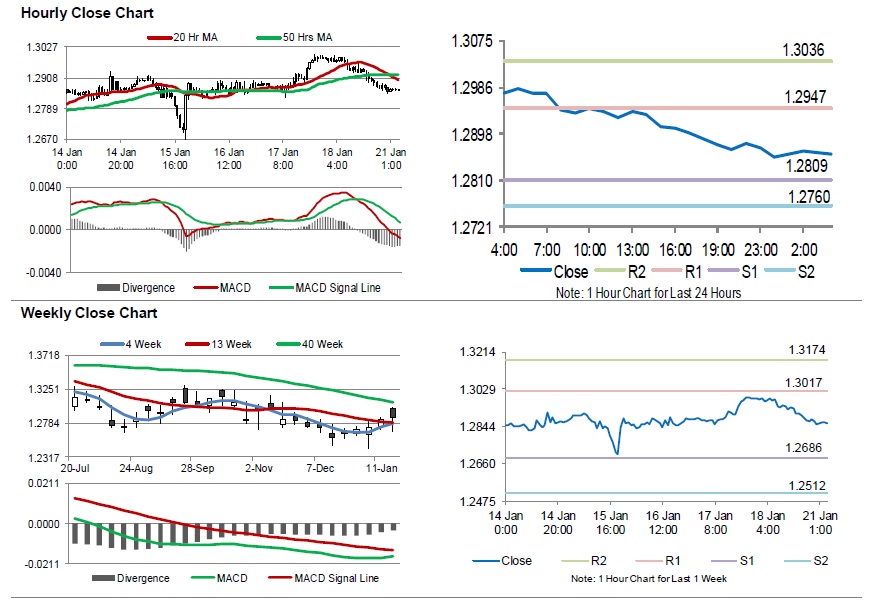
For the 24 hours to 23:00 GMT, the GBP declined 0.79% against the USD and closed at 1.2869 on Friday.
In economic news, UK's retail sales jumped 3.0% on an annual basis in December, compared to a revised rise of 3.4% in the previous month. Market participants had envisaged retail sales to advance 3.6%.
In the Asian session, at GMT0400, the pair is trading at 1.2859, with the GBP trading 0.08% lower against the USD from Friday's close.
Overnight data indicated that Britain's Rightmove house price index rose 0.4% on a yearly basis in January, following a gain of 0.7% in the preceding month.
The pair is expected to find support at 1.2809, and a fall through could take it to the next support level of 1.2760. The pair is expected to find its first resistance at 1.2947, and a rise through could take it to the next resistance level of 1.3036.
Amid lack of economic releases in UK today, traders would focus on global macroeconomic events for further direction.
The currency pair is trading below its 20 Hr and 50 Hr moving averages.
Japanese Yen Trading Higher In The Asian Session
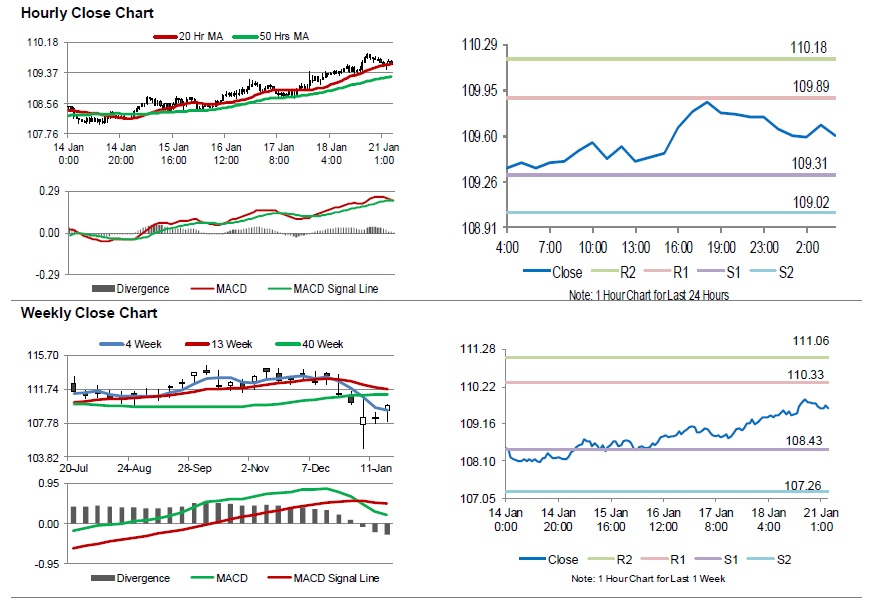
For the 24 hours to 23:00 GMT, the USD rose 0.38% against the JPY and closed at 109.76 on Friday.
In the Asian session, at GMT0400, the pair is trading at 109.60, with the USD trading 0.15% lower against the JPY from Friday’s close.
The pair is expected to find support at 109.31, and a fall through could take it to the next support level of 109.02. The pair is expected to find its first resistance at 109.89, and a rise through could take it to the next resistance level of 110.18.
In absence of key economic releases in Japan today, investor sentiment would be determined by global macroeconomic events.
The currency pair is showing convergence with its 20 Hr moving average and trading above its 50 Hr moving average.
Switzerland’s Producer And Import Price Index Rose Less-Than-Estimated In December
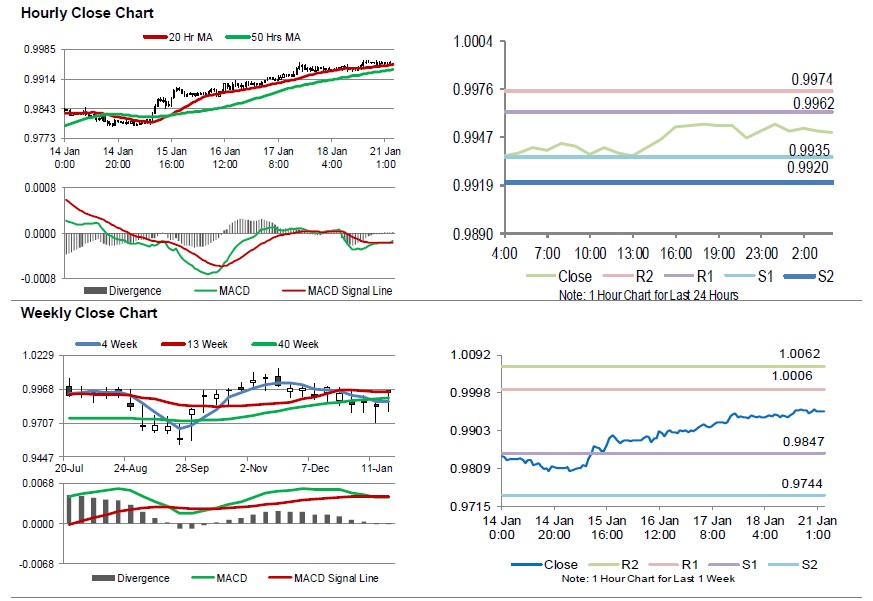
For the 24 hours to 23:00 GMT, the USD rose 0.17% against the CHF and closed at 0.9954 on Friday.
On data front, Switzerland's producer and import price index climbed 0.6% on an annual basis in December, undershooting market expectations for an advance of 1.0%. In the prior month, the index had recorded a rise of 1.4%.
In the Asian session, at GMT0400, the pair is trading at 0.9950, with the USD trading slightly lower against the CHF from Friday's close.
The pair is expected to find support at 0.9935, and a fall through could take it to the next support level of 0.9920. The pair is expected to find its first resistance at 0.9962, and a rise through could take it to the next resistance level of 0.9974.
Moving ahead, traders would keep an eye on Switzerland's M3 money supply for December along with total sight deposits, slated to release in a few hours.
The currency pair is showing convergence with its 20 Hr moving average and trading above its 50 Hr moving average
Canada’s Consumer Price Inflation Surprisingly Climbed In December
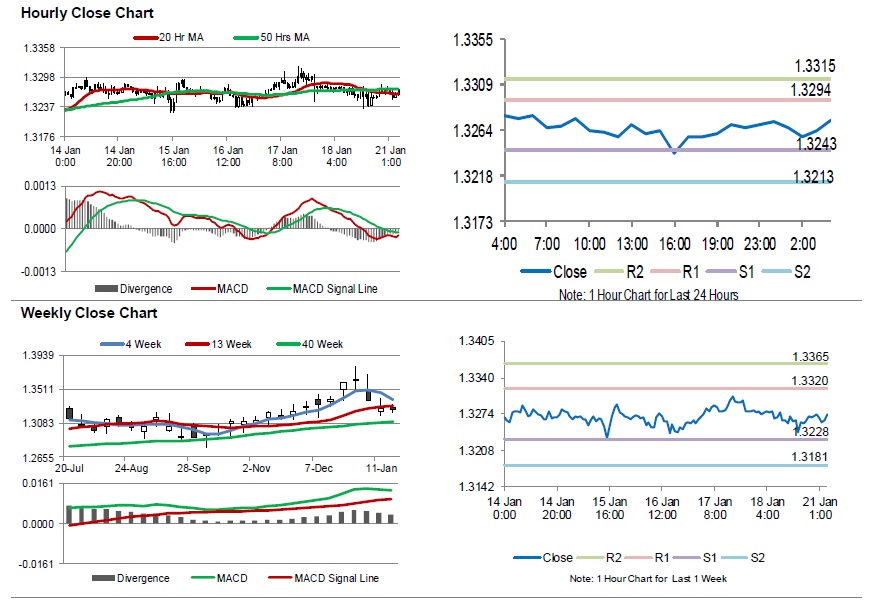
For the 24 hours to 23:00 GMT, the USD declined 0.05% against the CAD and closed at 1.3270 on Friday.
Data revealed that Canada's consumer price index (CPI) unexpectedly advanced 2.0% on an annual basis in December, defying market consensus for an unchanged reading. In the prior month, the CPI had recorded a rise of 1.7%.
In the Asian session, at GMT0400, the pair is trading at 1.3274, with the USD trading slightly higher against the CAD from Friday's close.
The pair is expected to find support at 1.3243, and a fall through could take it to the next support level of 1.3213. The pair is expected to find its first resistance at 1.3294, and a rise through could take it to the next resistance level of 1.3315.
The currency pair is showing convergence with its 20 Hr and 50 Hr moving averages.
Aussie Extends Its Losses In The Morning Session
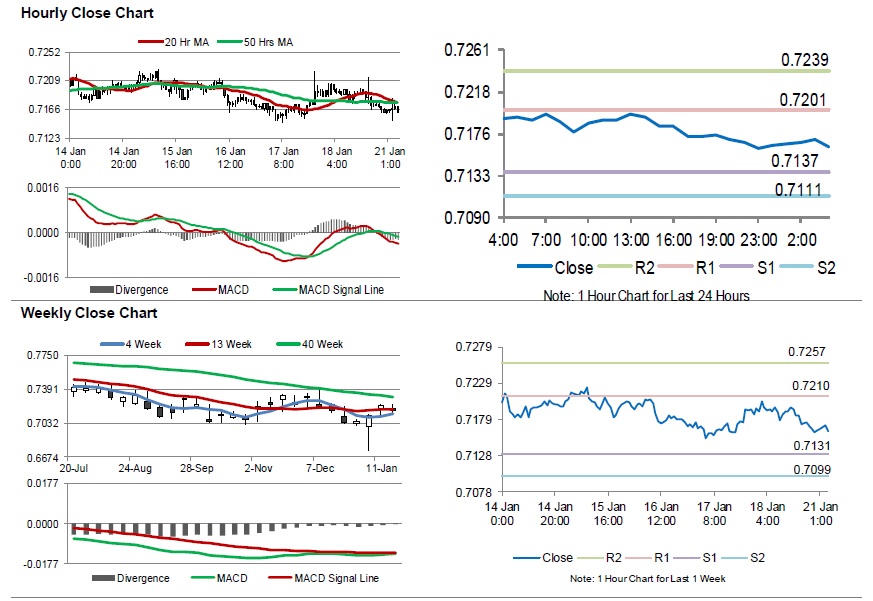
For the 24 hours to 23:00 GMT, the AUD declined 0.36% against the USD and closed at 0.7169 on Friday.
LME Copper prices rose 1.5% or $89.0/MT to $6022.0/MT. Aluminium prices rose 2.6% or $47.0/MT to $1851.0/MT.
In the Asian session, at GMT0400, the pair is trading at 0.7162, with the AUD trading 0.10% lower against the USD from Friday’s close.
Elsewhere in China, Australia’s largest trading partner, gross domestic product (GDP) growth slowed to a 28-year low level of 6.4% on a yearly basis in 4Q 2018, meeting market expectations. The GDP had recorded a gain of 6.5% in the prior quarter. Moreover, the nation’s retail sales unexpectedly rose 8.2% on an annual basis in December, compared to an advance of 8.1% in the previous month. Additionally, the nation’s industrial production climbed 5.7% on a yearly basis in December, surpassing market expectations for an increase of 5.3%. In the prior month, industrial production had registered a rise of 6.3%.
The pair is expected to find support at 0.7137, and a fall through could take it to the next support level of 0.7111. The pair is expected to find its first resistance at 0.7201, and a rise through could take it to the next resistance level of 0.7239.
The currency pair is trading below its 20 Hr and 50 Hr moving averages.
Gold: Yellow Metal Extends Its Losses In The Morning Session
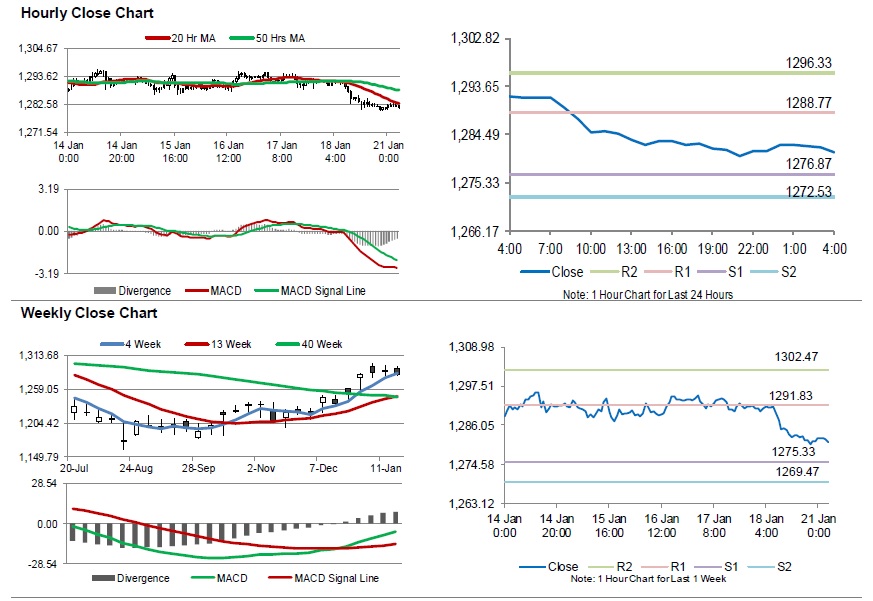
For the 24 hours to 23:00 GMT, Gold declined 0.71% against the USD and closed at USD1281.80 per ounce on Friday, amid strength in the US dollar.
In the Asian session, at GMT0400, the pair is trading at 1281.20, with gold trading 0.05% lower against the USD from Friday’s close.
The pair is expected to find support at 1276.87, and a fall through could take it to the next support level of 1272.53. The pair is expected to find its first resistance at 1288.77, and a rise through could take it to the next resistance level of 1296.33.
The yellow metal is showing convergence with its 20 Hr moving average and trading below its 50 Hr moving average.