

Sample Category Title
Silver: White Metal Trading On A Weaker Footing This Morning
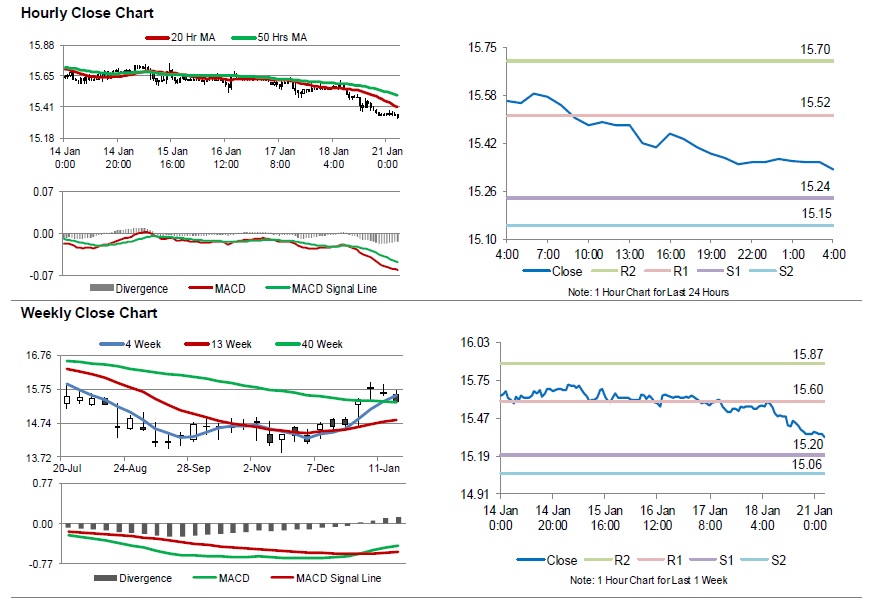
For the 24 hours to 23:00 GMT, Silver declined 1.16% against the USD and closed at USD15.38 per ounce on Friday, tracking losses in gold prices.
In the Asian session, at GMT0400, the pair is trading at 15.34, with silver trading 0.26% lower against the USD from Friday’s close.
The pair is expected to find support at 15.24, and a fall through could take it to the next support level of 15.15. The pair is expected to find its first resistance at 15.52, and a rise through could take it to the next resistance level of 15.70.
The white metal is trading below its 20 Hr and 50 Hr moving averages.
Crude Oil: Oil Extends Its Gains In The Asian Session
For the 24 hours to 23:00 GMT, Crude Oil rose 2.36% against the USD and closed at USD53.84 per barrel on Friday, amid signs of progress in US-China trade negotiations. Additionally, fresh figures from Baker Hughes disclosed that the number of active oil rigs dropped by 21 to 852 in the week ended 18 January.
In the Asian session, at GMT0400, the pair is trading at 54.08, with oil trading 0.45% higher against the USD from Friday’s close.
The pair is expected to find support at 52.88, and a fall through could take it to the next support level of 51.69. The pair is expected to find its first resistance at 54.72, and a rise through could take it to the next resistance level of 55.37.
Crude oil is trading above its 20 Hr and 50 Hr moving averages.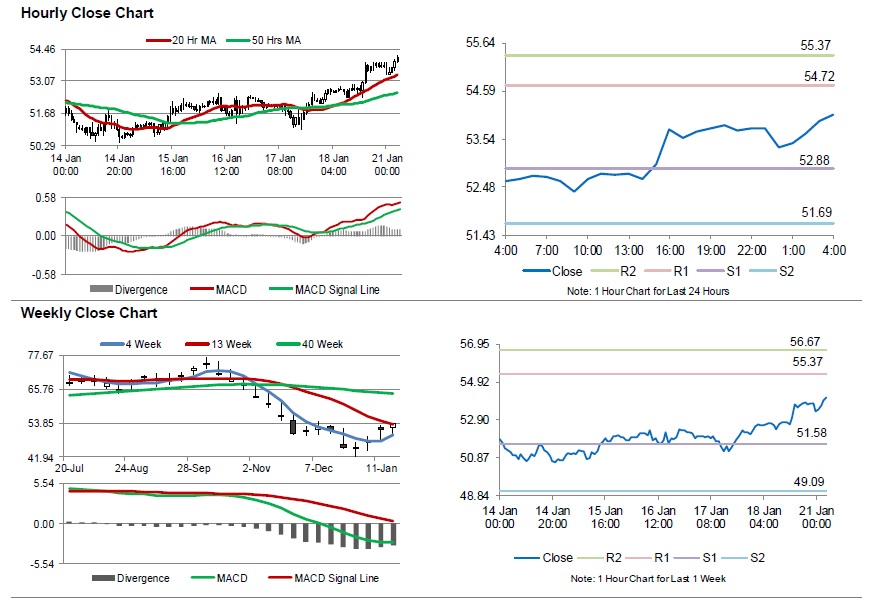
Recession risks increased in Japan, but Abe still on track for sales tax hike
The likelihood of a recession in Japan rose due to global economic slowdown and the indirect impact of US-China trade war, according to a Reuters poll between Jan 9-18. Yet economists were still optimistic that Japan economy will grow 0.8% in the fiscal year starting April.
28 of 38 economists said the chance of recession in fiscal 2019 has risen comparing with three months ago. 27 of 39 said Prime minister Shinzo Abe has over 80% chance to go ahead with the planned sales tax hike. For the October-December quarter when sales tax is raised, economist expected a sharp contraction of -3% in GDP. But over the fiscal year, it's estimated to expand 0.8%, then slow to 0.6% in fiscal 2020. National core CPI is seen to rise only 0.6% in fiscal 2019, staying way off BoJ's 2% target.
ECB Preview – ECB to Turn More Dovish as Economic Data Surprise to Downside
We expect ECB to turn more dovish at the meeting later this week, as economic data have pointed to further weakness. There are several issues worth watching for the meeting: rhetoric on economic outlook, instruments to alleviate tightening of credit conditions after the end of QE, and forward guidance on interest rates. Since macroeconomic data have surprised to the downside since the last meeting, we expect ECB to turn more dovish on the economic outlook. It would likely suggest that risk to growth is tilted to downside. On the monetary policy outlook, it would refrain from making any change to the forward guidance, although the market has already pushed back their rate hike expectations.
Further Deceleration in Economic Activities
Germany, the largest economy in the Eurozone, recorded the weakest growth in 5 years in 2018. GDP growth slowed to +1.5% y/y, compared with +2.2% in each of 2016 and 2017. Growth last year was supported by household consumption and government expenditure. Yet, the pace was significantly lower than in the last three years. A report from IFO Institute suggested that “the main reason for the slowdown was the weak rise in value added in German industry, which suffered from the global economic turbulence of last year”. It added that “the uncertainties surrounding the reintroduction of tariffs, the outcome of the Brexit negotiations and the new Italian government's budget plans have left deep scars on Germany's key sales markets. But homemade problems, especially related to new emission standards in the German automotive industry, also dampened the economy”.
Meanwhile, other data signaled that the weakness might not be temporary but could likely persist. As we mentioned in our report last week, headline inflation eased for two straight months, falling to 8-month low of +1.6% y/y in December. Core CPI steadied at +1% y/y during the month, due to weakness in energy prices. PMI, surprising to the downside, fell to a 4-year low of 51.1 in December.
The positive note comes from the employment market, though. The unemployment rate continues to fall, reaching a decade-low of 7.9% in November. However, divergence remains high across countries. While the unemployment rate in Germany was 3.3%, the rate in Spain was still elevated at 14.7%.
At the testimony before European Parliament last week, President Mario Draghi indicated that the region is not heading towards recession. Yet, he admitted that the slowdown could persist longer than expected. At the upcoming meeting, we expect ECB to turn more dovish on the economic outlook. It could likely adjust the rhetoric that the risks surrounding Eurozone’s growth outlook are “skewed to the downside”, rather than “broadly balanced”.
TLTROs
ECB officially terminated the asset purchase program in December. While it would reinvest the proceeds for “an extended period of time” which should well past that of the first rate hike, the credit conditions have inevitably tightened. The increase in borrowing costs would be further exacerbated by the weakening in the macroeconomic conditions. As we have mentioned previously, ECB should offer more hints on a new TLTRO at the upcoming meeting, if it is not going to announce a launch of it. We expect the central bank to make formal announcement in the first quarter of the year.
Forward Guidance on Interest Rates
The market has already pushed back their expectations on the first rate hike to mid-2020. Yet, we expect ECB to maintain its forward guidance that interest rate would stay unchanged “at least through the summer 2019”. ECB probably would wait for more incoming data before making such a change.
Brexit: No solution to Irish backstop yet after May’s Cabinet conference call
UK Prime Minister Theresa May is due to return to the parliament today to set out her Plan B on Brexit. The center of focus is her amendments regarding the Irish border backstop. May is trying to put up something that's, at the very least, acceptable to her fellow Conservatives and Northern Ireland ally DUP. But the Guardian reported that no solutions were found so far during the conference call with the Cabinet on Sunday evening. The consensus was only to renew efforts to find acceptable changes to the backstop arrangement with the EU, without any specifics.
Trade Minister Liam Fox warned over the weekend that "failure to deliver Brexit would produce a yawning gap between parliament and the people, a schism in our political system with unknowable consequences". And, that could trigger a "a political tsunami". And, he added that "Parliament has not got the right to hijack the Brexit process because Parliament said to the people of this country: 'we make a contract with you, you will make the decision and we will honour it'".
Opposition Labour leader Jeremy Corbyn reiterated the call for May to rule out no-deal Brexit. He said in a statement that "We're ready to talk to the government and others in parliament about a sensible alternative plan, but not while Theresa May is wasting 171,000 pounds an hour of taxpayers' money on dangerous and unnecessary no-deal brinkmanship." And, "If the prime minister is serious about finding a solution that can command support in parliament and bring our country together, she must listen to the majority of MPs, as well as members of her own cabinet, and take 'no deal' off the table."
China GDP growth slowed to lowest in 28 years, but stabilization seen in December
China GDP growth slowed to 6.4% yoy in Q4, down from 6.5% yoy and matched expectation. For the whole year of 2018, growth slowed to 6.6%, lowest in 28 years since 1990. National Bureau of Statistics head Ning Jizhe said the impacts from trade war with the US are manageable. There were signs of stabilization in the economy over the past twos months. And he added the country has confidence and the capacity to achieve reasonable growth in 2019.
Other December data released today are positive though. Retail sales grew 8.2% yoy, up from 8.1% yoy and beat expectation of 8.1% yoy. Industrial production rose 5.7% yoy, up fro 5.4% and beat expectation of 5.3% yoy. Fixed assets investment grew 5.9% yoy, unchanged from November, but missed expectation of 6.0%.
While there were signs of improvements in Decembers, it's generally expected that the Chinese economy will face downward pressure ahead. In particular, the risks of escalation in trade war with the US remains. Chinese Vice Premier Liu He is set to visit Washington on January 30-31 for another round of trade talks. At this point, little sign of progress is seen regarding the core concerns of the US, including intellectual property theft, forced technology transfer and dominance of state-owned enterprises.
More stimulus is expected from the authority to support the economy. The PBoC has already injected CNY 560B into the economy last Wednesday. The RRR was also lowered again earlier this year to free up Monday for small companies. Yet, it's reported that Beijing was planning to lower its growth target to 6-6.5 percent this year.
GBP/USD Could Extend Correction, USD/CAD May Dip Slightly
GBP/USD gained a lot of momentum recently and tested the 1.3000 resistance area. USD/CAD is currently consolidating, but it may start a fresh upward move after a tiny downside correction.
Important Takeaways for GBP/USD and USD/CAD
- The British Pound rallied recently above the 1.2800 and 1.2920 resistance levels.
- Recently, there was a downside correction below a major bullish trend line with support at 1.2885 on the hourly chart of GBP/USD.
- USD/CAD is trading nicely above the 1.3250 and 1.3240 support levels.
- There is a breakout pattern formed with resistance at 1.3275 on the hourly chart.
GBP/USD Technical Analysis
The British Pound found started a sharp upward move from the 1.2700 support area against the US Dollar. The GBP/USD pair traded above the 1.2800, 1.2850 and 1.2920 resistance levels.
The upward move was strong as the pair even broke the 1.2950 resistance and tested the 1.3000 resistance. A high was formed at 1.3000 on FXOpen and later the pair started a downside correction.
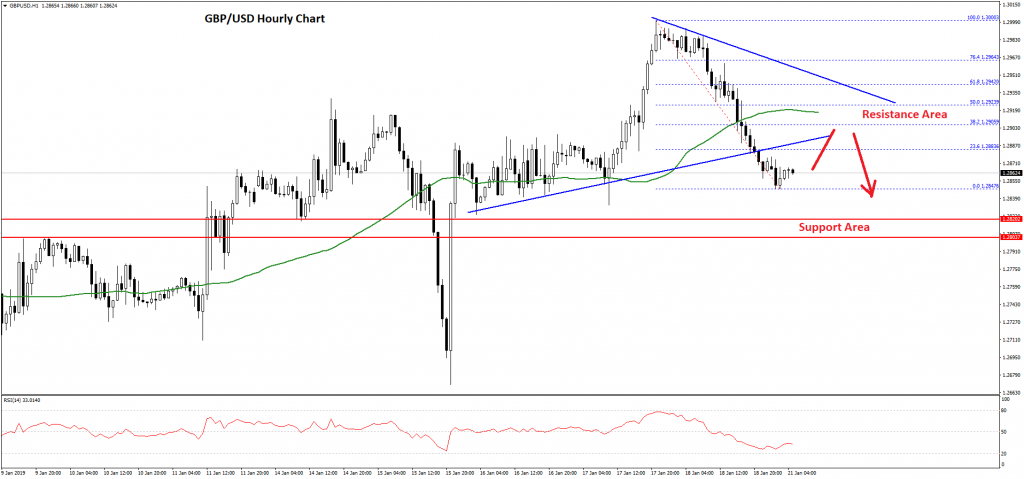
It declined below the 1.2950 support, the 50 hourly simple moving average, and a major bullish trend line with support at 1.2885 on the hourly chart of GBP/USD. Moreover, sellers pushed the pair below the 1.2900 support and a low was formed at 1.2847.
The pair is currently consolidating losses above the 1.2850 level, with an immediate resistance at 1.2880. The 23.6% Fib retracement level of the last decline from the 1.3000 high to 1.2847 low is also near the 1.2880 level.
However, the main resistance is near the 1.2920 and 1.2930 levels. The 50 hourly simple moving average is also positioned near the 1.2920 level plus the 50% Fib retracement level of the last decline from the 1.3000 high to 1.2847 low.
Therefore, if there is an upside correction, the pair is likely to test the 1.2900 and 1.2920 resistance levels. However, there is a risk of more losses towards the 1.2800 support level in the near term.
USD/CAD Technical Analysis
The US Dollar traded higher slow and steadily above the 1.3250 resistance area against the Canadian Dollar. The USD/CAD pair even broke the 1.3280 resistance area to move into a bullish zone.
Recently, the pair climbed above the 1.3300 level and the 50 hourly simple moving average. A high was formed at 1.3318 and later the pair started a downside correction. It declined below the 1.3250 support and the 50 hourly SMA.
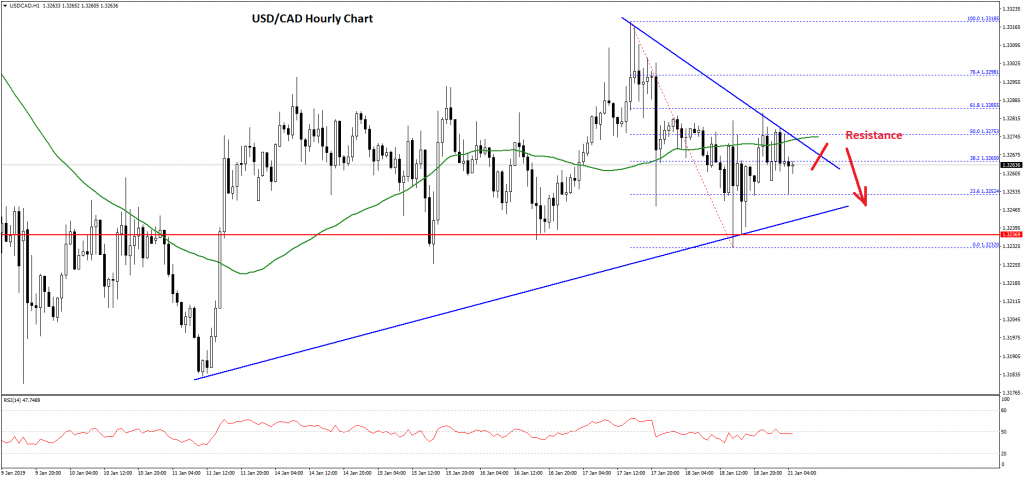
A low was formed at 1.3232 and the pair is currently trading above 1.3250. It seems like there is a breakout pattern formed with resistance at 1.3275 on the hourly chart.
The triangle resistance coincides with the 50% Fib retracement level of the recent decline from the 1.3318 high to 1.3232 low. If there is a positive break above the triangle and the 1.3280 resistance, there could be more gains.
The next stop could be 1.3300 and the 76.4% Fib retracement level of the recent decline from the 1.3318 high to 1.3232 low. Above 1.3300, the pair may continue to gain and it will most likely break the 1.3318 high to test the 1.3350 level.
On the downside, a break below the 1.3250 support may call for an extended downside correction to 1.3220 before a fresh upward move.
EUR/USD Trimmed Gains, Could Revisit 1.1300
Key Highlights
- The Euro failed to hold the 1.1440 support and declined heavily against the US Dollar.
- There is a major bearish trend line formed with resistance at 1.1390 on the 4-hours chart of EUR/USD.
- The US Industrial Production in Dec 2018 increased 0.3% (MoM), more than the +0.2% forecast.
- The German Producer Price Index for Dec 2018 will be released today, which could decline 0.1% (MoM).
EURUSD Technical Analysis
After trading above the 1.1550 level, the Euro failed to clear the 1.1570 resistance against the US Dollar. The EUR/USD pair started a fresh decline and broke the 1.1500 and 1.1440 support levels.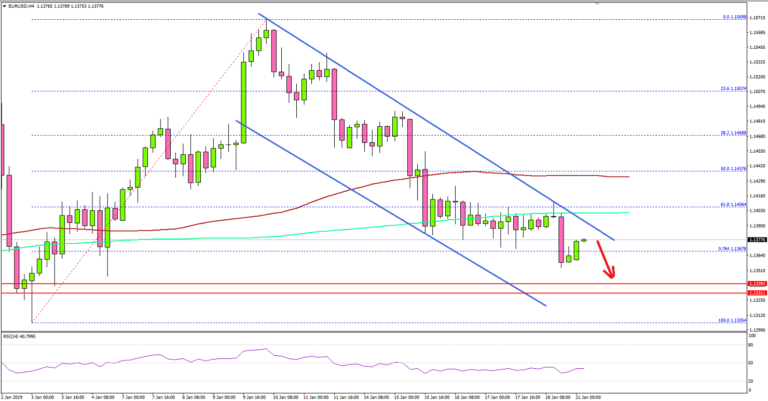
Looking at the 4-hours chart, the pair even broke the 1.1400 support and the 61.8% Fib retracement level of the last wave from the 1.1305 low to 1.1569 high. There was even a close below the 1.1400 level and the 100 simple moving average (red, 4-hours).
It opened the doors for more losses and the pair dipped below the 1.1380 level and the 76.4% Fib retracement level of the last wave from the 1.1305 low to 1.1569 high.
This means there are high chances that EUR/USD could retest the 1.1305-1.1310 support area. On the upside, there are many hurdles for buyers near the 1.1400 and 1.1440 levels.
Besides, there is a major bearish trend line formed with resistance at 1.1390 on the same chart. Therefore, a close above the trend line, 1.1400, and the 100 simple moving average (red, 4-hours) is needed for a fresh upward move.
Fundamentally, the US Industrial Production for Dec 2018 was released recently. The market was looking for an increase of around 0.2% in the production compared with the previous month.
However, the actual result was better than the forecast as there was a 0.3% increase in the US Industrial Production. On the other hand, the last reading was revised down from +0.6% to +0.4%.
Overall, the EUR/USD pair remains at a risk of more losses, but GBP/USD remains well supported on the downside.
Economic Releases to Watch Today
- German Producer Price Index for Dec 2018 (MoM) – Forecast -0.1%, versus +0.1% previous.
- German Producer Price Index for Dec 2018 (YoY) – Forecast +3.2%, versus +3.3% previous.
Market Morning Briefing: Dollar Yen Is Rising And Could Target 110.55 In The Near Term
STOCKS
Although we had been bearish on the Dow and DAX, both have moved up well on Friday, along with shanghai and Nikkei. No profit-taking has set in yet.
The Dow (24706.35, +336.25, +1.38%) rose strongly on Friday and now looks likely to move up towards 25000-250. NOTE, however, that the USA has a holiday today.
Contrary to our expectation of a fall towards 10700, the DAX (11205.54, +286.92, +2.63%) has broken strongly above 11000. This possibly opens the upside to 11400-600 now.
while we remain long-term bullish on the Shanghai (2609), we have to be a little cautious about Resistance at 2627 (21-MA on Weekly Line chart). A break above that is needed to propel it higher.
The Nikkei (20748) has validated our overall bullishness and may have some more room on the upside towards 21000-200 while above 20300, aided by a weaker Yen (109.64)
While the other indices moved up well on Friday, the Sensex (36386.61) and Nifty (10906.95) did not move at all on Friday. As mentioned, proper bullishness can set in once crucial Resistances at 36500 and 11000 respectively are broken.
COMMODITIES
Gold and Silver could be slightly bearish while Copper and Crude prices could see some upside.
Brent (62.77) and WTI (54.09) have risen and are trading higher just now. Immediate resistance above 62.50 is now seen at 64 which need to break on the upside to indicate medium to long term bullishness. WTI has similar resistance near 55-56 region.
Brent-WTI spread (8.71) is down from 9.01 seen on Friday. As expected the spread is falling and could test 7.55-7.15 in the near term.
Gold (1282.20) and Silver (15.37) are trading lower. Gold has been trading sideways in the 1280-1300 region for a few session now and while the resistance near 1300 holds, we could see a fall towards 1250 in the near term. Silver is likely to come off towards support near 15.25-15.20 before bouncing back from there.
Copper (2.7055) has scope of rising towards 2.75/77 levels on the upside while attempting a rise above 2.70. Near term looks bullish.
FOREX
Dollar Index (96.30) is trying hard to rise towards daily resistance near 97.25. We could see a small dip from 96.50 before the index moves higher towards 97.25 in the medium term.
Euro (1.1375) has immediate trend support at 1.1350 and while that holds, a bounce in the near term could be possible back to 1.14-1.15. Near term is bullish while above 1.1350. Only on a break below this, we would expect a fall towards 1.12.
The Euro-Yen (124.78) is trading in the 123.60-125.20 region and could be sideways ranged for some more sessions unless a sharp sustained break is seen on either side.
Dollar Yen (109.66) is rising and could target 110.55 in the near term. On the weekly candles, the pair looks bullish for the medium to long term with enough room on the upside towards 113-114 levels. View is bullish while above 107-108.
Pound (1.2861) is trading low but could bounce back from 1.28 back towards 1.30 in the coming sessions. In the medium term, while resistance at 1.30 holds, Pound could come off towards 1.2750. Near term could see a rise towards 1.30 before again falling off from there.
Aussie (0.7166) has been trading sideways for the last 5-6 sessions and while immediate resistance holds near 0.73, Aussie could gradually come off towards 0.71-0.70. There could be some scope of testing 0.73 on the upside while the view is bearish for the medium term.
USD-CNY (6.7879) has been rising as expected and looks bullish towards 6.83 in the near term.
Dollar Rupee (71.19) is likely to remain below 71.40 today, trading between 70.90 and 71.40 for a couple of sessions. Above 71.40, there is scope for the pair to test 71.60.
INTEREST RATES
Further rise in US yields on Friday, in line with expectation. In fact, the 5Yr (2.62%, up from 2.57%) has pulled ahead of the 2Yr (2.61%, up from 2.57%).
With the 10Yr (2.78%, up from 2.75%) and 30Yr (3.10%, up from 3.07%) both rising by 3bp, the 30-10 Spread (0.32%) was stable. The 30-5 Spread (0.48%) has come down a bit from 0.50%. Further dip towards 0.30% and 0.25% and 0.45% are likely on the 30-10 Spread and 30-5 Spread respectively.
The German-US 2Yr Spread (-3.15%) and 10Yr Spread (-2.52%) have drifted lower as the US yields have risen. Some more downside towards -3.20% and -2.55% is likely.
Also, the US-Japan 10Yr Spread (2.78%) is continuing to rise, supporting the rise in Dollar-Yen.
The 10Yr GOI (7.5959%) seems to be trying to break above 7.59%. If the rise sustains, we can see a further rally towards 7.70%.
Daily Markets Broadcast
Wall Street advances to five-week high
Hopes for a solution to the US government shutdown and progress in the US-China trade negotiations helped US indices power to the highest levels since mid-December on Friday. China Q4 GDP data are on tap today, which could determine near-term direction, while GBP traders await PM May’s alternative Brexit proposals.
US30USD Daily Chart
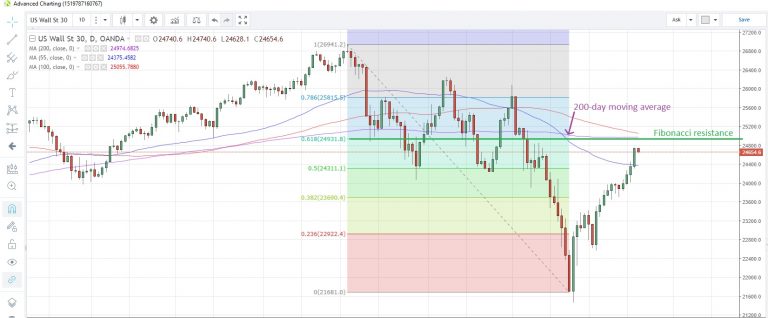
The US30 index climbed to the highest level since December 3, extending gains to a fourth week, as US President Trump prepared to announce a proposal to end the government shutdown. The proposal was immediately panned by both sides and branded a non-starter by House speaker Pelossi. US indices look to be edging lower in early trading today
The index is approaching the congestion area of the 61.8% Fibonacci retracement of the October-December drop at 24,932 and the 200-day moving average at 24,975
Today is a US bank holiday commemorating Martin Luther King’s birthday.
DE30EUR Daily Chart
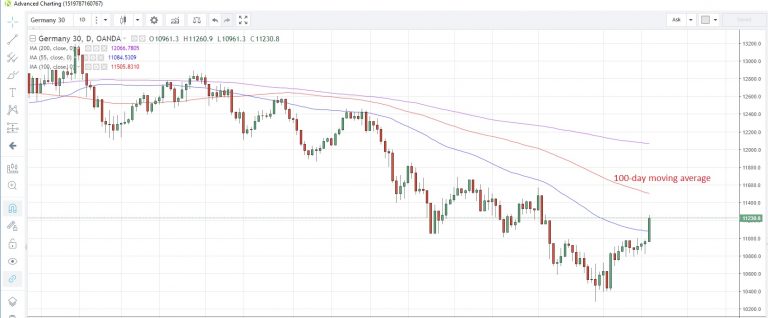
The Germany30 index posted the biggest one-day gain since January 4 on Friday, hitting the highest level since December 5
The 55-day moving average at 11,084 was breached for the first time since September 28. The 100-day moving average is at 11,506
German producer prices are expected to drop 0.1% m/m in December, the first monthly decline since February last year, potentially reducing pressure on the central bank to hike rates.
CN50USD Weekly Chart
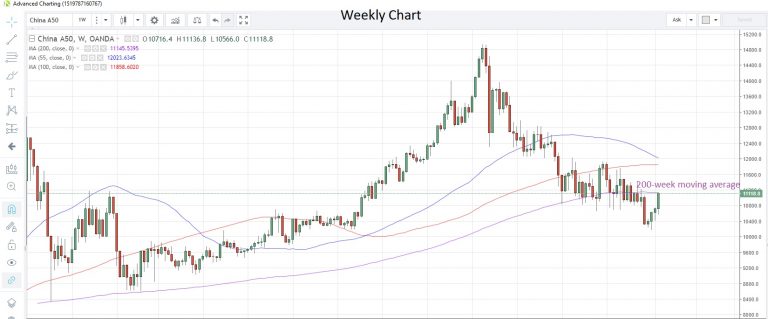
The China50 index closed at its highest level since December 14 on Friday, buoyed by Wall Street sentiment
The index nearly touched the 200-week moving average at 11,146 last Friday, but closed above the 100-day moving average at 11,069 for the first time since December 3
The Chinese economy is seen expanding 6.4% y/y in Q4, the slowest growth since Oanda records began in 2010. On Friday, 2017’s full-year growth was downgraded to 6.8% from 6.9%, which could help make the 2018 numbers look a bit better.