Sample Category Title
UK PM May won confidence vote, to table way forward for Brexit next Monday
UK Prime Minister Theresa May won the confidence vote narrowly by 325-306 in the Commons, a day after her Brexit plan was rejected. Now, she has started meeting some party leaders to "find solutions that are negotiable and command sufficient support" from the House. May also plans to return to the House on Monday to "table an amendable motion and to make a statement about the way forward." And she reiterated the pledge to deliver Brexit.
However, there is no meeting with opposition Labour leader Jeremy Corbyn yet. Corbyn insisted that there will be not talks unless no-deal Brexit is ruled out. His spokesman said "Of course (Labour leader) Jeremy is prepared to meet the prime minister but if we're talking about substantive talks on how to resolve the crisis over Brexit ... then the starting point for that needs to be that no deal comes off the table."
Market Morning Briefing: Pound And Aussie Have Dipped Slightly
STOCKS
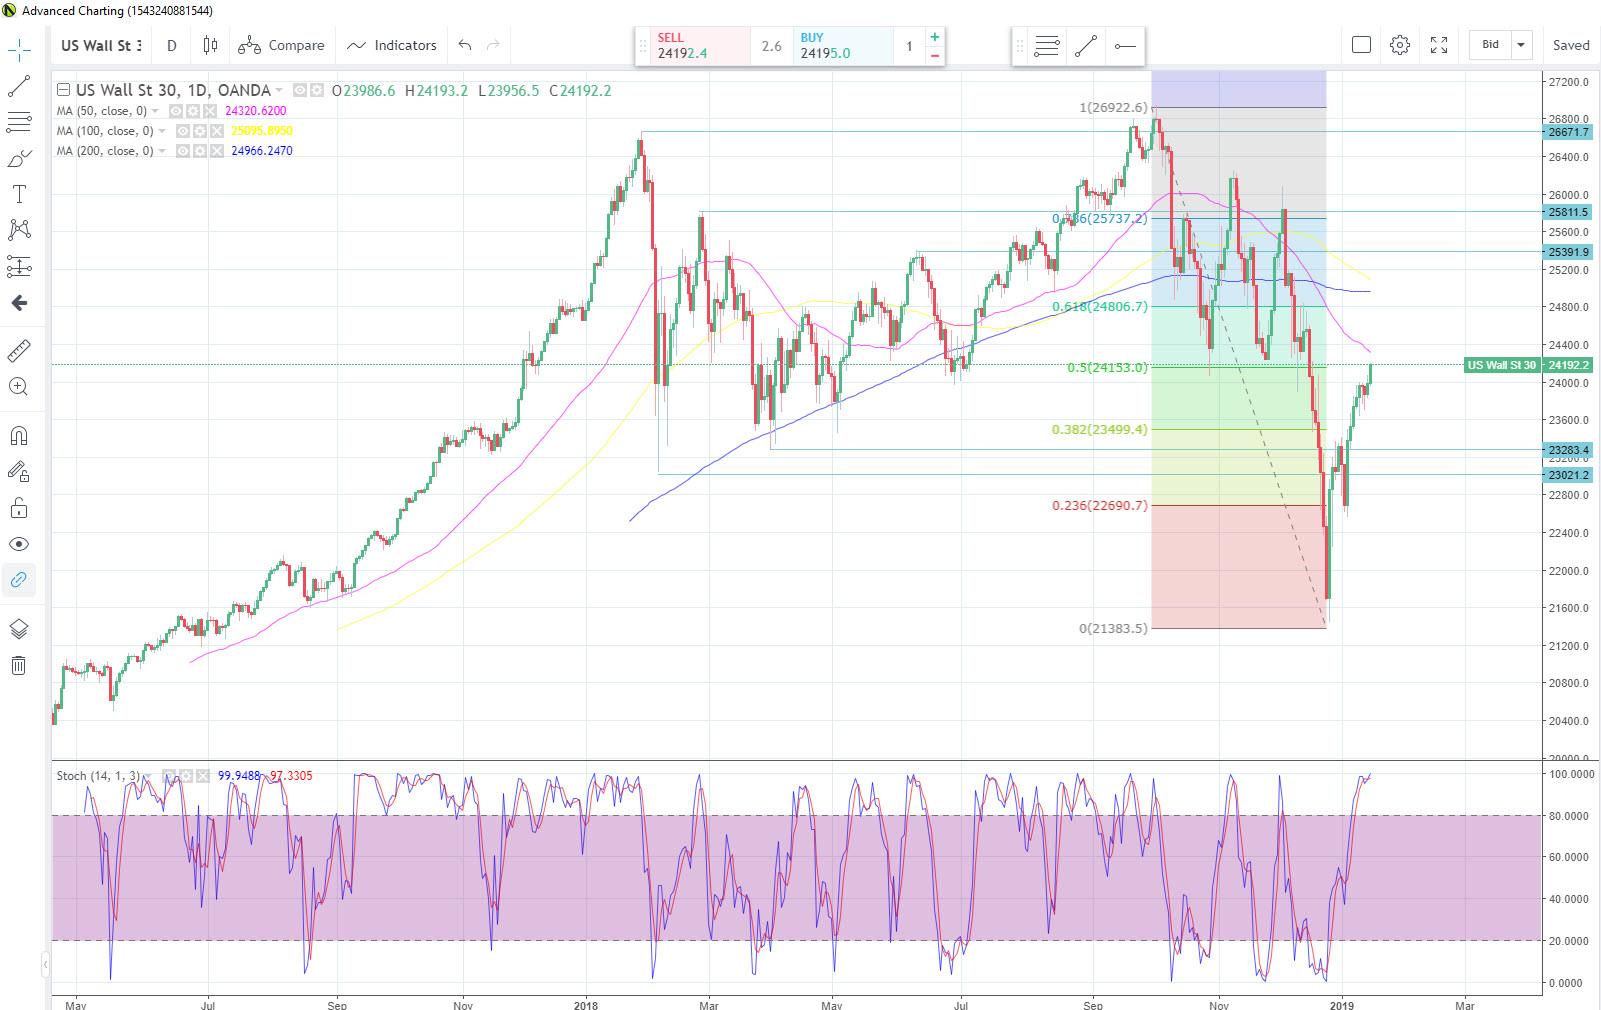
The Dow (24207.16, +141.57, +0.59%) saw a high of 24288.61 yesterday, rising into the 24100-500 Resistance region mentioned yesterday. It is highly Overbought in the near term now and we continue to be cautious at these levels, as they could invite profit-taking.
Similarly, while the DAX (10931.24, +39.45, +0.36%) has risen some more yesterday, we think Resistance at 11000 could trigger profit-taking.
Watch Resistance at 2627 (21-MA on the Weekly Line chart) on the Shanghai (2570.42). A break thereof is needed to confirm the anticipated long-term bullishness.
The Nikkei (20442) dipped a bit yesterday, but as suggested, remains a "buy on dips" up to 20000-19800.
The Sensex (36321.29) and Nifty (10890.30, +3.50, +0.03%) are trying to break past the mentioned Resistances at 36500 and 11000. Let us watch if they are able to do so.
COMMODITIES
Overall commodities are stable. A sharp movement is likely to be seen in the near term.
Brent (61.03) and Nymex WTI (52.03) are stable just now and are well holding below the immediate resistances at 62 and 54 respectively and could dip slightly before resuming the rise back to higher levels. The rest of the sessions this week could be stable.
Narrow and small movements are seen in Gold (1294.60) for the last few sessions. Immediate support is seen at 1290 on the daily candles which if holds could possibly take the price towards 1300-1320 levels in the near term. At the same time note resistance near 1300 on the 3-day line chart which indicates a fall towards 1250 in the medium term. We need to watch price action near current levels to get clarity on immediate direction.
Silver (15.63) could fall towards 15 after some ranged movement within 16.0-15.50 region is seen. Long term down channel remains intact as seen on the weekly candles.
Copper (2.6715) is trading sideways in the 2.62-2.68 region and if it sustains above 2.62, it could try to move up towards 2.70 and higher in the near term. A break above 2.70 is needed to trigger further bullishness towards 2.80/85. Else a fall back towards 2.60/55 could be on the cards. Long term support on the line charts indicate a rise in the longer run.
FOREX
Rise in Dollar Index (96.12) and corresponding fall in the Euro (1.1389) could keep the pressure on for a couple of sessions. Euro could test 1.1350-1.13 on the downside while Dollar Index could be limited to 96.50. Only if the Dollar Index breaks above 96.50, could we expect a sharp rise back towards 98 while Euro could come off towards 1.12.
The Euro-Yen (124.12) managed to rise from levels near 123.6 seen yesterday. While there is enough room for a fall towards 122.80-122.00 levels; the pair needs to rise above 125.20 to move higher towards 127-128. While below 125.20, view remains bearish.
Dollar Yen (108.99) seems to be tilting to the upside. While 107-108 holds, Yen could weaken towards 110 on the upside. Near term looks bullish for Dollar-Yen.
Pound (1.2874) and Aussie (0.7168) have dipped slightly. While Pound faces resistance near 1.2930, Aussie has some room towards 0.73. In case Copper rises past 2.70 on the upside, Aussie could resume rising towards 0.73 in the near term. Pound if holds below 1.2930 could be bearish towards 1.2750 in the next few sessions.
USD-CNY (6.7641) has dipped a bit but looks bullish towards 6.80 in the near term.
Dollar Rupee (71.25) closed higher breaking our expected near term resistance at 71.15. While the pair manages to trade higher it could target 71.40/60 levels by next week if bullish momentum continues. Else a small dip could be seen towards 71.00-70.90 before again rising higher. The NDF is trading at 70.90 indicating a possible gap down or session opening below 71.25 today. Also note decent resistance near 71.25 (38.2% retracement of a fall from 74.50 in Oct'18 to 69.23 in Jan'19) which could hold for a session or two.
INTEREST RATES
US Yields have been creeping up for the last few days and the Curve has been getting steeper at the Far end. Now, there is Resistance coming up near 0.60% on the 30-5 Spread (0.53%) and near current level (0.35%) on the 30-10 Spread. The 30Yr (3.07%) itself has Resistance near 3.09% and could start coming down faster than the rest of the Curve in the coming sessions.
The German-US 10Yr Spread (-2.50%) has been coming off from -2.44% and might dip towards -2.55% in the coming weeks as the German 10Yr (0.22%) could dip towards 0.20% or even lower. If so, it might be a little bearis.
The US-Japan 10Yr Spread (2.73%) has moved up from 2.64% at the beginning of the month and could move up some more towards 2.75%
The 10Yr GOI (7.5633%) has immediate Resistance at 7.59%, the 38.2% retracement of the fall from 8.18% to 7.22%. Maybe it holds. In case it breaks, the next upside target would be 7.70%.
Crude Oil Price Remains Supported Near $50
Key Highlights
- Crude oil price traded higher recently and tested the $53.20 resistance against the US dollar.
- There is a key bullish trend line formed with support at $50.45 on the 4-hours chart of XTI/USD.
- The US Import Price Index in Dec 2018 declined 1% (MoM), which was better than the -1.3% forecast.
- Today, the US Initial Jobless Claims for the week ending Jan 12, 2019 will be released, which is forecasted to increase from 216K to 220K.
Crude Oil Price Technical Analysis
During the past two weeks, there was a steady increase in crude oil price from the $44.20 swing low against the US Dollar. The price broke the $48.00, $50.00 and $52.00 resistances to move into a positive zone.
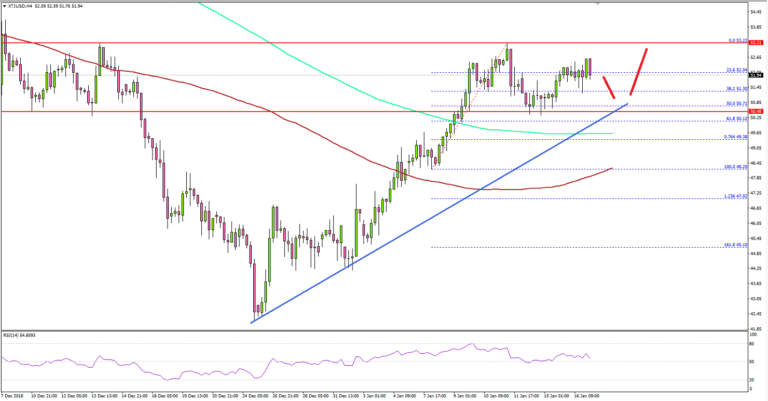
Looking at the 4-hours chart of XTI/USD, the price even broke the $52.50 and $53.00 resistance levels plus settled above the 100 (red) simple moving average (4-hours) and the 200 (green) simple moving average (4-hours).
However, the $53.20 level acted as a solid resistance and prevented further upsides. Later, there was a downside correction below $52.00 and the 38.2% Fib retracement level of the last wave from the $48.20 low to $53.22 high.
The decline was limited by the $50.50 support and the 50% Fib retracement level of the last wave from the $48.20 low to $53.22 high. There is also a key bullish trend line formed with support at $50.45 on the same chart.
Therefore, dips in oil price towards the $50.50 and $50.45 levels remain supported, below which the price may slide towards the $50.00 handle. On the upside, the $53.20 level is a solid hurdle, above which buyers are likely to look for a test of the $55.00 level.
Looking at major pairs, EUR/USD declined recently and corrected below the 1.1440 support. On the other hand, dips in GBP/USD found support and the pair stayed above the 1.2750 pivot area.
Economic Releases to Watch Today
- Euro Zone CPI for Dec 2018 (YoY) – Forecast +1.6%, versus +1.6% previous.
- Euro Zone CPI for Dec 2018 (MoM) – Forecast 0%, versus -0.2% previous.
- US Initial Jobless Claims – Forecast 243K, versus 244K previous.
Daily Markets Broadcast
Wall Street lifted by strong bank earnings
The financial sector has kicked off the earnings reporting season, with encouraging results. PM May’s government survives the no-confidence vote. Rumours of a Brexit delay are circulating in the European press.
US30USD Daily Chart
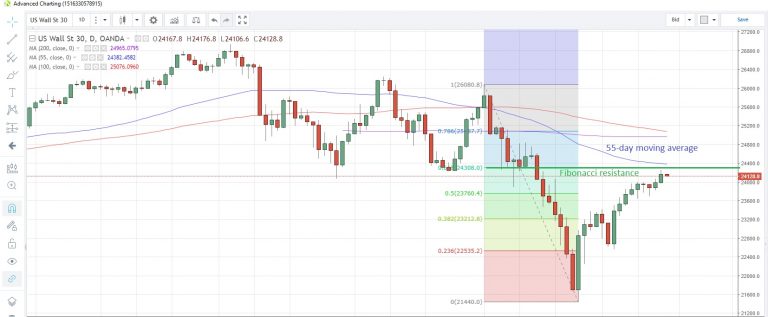
The US30 index advanced to the highest level in a month yesterday as Bank of America and Goldman Sachs reported strong earnings
The index is edging toward the 61.8% Fibonacci retracement of December’s drop at 24,308, while the 55-day moving average has edged lower to 24,382
Fed’s Quarles is due to speak later today. The Fed’s Beige Book released yesterday showed modest to moderate economic growth in 8 out of the 12 Federal Reserve districts.
DE30EUR Daily Chart
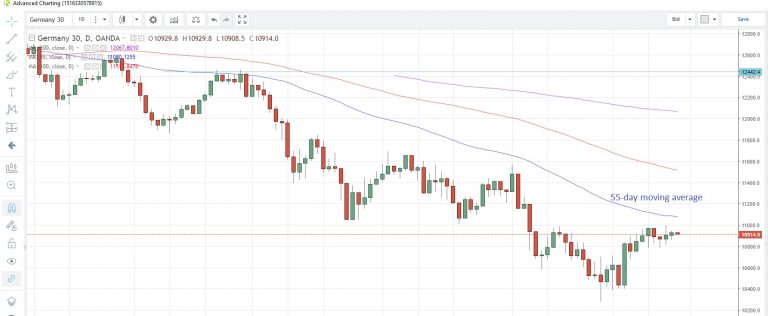
The Germany30 index climbed for a second straight day yesterday, despite the UK’s Brexit issue remaining unresolved
The 55-day moving average at 11,080 continues to cap prices near term, as it has since September 28
German press reported that the EU may consider easing terms on the Ireland border, while the UK’s Financial Times said Germany and France could be amenable to talks about a Brexit delay until 2020.
WTICOUSD Daily Chart
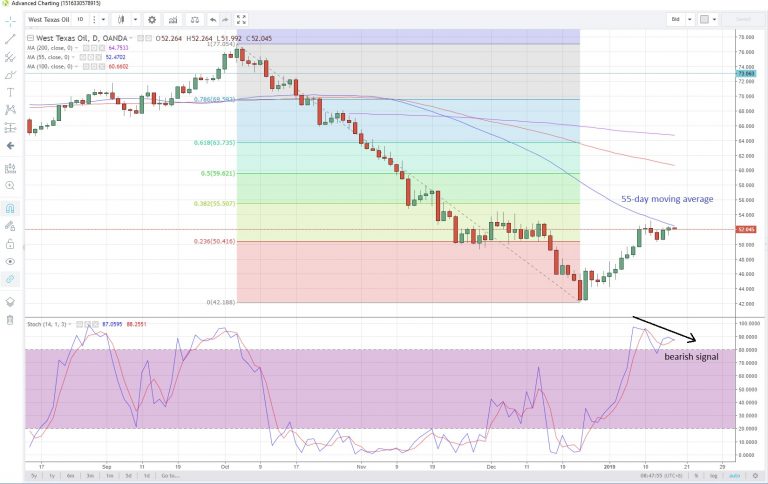
Oil prices look set to snap a two-day advance as upward momentum appears to be waning after a 26% rally from December’s low
The 55- day moving average at $52.47 is currently acting as a strong resistance point. It has capped prices since October 17
Yesterday’s EIA inventory data showed another drawdown from stockpiles in the week to January 11, this time 2.68 million barrels. That’s the second consecutive weekly decrease and the most in six weeks.
Eco Data 1/17/19
[php_everywhere instance="1"]
China’s Q4 GDP Growth to Flash Red
China will report GDP growth figures for the fourth quarter of 2018 early on Thursday at 0200 GMT, potentially injecting further volatility to the markets as investors search for more convincing clues on how bad the US-Sino trade war can hurt. Forecasts are for a slightly smaller annual expansion of 6.4%, the lowest rate achieved in almost a decade.
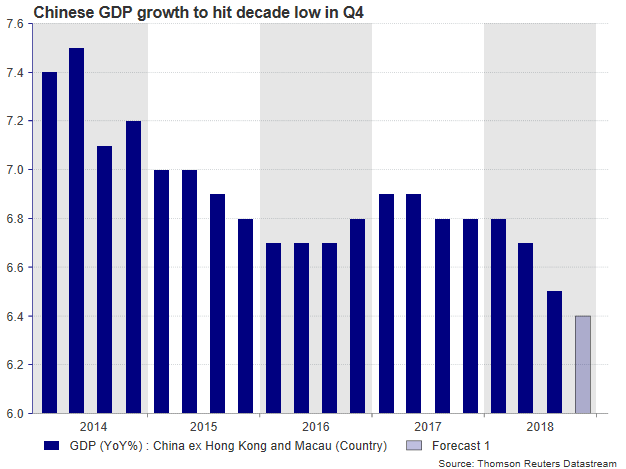
In the third quarter, the Chinese economy geared down for the third consecutive time, marking an annual growth rate of 6.5% – the weakest registered since Q1 2009. The data was interpreted as adding evidence that the US tariffs and the growing uncertainty about how long the trade drama will continue have already started to bite economic activity in the world’s second biggest economy, with investors speculating that it won’t take long for other economies to feel the pinch as well.
Stocks plunged, and the yuan tumbled in the wake of the data, forcing the People’s Bank of China to cut reserve requirements from banks to mitigate any upcoming downturn with more liquidity.
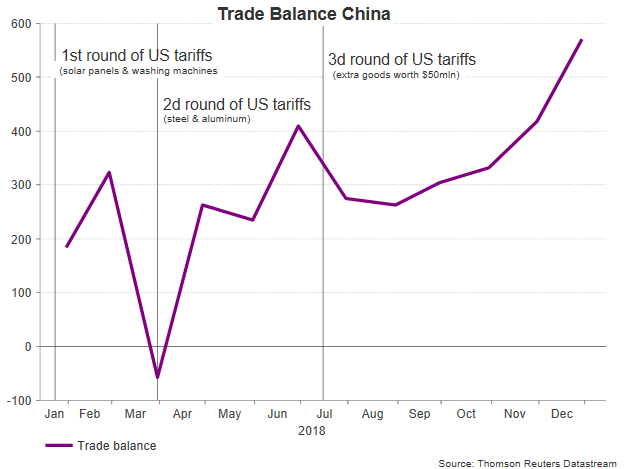
The government seems stressed itself too. Despite trade surplus with the rest of the world hitting three-year highs in December, the Ministry of Finance promised to slash taxes at a larger scale especially for small businesses and step up fiscal expenditures as the negative export figures and a contracting Manufacturing PMI flagged that the slowdown in the business sector might be more than temporary. Meanwhile, policy sources revealed that the growth target for 2019 could be set between 6.0-6.5% when the Parliament meets in March, a less ambitious goal than the “around 6.5%” target agreed for 2018.
Support also looks to be lacking on the demand side, with retail sales holding in a downtrend since the start of 2018, something Apple underlined in its recent sales guidance when it said that its sales were performing poorly in the region. The falling inflation which deviates below the central bank’s 3.0% target is another worrying sign of cooling domestic consumption which leaves more room for the central bank to loosen monetary policy.
Although it’s still unclear which of the two countries will lose the most in the trade war game – the US economy has also softened in several areas – another downbeat GDP report would confirm that US protectionism has made things difficult for China. The news will be particularly unpleasant to the ruling Communist Party which aims to make China the hub of technological intelligence by 2025 through its strategic “Made in China” plan. In other words, with Washington pressing for more protection of its technological knowledge and tariffs restricting expansion in China, Xi Jinping might fall behind on his policy agenda.
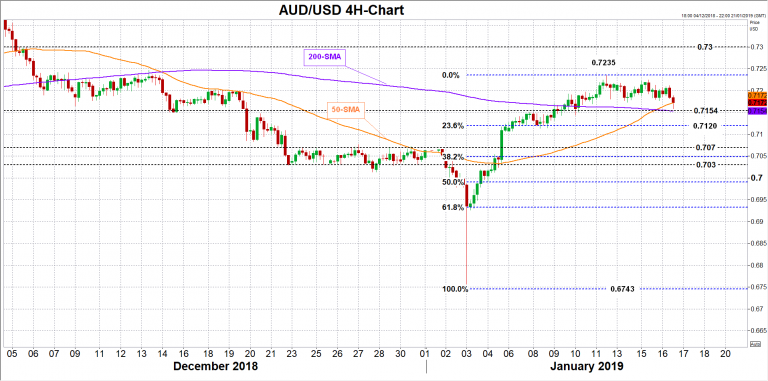
In market reaction, besides the yuan, the aussie, a popular liguid proxy for China plays, is highly expected to show an immediate response to growth figures. A larger-than-expected deterioration in Chinese economic activity could signal that Beijing may turn more careful with its Australian product purchases in the near future, sending aussie/dollar probably below the 200-period MA currently at 0.7154 and towards 0.712, the 23.6% Fibonacci of the upleg from 0.6743 to 0.7235. Steeper declines may also reach support between 0.7070 and 0.7030.
Alternatively, a beat in the data may increase speculation that the world’s number two economy is more resilient to US trade barriers than markets believe, helping the pair to improve towards the 0.7235 top. A significant break of this important obstacle could bring more buying into the market, driving the price probably up to the 0.73-0.7340 region.
Retail sales and industrial production figures for the month of December will be also published on Thursday at the same time. The former is expected to inch up by 0.1 percentage points to 8.2% y/y, while the latter is seen weaker by an equivalent percentage at 5.3% y/y.
Strong Earnings from BoA and Goldman are Driving Risk Appetite
US stocks are off to good start as Bank of American and Goldman Sachs posted strong earning reports. Bank of America delivered strong results with beats on both the top and bottom line, painting a better picture on the economy than what we saw from JP Morgan and Citigroup earlier in the week. The BoA release also noted, “we see a healthy consumer and business climate driving a solid economy.” Goldman Sachs also posted similar results to BoA. Overall risk appetite is up on the strong results from banks and airlines. The high-beta currencies have recovered some of their losses against the dollar following the strong move in equities.
The upward trend in stocks appears to be back despite the longest shutdown in US history, which now enters day 26. There are no signs for talks to resume, but it will be interesting to see if the shutdown last beyond, January 29th , the day President Trump is expected to deliver his State of the Union address. No President in history has given the address during a shutdown.
In M&A news, the board of directors of Fiserv and First Data approved a definitive merger between the two companies. The $22 billion combination shows a continuing trend in the consolidation in the payment industry. Last year, we saw Vantiv complete the acquisition of Worldpay.
Price action shows the resumption of the bullish rebound on the Dow Jones Industrial Average has price targeting the 50-day SMA, which trades at 24,352. If we see continued upside, initial resistance may come from the 24,800 level. To the downside, 23,330 remains key support.
GBP Holds The Line As May Suffers Historic Defeat
In line with expectations, Theresa May’s Brexit bill was voted down in Parliament yesterday. However, the scale of motion against her far surpassed expectations with the PM suffering a massive 432 to 202 vote defeat.
The loss is a major blow to May who has fought tooth and nail to secure a Brexit deal, even abandoning the vote just 24 hours ahead of its originally scheduled date to allow her to travel to Brussels to secure extra reassurances in a bid to persuade those who still held reservations.
Ultimately, her efforts proved not to be enough, and instead of making history for the right reasons, May’s defeat has been confirmed as the largest government defeat in UK political history.
Corbyn Launches Vote of No Confidence
Following the defeat, May challenged Jeremy Corbyn, leader of the opposition party, to submit a vote of no confidence. Following weeks of speculation and veiled threats, Corbyn accepted the PM’s challenge and launched a vote of no confidence which will be voted on in Parliament later today following a debate.
If Corbyn’s vote of no confidence is successful and the government loses support, a two-week period will commence during which time Labour and Conservative leaders will try to form a new administration backed by the House of Commons. After this time, an election will be called which could take place as quickly as five weeks later.
What Happens If Corbyn Fails?
However, if Corbyn’s motion is unsuccessful then focus will shift back onto the next course of action regarding Brexit. Despite the defeat, May can still amend the bill and present it before Parliament again.
However, unless she is able to secure the legally binding concessions from the EU regarding the Northern Irish backstop issue, which the DUP and Conservative party are demanding, May is unlikely to gain the roughly 120 votes needed to swing things in her favour.
Consequently, it seems that the only way in which May is likely to see her deal eventually passed through Parliament on a subsequent attempt is if UK MPs finally concede that May’s deal is better than leaving with no deal.
GBP Remains Resilient
Indeed, the resilience of GBP following news of the defeat suggests that the market suspects that this might be the case, or that Article 50 will end up being extended.
The absence of a sharp sell-off in GBP reflects firstly the lack of conviction behind Corbyn’s vote of no confidence and secondly the increased likelihood of Article 50 being extended. However, the EU has been resolute in its vow to keep the March 29th deadline and has said that only a significant, legitimate reason would be cause to grant an extension.
May To Pursue Cross Party Support
Speaking just after the defeat, May told Parliament that she is open to reaching out across the political divide in a bid to see her deal approved. The PM now has until Monday before she must return to Parliament to present her new plan. This new plan will be an “amendable motion,” meaning MPs can suggest elements to include as the motion is being put forward.
One such suggestion that might be put forward is that of a second referendum. Support for a second public vote has been growing sharply, and MPs might back a motion for a second referendum to be held in the event of May’s bill being voted down again.
Technical Perspective
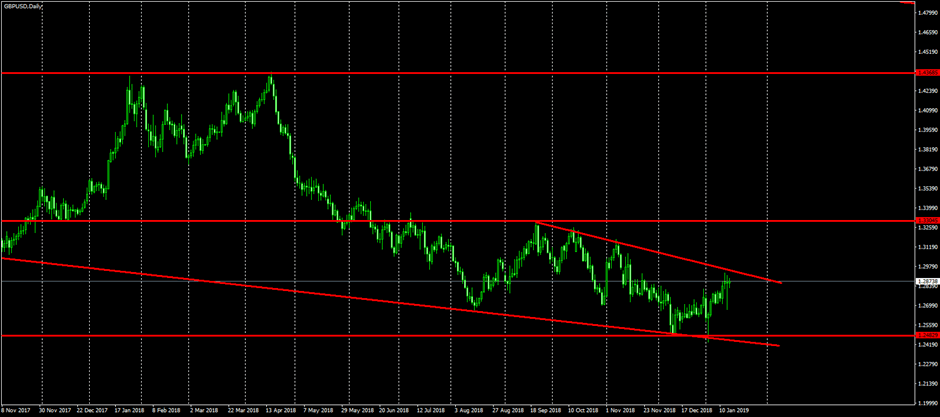
The loss of momentum in GBPUSD is visible in the choppy overlapping price action of this recent corrective rally. Price is now sitting just below channel resistance which, while intact, keeps focus on an eventual break lower. Above the channel high, however, and the 1.3304 top will be brought into focus. To the downside, the 1.2482 level remains the key support to watch.
WTI Oil Outlook: Extended Triangular Consolidation Looks for Fresh Direction Signal
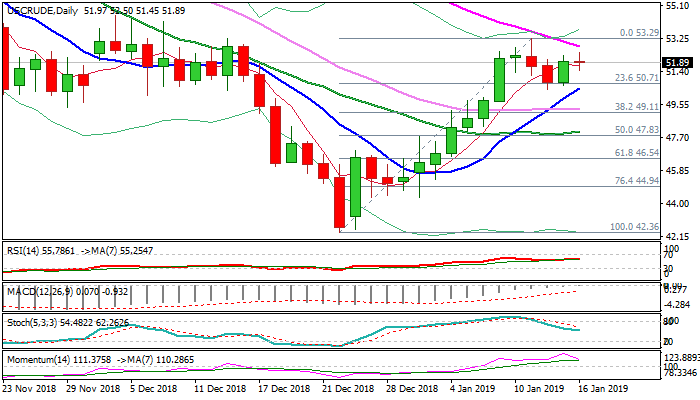
WTI oil stands at the back foot in early US trading on Wednesday, after recovery attempts in Asian session which peaked at $52.50, were short-lived. Tuesday's bullish outside day pattern provided little support to oil price which stays congested within triangular consolidation for the third straight day. Converging 10SMA (currently at $50.45) and 55SMA (currently at $52.80) mark pivotal points with break of either side to provide fresh direction signal after recovery leg from $42.36 low stalled on approach to falling 55SMA. Strong pressure also comes from falling thick daily cloud (cloud base lays at $54.37) and south-heading momentum and slow stochastic. Sideways-moving RSI / MACD and mixed setup of daily MA's offsets immediate negative signals, keeping near-term action in neutral mode, helped by symbolic draw of US crude stocks (API report on Tuesday showed 0.5 mln bls draw vs previous week's 6.2 mln bls draw. Focus turns on today's release on today's EIA report (1.3 mln bls draw f/c vs 1.6 mln bls draw previous week) which could provide fresh signals on surprise. Key fundamentals are also mixed as EIA announced increase of US oil output in 2019/20 while rising optimism on solution of US/China trade dispute and fresh measures of PBOC to stimulate economy provide positive signals. Negative scenario on break below 10SMA/current congestion low, would open way towards $49.11 (Fibo 38.2% of $42.36/$53.29 / 30SMA) and key support at $48.06 (20SMA / near 50% retracement of $42.36/$53.29). Sustained break above 55SMA and violation of daily cloud would neutralize bearish threats and signal further recovery.
Res: 52.80; 53.29; 54.37; 55.55
Sup: 51.45; 50.71; 50.45; 49.11
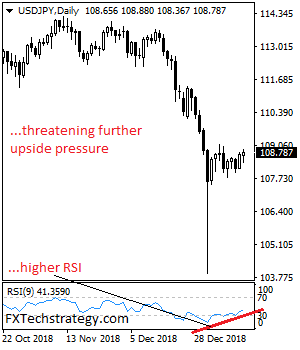
USD/JPY Remains Biased To The Upside On Corrective Recovery
USDJPY remains biased to upside on corrective the holds on to its recovery as we expect more strength. On the upside, resistance comes in at 109.00 level. Above here will turn attention to the 109.50 level. Further out, we expect a possible move towards the 110.00 level if the earlier resistance is taken out. A break of here will open the door for more gain towards the 110.50. Its daily RSI is bearish and pointing higher suggesting further weakness. On the downside, support comes in at the 108.00 level where a break will target the 107.50 level. Below that level will turn focus to the 107.00 level and then lower towards the 106.50 level. On the whole, USDJPY faces further upside on corrective recovery.