Sample Category Title
DAX – Bank Shares Jump after Brexit Vote
The DAX index posted gains in Wednesday’s Asian session, only to lose these gains in European trade. Currently, the index is at 10,892, up 0.01% since the Tuesday close. On the release front, German Final CPI came in at 0.1% for a second successive month. On Thursday, the eurozone releases Final CPI.
European bank shares have strengthened on Wednesday, after the Brexit vote in the U.K. parliament. Lawmakers turned down the deal by over 200 votes, and the market reaction was that the resounding vote will reduce the likelihood of a no-deal scenario. Deutsche Bank has jumped over 3% on Wednesday and bank listed on the STOXX 600 have also recorded gains.
With the eurozone struggling, there are plenty of headaches for ECB policymakers, and Mario Draghi shared some of his concerns on Tuesday at a plenary session on the ECB annual report. Draghi highlighted Brexit and the U.S-China trade war as significant concerns and noted that eurozone economic conditions have been weaker than expected, adding that the eurozone was undergoing a slowdown but was not heading into recession. The ECB holds its next policy meeting on January 24, with no change in monetary policy expected.
The DAX hasn’t recorded a winning month since July, but that negative trend could change in January. The DAX has rallied in January, with gains of 3.9%. This is a far cry from the December meltdown of 8.4 percent, as equity markets try to shake off an awful 2018. Still, there are dark clouds on the horizon. The eurozone economy has slowed down, and weaker economic activity in China could spook investors. On Monday, China released dismal economic numbers, with exports down 4.4 percent from a year earlier and imports plunging 7.6 percent. The slowdown in China has taken a toll on corporate profits and continues to be a major concern for investors and policymakers.
Into US session: Sterling strongest as May’s no-confidence vote awaited, Dollar and Canadian Follow
Entering into US session, the markets are relatively steady. Eyes are on no-confidence vote on UK Prime Minister Theresa May, and debate is going on in the parliament. Sterling is somewhat trading firm as chance of a delay in Brexit or even no Brexit increased after yesterday's meaningful vote. We'd laid out several scenarios here. But we'll have to see if May is still the Prime Minister tomorrow first.
Staying in the currency markets, Canadian and US Dollar are also firm today. The former is helped by recovery in oil price. WTI crude oil is back 51.85. Dollar continues to ignore record government shutdown in the US. At this point, New Zealand and Australian Dollar are the weakest ones. But Euro and Swiss Franc are not performing much better.
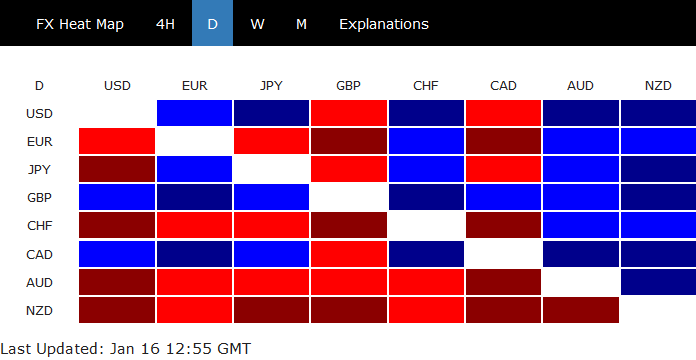
In other markets, major European indices are mixed:
- FTSE is down -0.45%
- DAX is up 0.01%
- CAC is up 0.20%
- German 10 year yield is up 0.022 at 0.2323
Earlier in Asia
- Nikkei dropped -0.55%
- Hong Kong HSI rose 0.27%
- China Shanghai SSE was flat
- Singapore Strait Times rose 0.52%
- Japan 10 year JGB yield dropped -0.0078 to 0.007
ECB Nowotny: Brexit uncertainty is a psychological problem for banks, not technical
ECB Governing Council member Ewald Nowotny warned that "nothing is as damaging as this long, prolonged uncertainty," regarding Brexit. However, he added that "from the point of view of the banking side perhaps it's not so much a technical problem because I think here we are pretty well prepared for whatever outcome there might be".
Nowotny said "it could be a psychological problem ... So if that is something that could create some kind of self-fulfilling negative perspectives, that is something that might be really dangerous."
EUR/GBP Outlook: Bears Look for Daily Close Below Key 200SMA/Fibo Supports to Resume
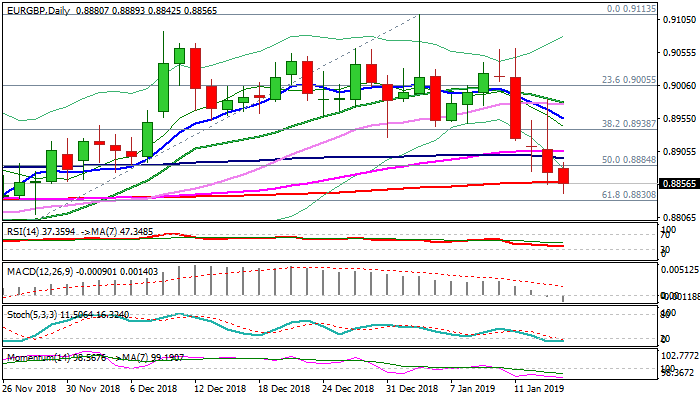
The cross extends lower and probes below key supports at 0.8871/60 (daily cloud base / 200SMA on Wednesday. Bearish candle with long upper shadow which was left after strong upside rejection and subsequent fall on Tuesday weighs, keeping near-term bias with bears. The single currency maintains negative near-term sentiment, with bearish setup of daily studies adding to bearish outlook, while pound resisted negative impact from Brexit plan vote down and recovered losses. Close below 200SMA (0.8860) and Fibo 61.8% of 0.8656/0.9113 (0.8830) would generate strong bearish signal for further downside. Broken 100/55SMA's (0.8895/0.8905) should ideally cap and keep bears intact.
Res: 0.8895; 0.8905; 0.8938; 0.8955
Sup: 0.8830; 0.8810; 0.8764; 0.8696
China Notes: Weak Car Sales Should Be Taken With A Grain Of Salt
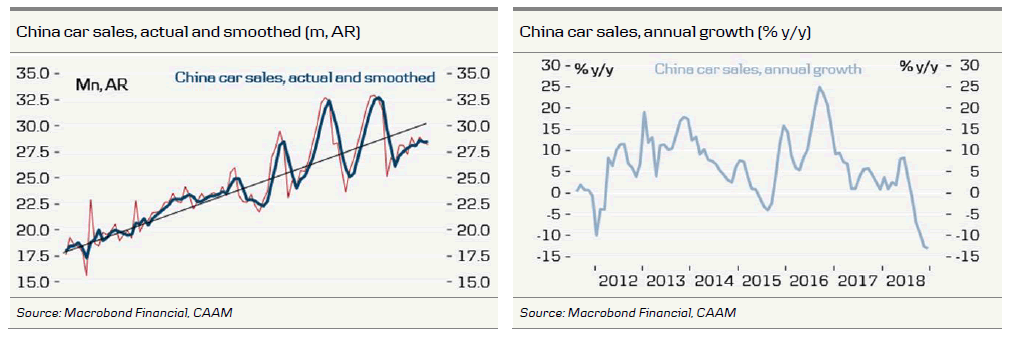
With all the talk about weak car sales in China, we highlight the charts below. It is true that car sales are down a lot when measured on an annual basis. The year-on-year rate is above -10%. However, this is largely due to the ‘base effects’ of the run-up in car sales at the end of 2017, as a tax cut on smaller engine cars was rolled back at the turn of the year. Hence, the year-on-year comparison for December 2018 is against an elevated level in 2017. After coming down sharply at the turn of the year, the level of car sales (seasonally adjusted) has actually increased gradually, although it is still below the medium-term trend line.
What do we expect to happen in coming months? We believe are likely to see a big increase in the year-on-year rate for two reasons. First, the fall in car sales in January and February 2018 gives a much lower base to compare with. Hence, even if car sales are unchanged on a monthly basis in coming months at around 28 million cars (annualised), the year-on-year rate would rise to above 10%. Second, the Chinese leadership has flagged that stimulus aimed at auto sales and home appliances is coming. This could very well give a lift to the level of car sales.
The bottom line is that after being a big drag on annual consumption growth at the end of 2018, car sales are set to give a boost to consumption growth in Q1 when measured in year-on-year terms
Earnings Season And UK Vote In Focus
US investors eye earnings season
Most European markets are trading slightly in the green early in the session on Wednesday, with the FTSE being the main exception after the pound rebounded late Tuesday, weighing on the index.
The US is also expected to open a little higher today as indices try to force their way through an important psychological resistance level, one that provided a floor for the indices for most of the second half of last year before being broken the week before Christmas. They stumbled at the first time of asking last week but we saw another run at it yesterday and could see more of the same today.
Attention may be primarily on Brexit in Europe but over in the US, earnings season is upon us and investors will be eyeing results for signs of weakness at a time when the global economy is expected to slow, fiscal stimulus is fading and some major companies – including Apple – are reporting difficulties. The trade war with China may not have massively taken its toll yet but it may start to show itself in the upcoming results and/or guidance.
Brexit soap opera continues with no confidence vote this evening
In the UK, things are getting very feisty but we're no closer to a deal than we were before Christmas. Yes, we've ticked another box – rejection of May's deal – but this won't be the last and there are other boxes still to be ticked. Today's vote of no confidence is also widely expected to fail but again, it's unlikely to be the last. It may feel like we're going around in circles and, in many ways, we probably are but this is the only way that parliament will eventually agree on a course of action, be it a deal or second referendum.
What this means is the pound is likely to remain very volatile over the coming weeks, the flow charts will be continually updated to reflect the new reality and slowly but surely, the number of options available to parliament will dwindle. Only then will we reach a point when a vote in parliament will in fact be meaningful. But this may take longer than the 10 weeks or so until Brexit day and there may be a few more surprises along the way.
Gold and oil flat as profit taking pauses rallies
We're seeing some consolidation in commodity markets today, with gold trading relatively flat on the day, once again mirroring the moves we're seeing in the US dollar. The yellow metal has consolidated over the last couple of weeks since closing in on $1,300, after which we saw some profit taking. It's not picked up any downside momentum in that time though which could be a bullish signal. Another run higher would see $1,300 come under significant pressure which I'm not convinced it could sustain.
Oil on the other hand has rebounded strongly since the start of the year – up more than 20% since Christmas – but has been consolidating over the last week as profit taking has kicked in. WTI and Brent have found resistance around $55 and $65, respectively, a level which if broken could be the catalyst for another strong push higher. I think the moves heading into Christmas were overdone and largely driven by a decline in risk appetite on overblown growth fears. With OPEC+ committed to production cuts, the path of less resistance currently looks to the upside.
GBP/JPY Reached The Extreme Area Lower And Bounced
Hello fellow traders. In this technical blog we're going to take a quick look at the Elliott Wave charts of GBPJPY, published in members area of the website. As our members know, the pair had incomplete bearish sequence in the cycle from the January 28th peak. The Elliott wave structure had been calling for further weakness. Consequently, we advised members to avoid buying the pair and keep on favouring the short side, selling the rallies in the sequences of 3,7,or 11 swings whenever opportunity presented itself. In further text we're going to explain how we called the pair lower and look at the Elliott wave structure.
GBPJPY Daily Elliott Wave Analysis 12.29.2018
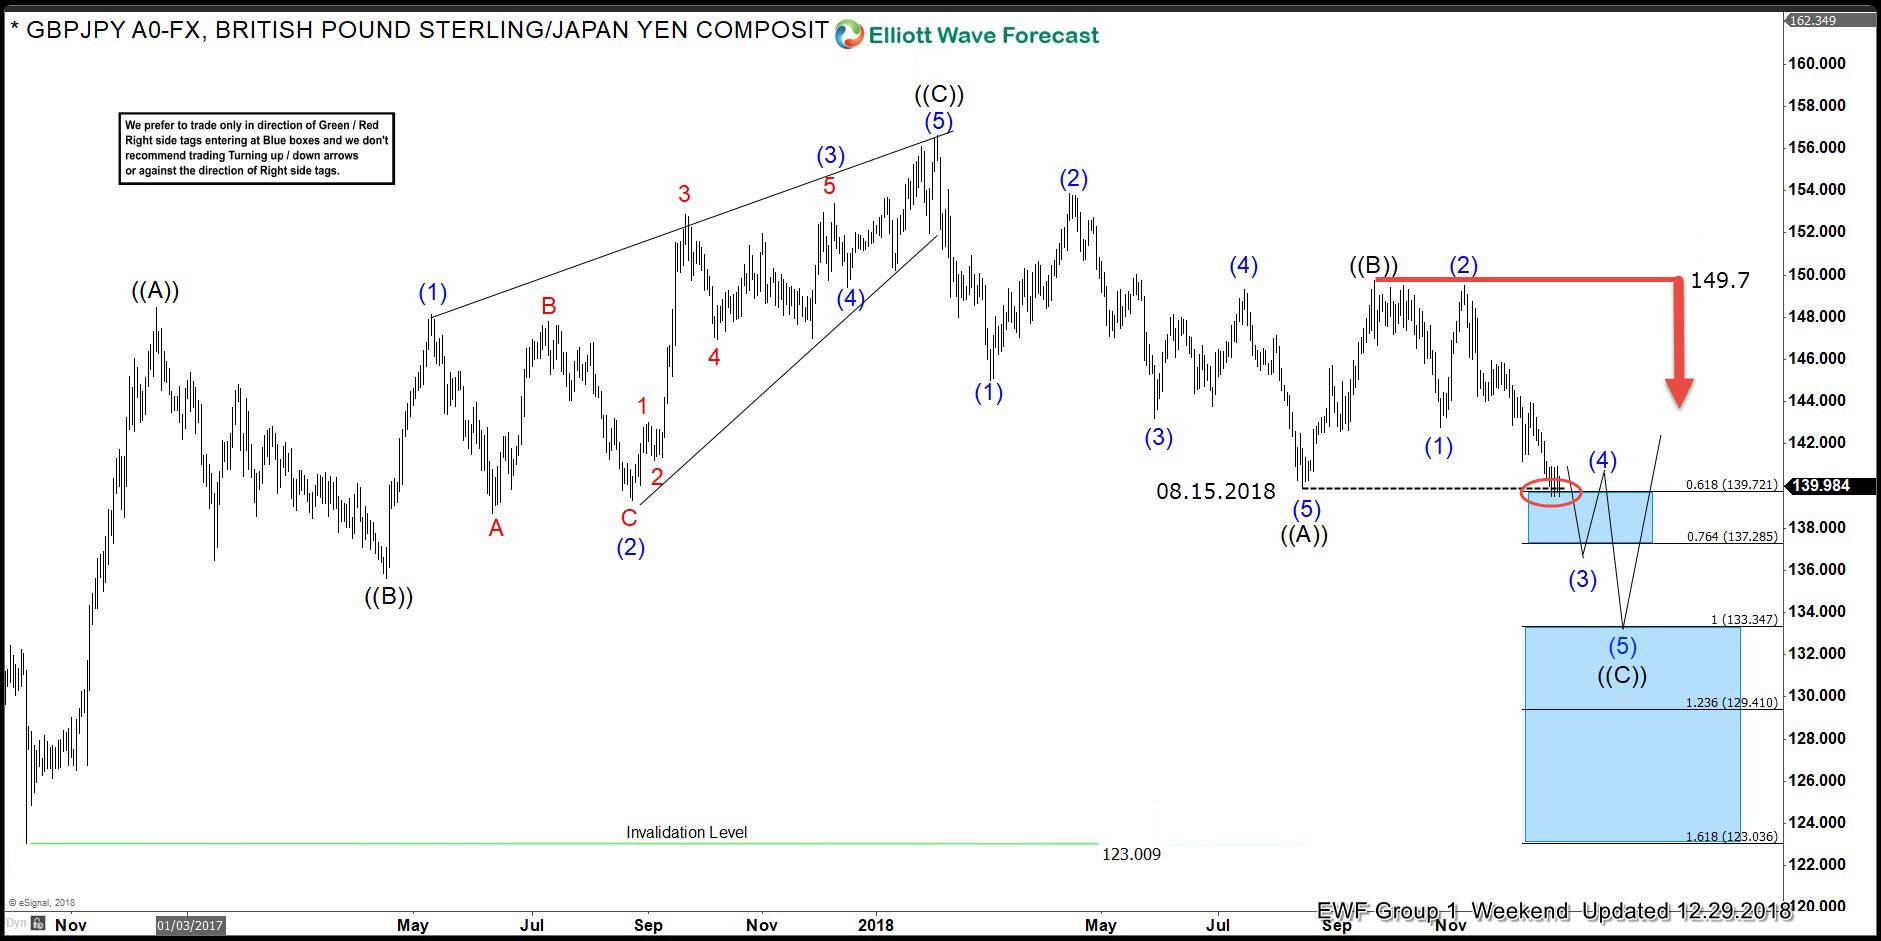
Break of August 15th low made the cycle from the January peak incomplete to the downside. The pair is now bearish against the 149.7 peak and we're calling for further decline. As we can see on the chart below , the pair is seating at the 0.618 Fibonacci extension , making sideways consolidation. The pair has scope to reach 133.34-129.41 area before buyers apear again for 3 wave bounce at least. We don't recommend buying it against the main bearish trend and favour the short side as far as 149.7 pivot holds.
Now, let's see what short term structure looked like back then.
GBPJPY 1 Hour Elliott Wave Analysis 12.31.2018
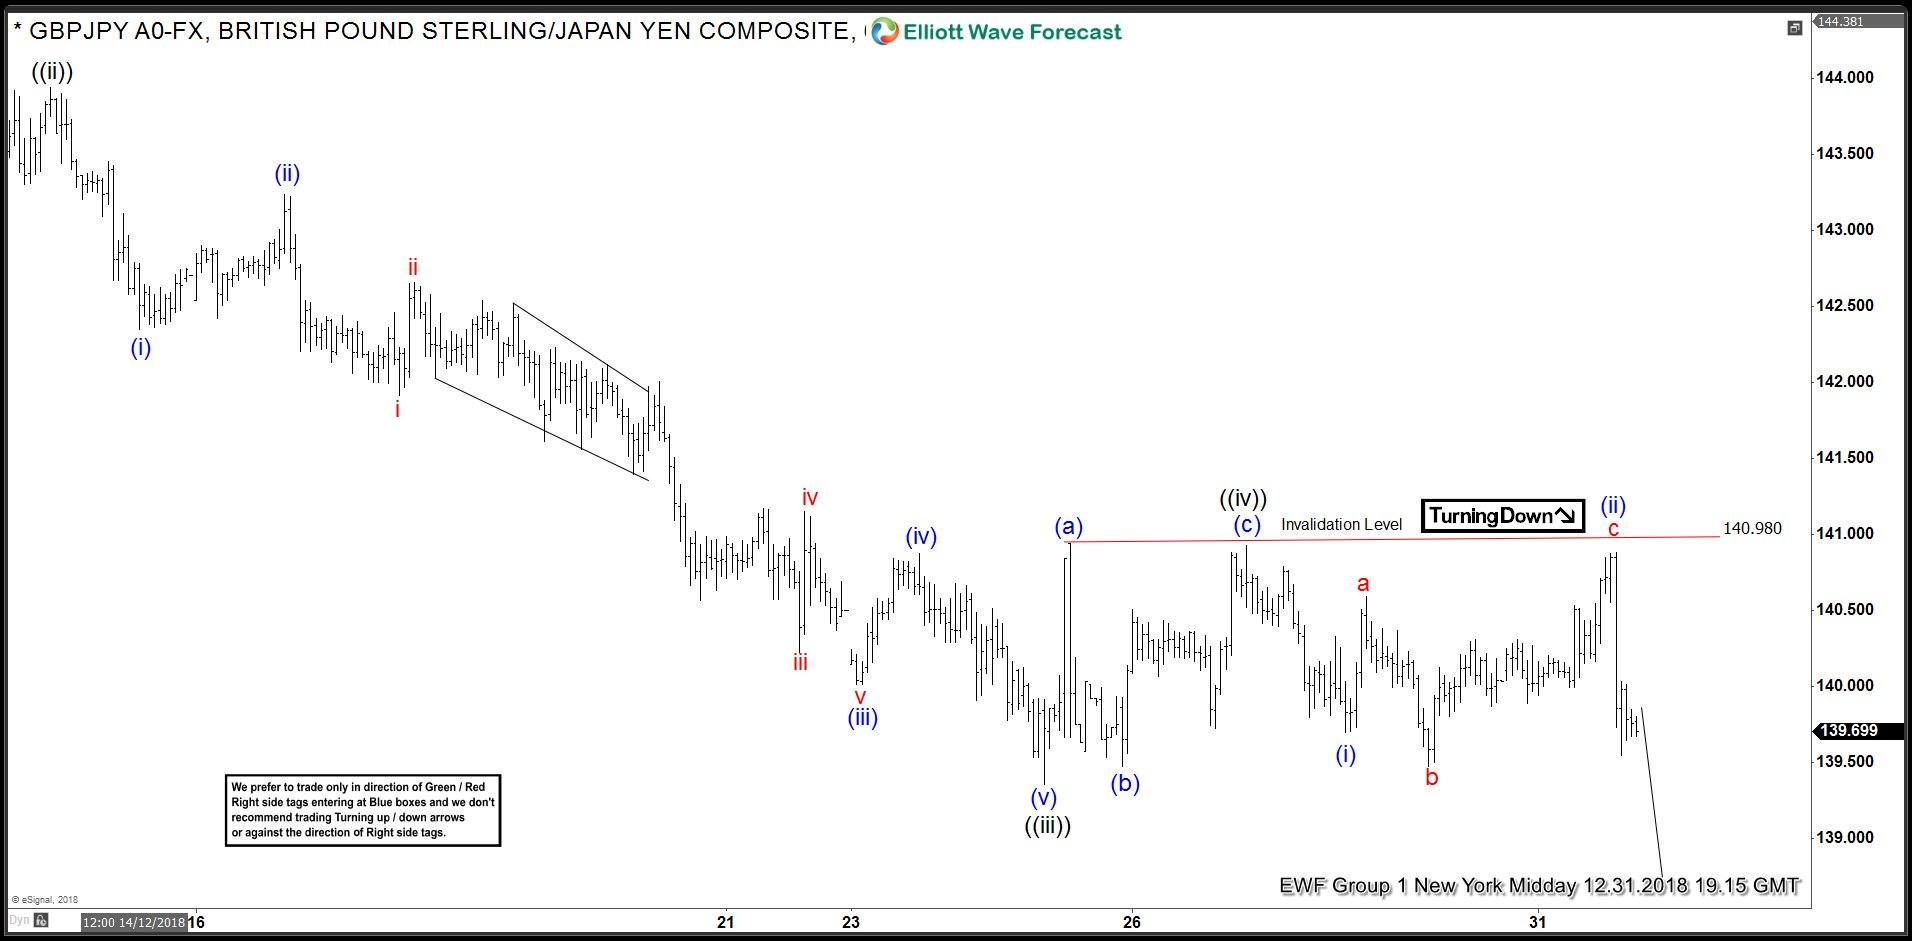
Decline looks impulsive and we are calling short term recovery completed at 140.98 high as wave ((iv)). Now, as far as the price stays below mentioned level we expect the pair to trade lower, however need to see new short term low ( break below wave ((iii)) low) in order to confirm wave ((v)) is in progress. We don't recommend buying the pair, and favor the short side. We like selling the rallies in 3,7,11 swings when get chance.
Elliott Wave Analysis: Further Strength Expected In Oil
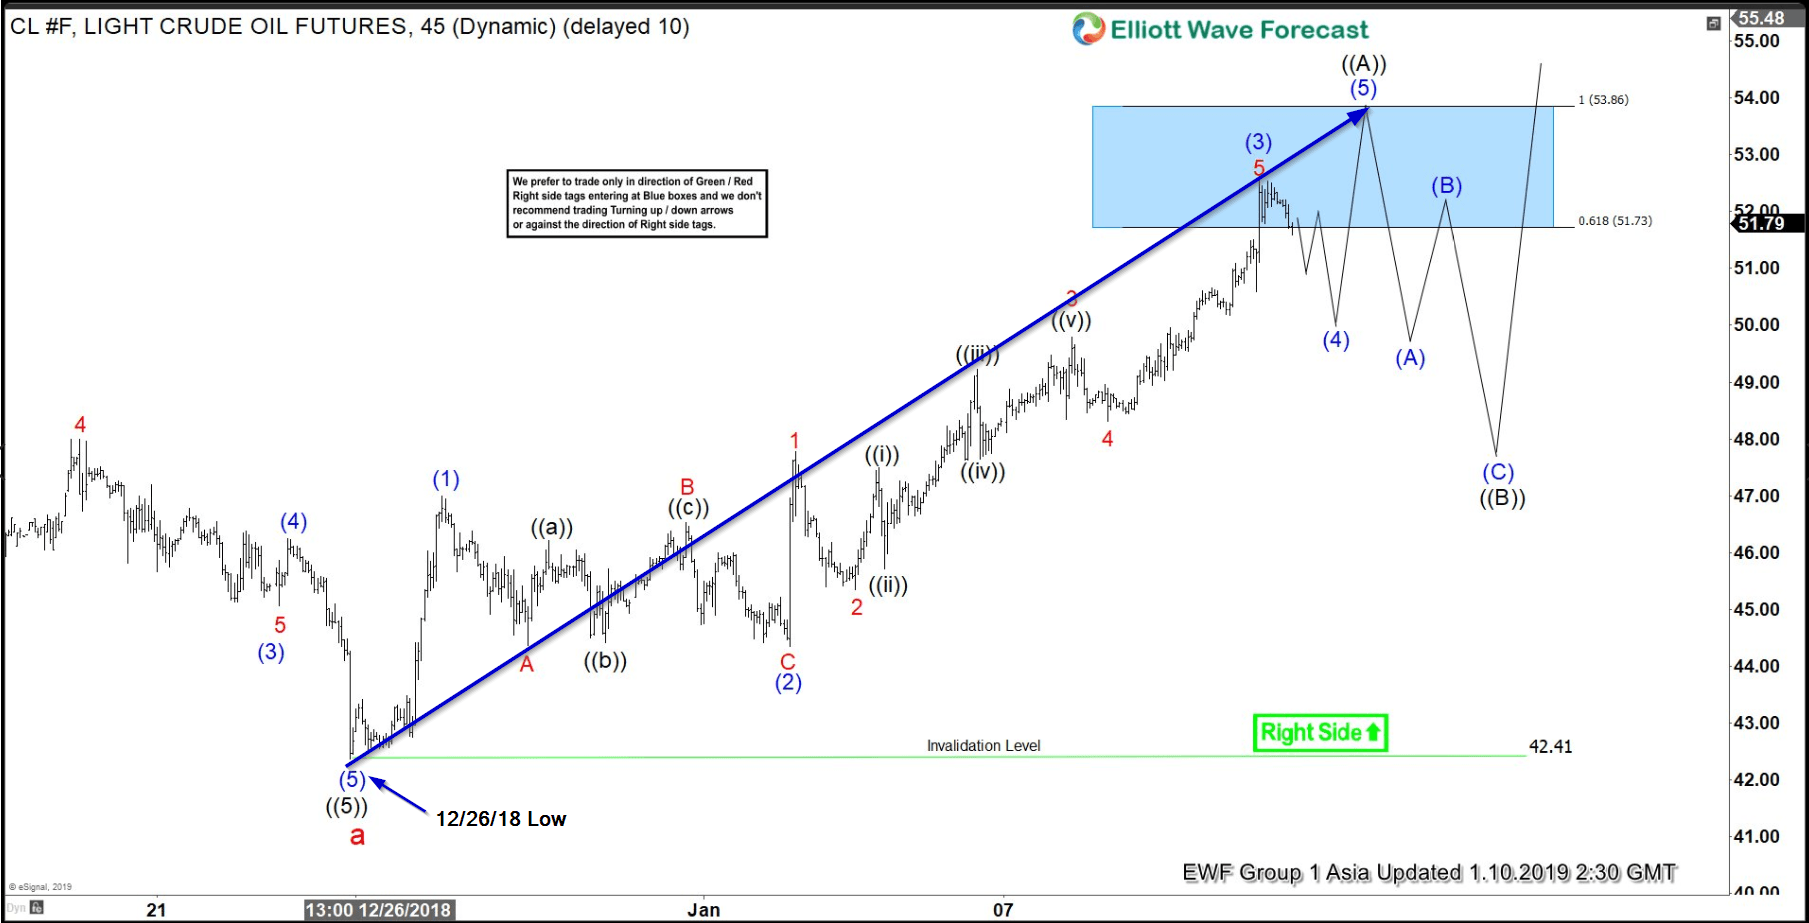
In this blog, I want to share with you some Elliott Wave charts of Oil which we presented to our members at Elliott Wave Forecast. You see the 1-hour updated chart presented to our clients on the 01/10/19.
Oil ended the cycle from 10/03/18 peak in red wave a at 12/26/18 low (42.41). Above from there, we expect a bigger bounce to occur in 3-7 or 11 swings. From 12/26/18 low (42.41) the commodity unfolded as a 5 waves Elliott Wave impulse structure.
From 42.41 low it ended blue wave (1) at 47.05 peak. Below from there, blue wave (2) pullback ended at around 44.35 low. Above from there, Oil futures rallied quite aggressively to the upside in blue wave (3) and ended that move higher at 52.61 peak. The internals of blue wave (3) also unfolded as a 5 waves impulse structure. After ending blue wave (3) we expected a pullback to occur in wave (4) followed by the last push higher into the 53.86 blue box area to end wave (5) of black wave ((A)). Afterwards, we expected a pullback in the sequences of 3-7 or 11 swings to correct the cycle from 12/26/18 low.
Oil Futures 01.10.2019 1 Hour Chart Elliott Wave Analysis
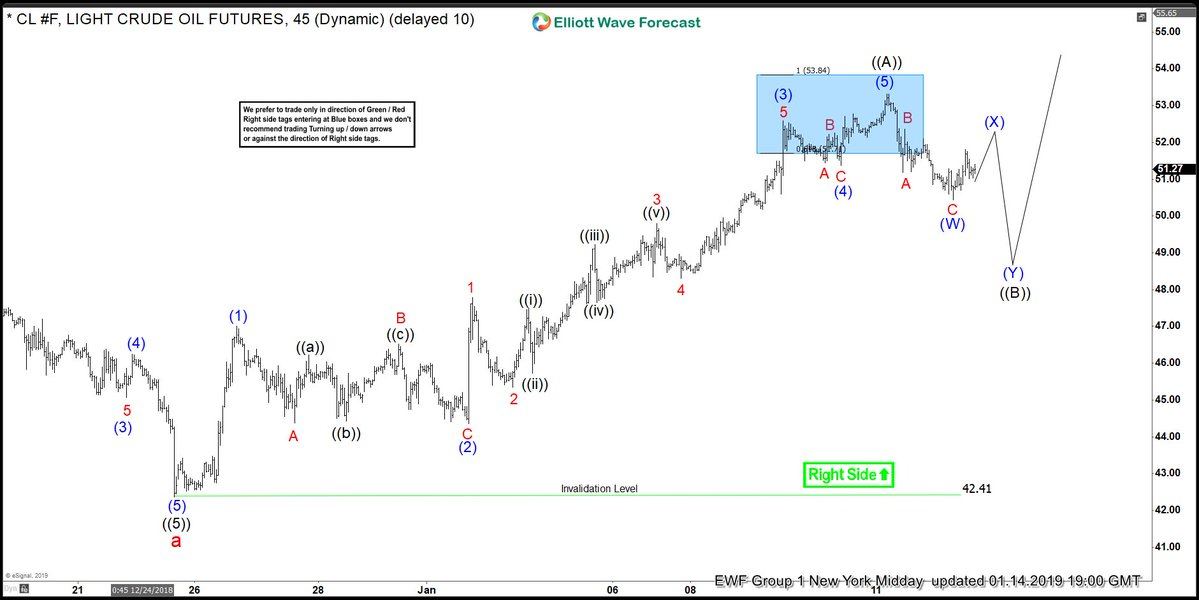
In the Elliott Wave chart update below, you can see that blue wave (4) pullback ended at around 51.36 low. Above from there, it made the expected push higher in blue wave (5) to around 53.38. This move also completed the 5th wave of black wave ((A)). Below from that blue box oil is in the process of correcting the cycle from 12/26/18 low in black wave ((B)) in 7 or 11 swings before more upside should be seen ideally. As long as the pivot at 42.41 stays intact, we expect the commodity to extend higher to continue to correct the cycle from 10/01/18 peak. Please keep in mind that the 1-hour charts which I presented can have changed already. This blog should just illustrate how accurate our blue boxes are, and how our members can make use of our 3-7 or 11 swings strategy.
If you are interested in how to trade our blue box areas and want to understand how Elliott Wave works. Then I recommend you to get a shot on our special promotion which we are currently running below.
Oil Futures 01.14.2019 1 Hour Chart Elliott Wave Analysis
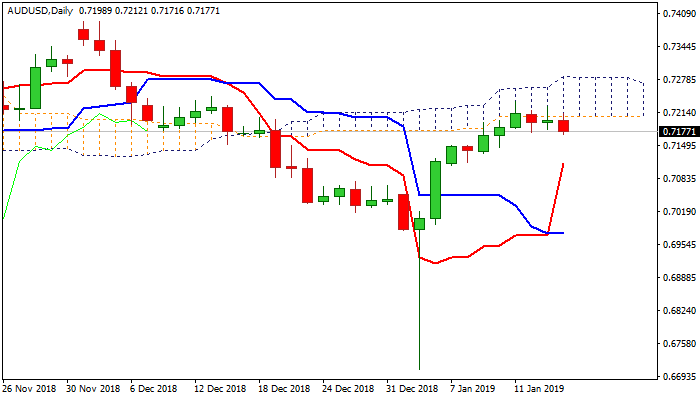
AUD/USD Outlook: Risk Of Pullback Increases After Repeated Failures At Daily Cloud Base
The Australian dollar probes through 55/100SMA support zone (0.7196/76) on fresh weakness triggered by stronger greenback. Multiple rejections at daily cloud base (0.7207) in past few sessions signaled that recovery rally from 3 Jan spike low at 0.6706 is running out of steam. The notion is supported by south-turned RSI and momentum, as slow stochastic is heading lower after reversal from overbought territory. Close below 100SMA would generate initial bearish signal for extension towards 10SMA (0.7154), but stronger reversal signal could be expected on extension and close below 0.7110 (20SMA/Fibo 23.6% of 0.6706/0.7235 rally). Thick daily cloud (0.7207/0.7282) marks strong obstacle and sustained break above cloud would provide stronger bullish signal for extension towards falling 200SMA (0.7327).
Res: 0.7212, 0.7235, 0.7282, 0.7327
Sup: 0.7154, 0.7110, 0.7033, 0.7000
USD/JPY W Bullish Pattern Turns The Trend To The Upside
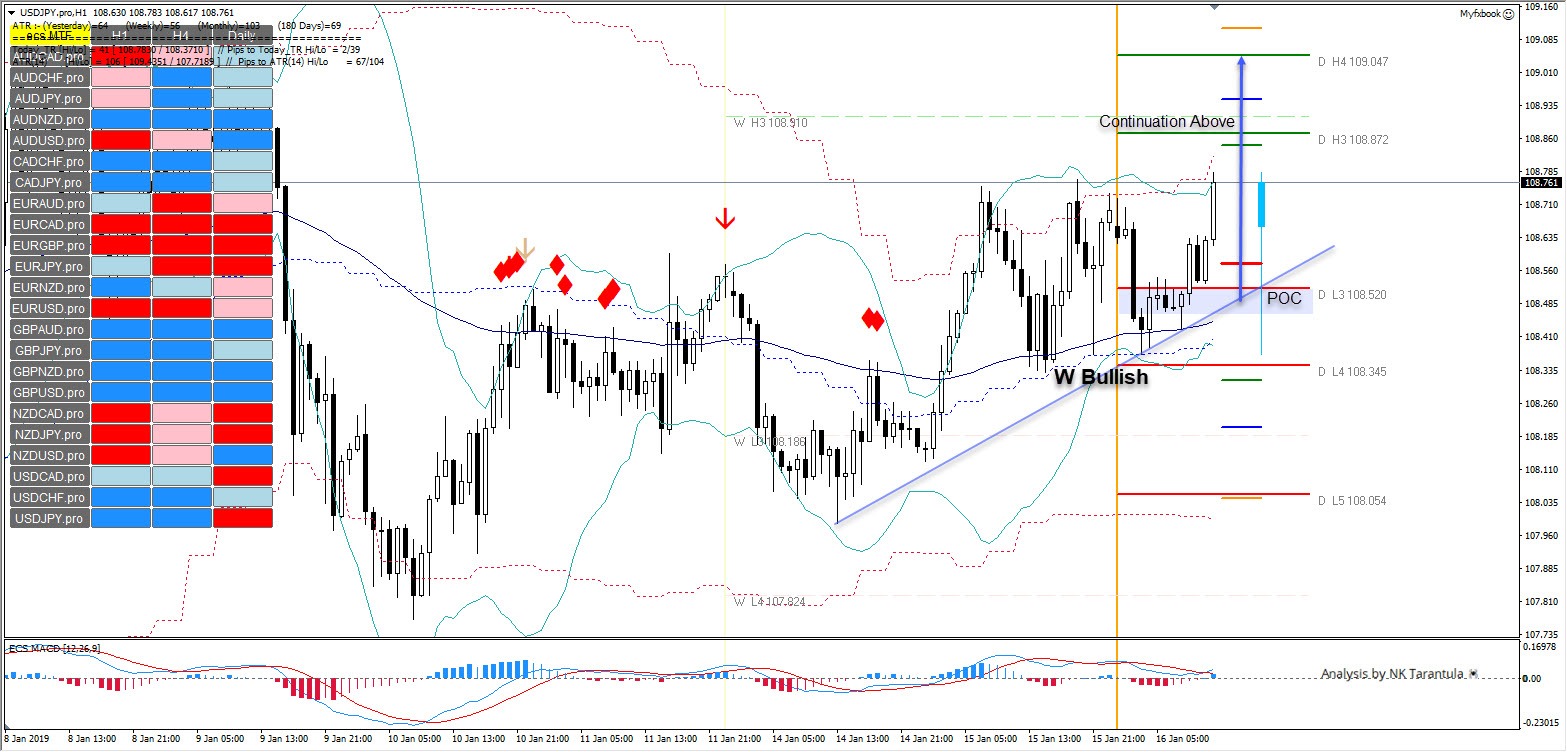
The USD/JPY has made a spike above the ascending trend line in the shape of W 1 2 3 bullish pattern.
The POC zone 108.40-55 could spike the price towards 108.91. H4 technical tools also point to the upside, as the USD/JPY aka Ninja turned bullish after a rejection from 108.34. The Emerging W bullish pattern points to continuation above 108.91 towards 109.05 with a final ATR projection at 109.43.
However, If the price goes below 108.34, it will make bears dominate again. Watch for rejection and or continuation.