Sample Category Title
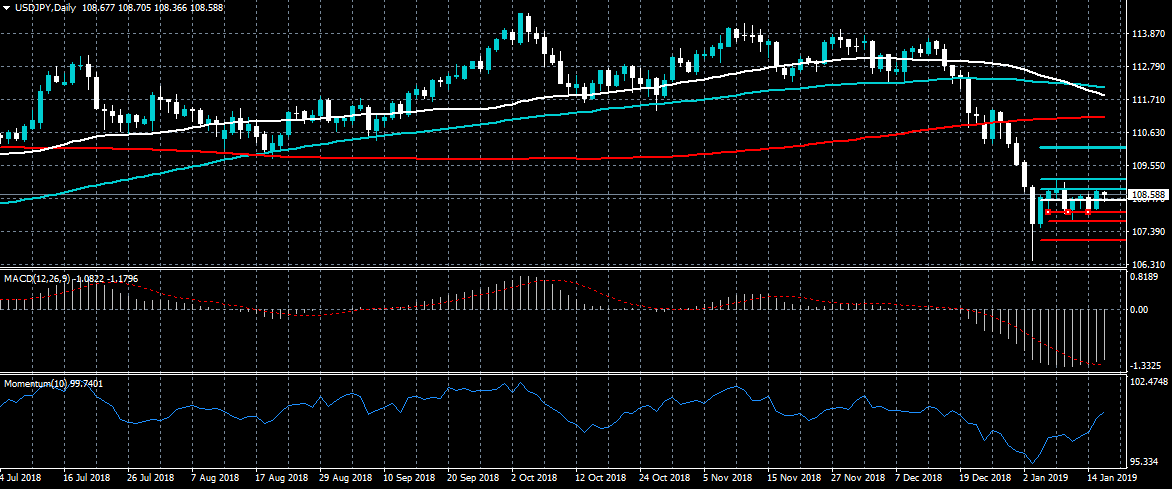
USD/CAD Set For Breakout
The US Dollar is trading in a triangle-like formation pattern against the Canadian Dollar. The currency pair tested the lower boundary of the triangle pattern during the middle of the European trading session on Wednesday.
The exchange rate is currently trading near the upper boundary of the pattern and could be set for a breakout.
If this breakout occurs, the currency exchange rate is likely to aim at the 200-hour simple moving average at 1.3283.
However, of the pair could reverse from current price level and break a junior ascending channel today.
NZD/USD Breaches Channel Pattern
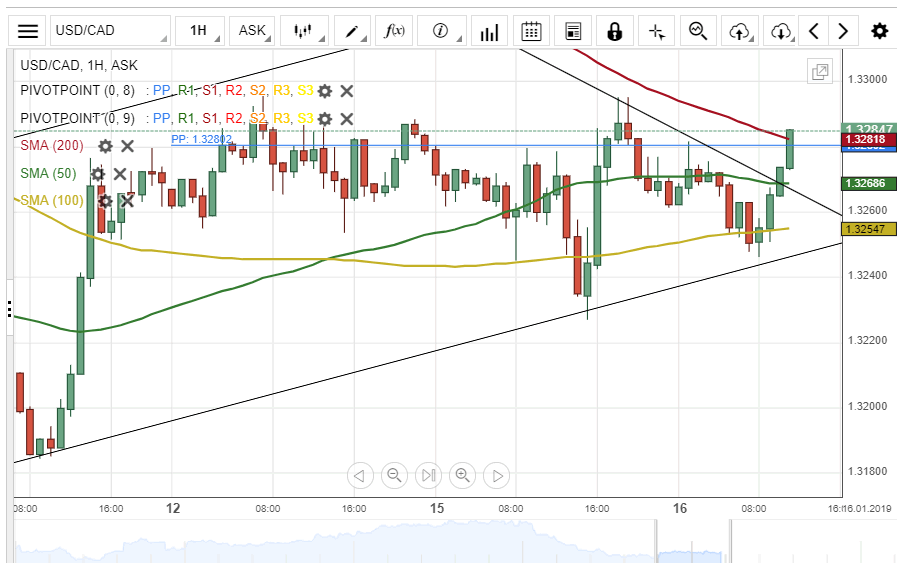
The New Zealand Dollar has been depreciating against the US Dollar since Tuesday's trading session. The currency pair has lost about 0.90% of its values.
A breakout through the lower boundary of an ascending channel pattern occurred during the middle of Wednesday's trading session. Also, the currency pair breached a strong support level at 0.6795.
Most likely, the 200-hour simple moving average at 0.6780 could hinder the bearish momentum within this session.
However, if the currency exchange rate passes the 200-hour SMA, the pair will target a support level at 0.6750
XAU/USD Analysis: Trades Between SMAs
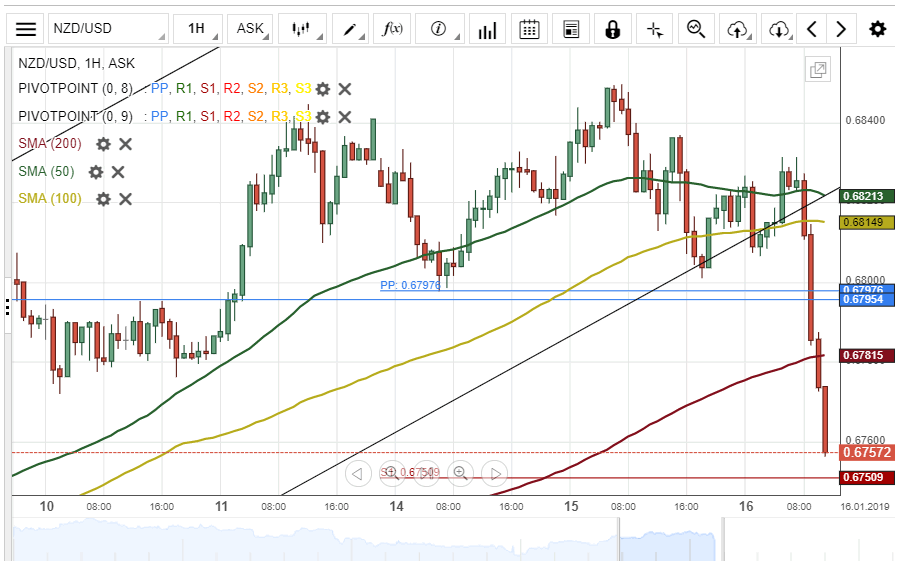
During the previous trading day, the yellow metal traded sideways to stay at the 1,288.00 level. On Wednesday morning, the gold was trading between the simple moving averages at 1,290.37.
In regards to the near-term future, most likely, the yellow metal will break the resistance levels of the 55-hours and the 100-hours SMAs to trade at 1,292.00. Besides, the 200-hour simple moving average will support the surge!
On the other hand, the gold could depreciate against the US Dollar during today's US Crude Oil Inventories data release at 15:30 GMT to push the rate to trade at 1,286.00.
USD/JPY Analysis: Will Break Corrected Pattern
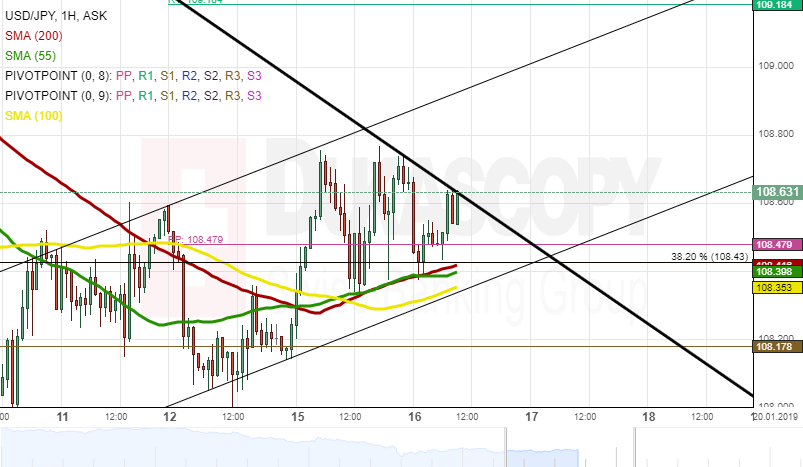
During the previous trading session, the currency exchange rate broke the previously drawn descending medium pattern line at 108.64. On Wednesday, the rate was trading at the 108.56 mark.
In regards to the near-term future, it is expected that the rate will break the resistance of the corrected medium pattern line to surge towards the 109.00 level. Moreover, the simple moving averages will support the surge during the day.
On the other hand, the US Dollar could be resisted by the medium pattern line to pass most of the technical indicators to trade at the 108.200 level.
Bears Taking Over EUR/USD
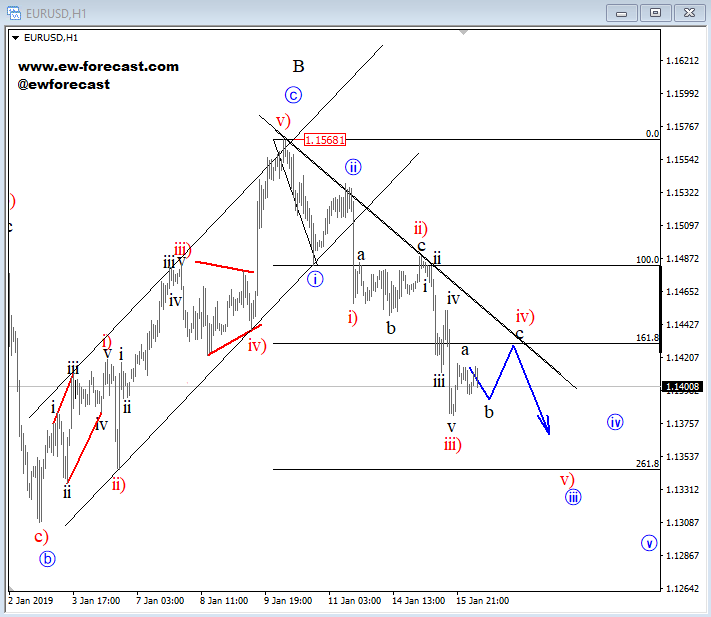
We have seen a nice bearish acceleration yesterday on EURUSD, so seems like we are in an impulsive five-wave decline. Currently it has just slowed down in wave iv) that can be either a flat or a triangle pattern and once it fully completes, we should see a continuation lower! That said, be aware of more weakness, while it's trading below that black trend-line and 1.1455 level.
EURUSD, 1h
GBP/USD Analysis: Experiences High Volatility
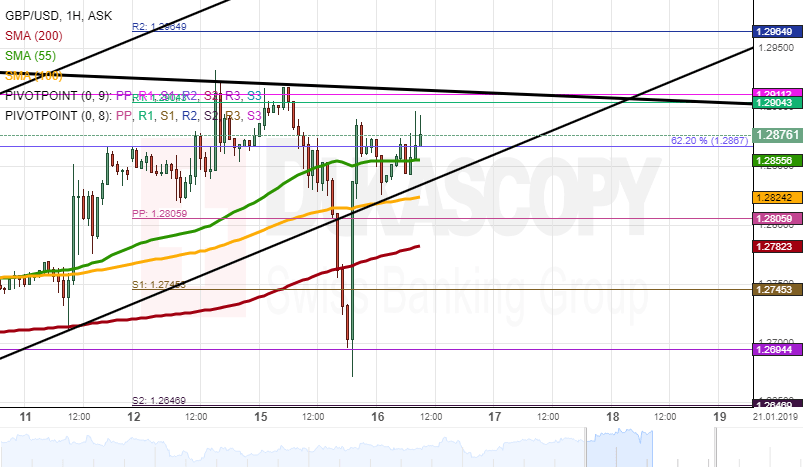
During Tuesday's trading session, the UK Parliament voted to reject the passage of the deal. The vote results caused high volatility of 220 pips or 1.73% to push the rate to the 1.2670 mark. On Wednesday morning, the currency exchange rate was trading at the previously drawn pattern at 1.2867.
In regards to the near-term future, most likely, the British Pound will continue to surge towards the upper boundary of the descending dominant pattern line at 1.2911.
However, the British Pound could be depreciated against the US Dollar during today's UK CPI data release at 9:30 which might push the rate to the 1.2805 mark
EUR/USD Analysis: Falls To Weekly S1 At 1.1390
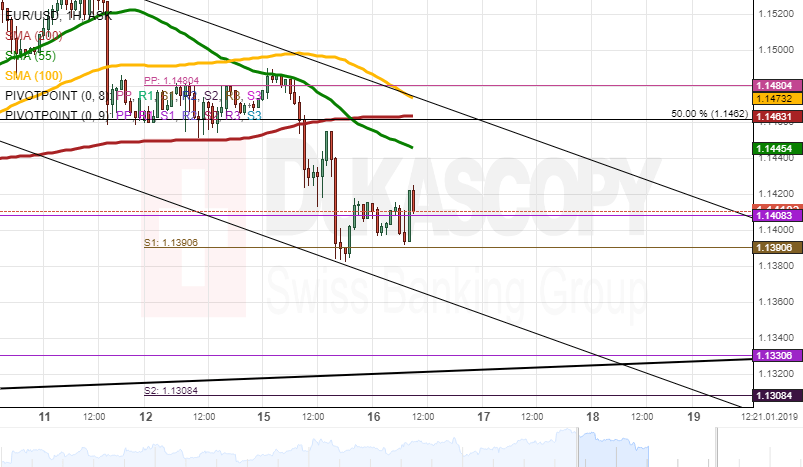
On Wednesday, the currency exchange rate was trading above the monthly pivot point at 1.1443. Besides, the weekly S1 at 1.1390 supported the European Single Currency during the morning hours!
It is expected that the rate will continue depreciating during the trading session due to the resistance levels of the monthly PP and the weekly S1. Most likely, the rate will fall to the 1.3600 level.
On the other side, today's US Crude Oil Inventories data release at 15:30 GMT could push the rate to surge to the 1.1440 level.
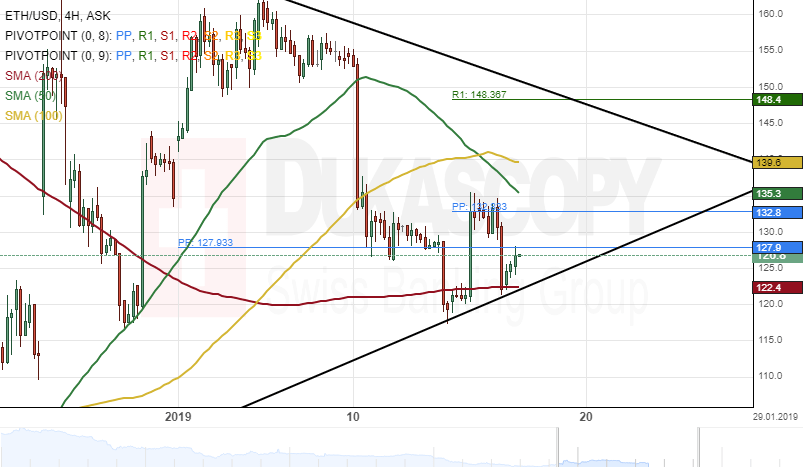
ETH/USD 4H Chart: Remains Near 200-Hour SMA
The Ethereum cryptocurrency has been depreciating against the US Dollar since January 10. The pair has lost about 24.12% of its values during the last week.
The ETH/USD pair tested the 200-hour simple moving average at 122.4 during the morning hours of Wednesday's trading session.
If this support level formed by the 200-hour SMA holds, the blockchain will likely aim for the weekly R1 at 148.36 during the following trading session.
On the other hand, if the pair passes the SMA, the next target for bearish traders will be at the weekly S1 at 103.76.
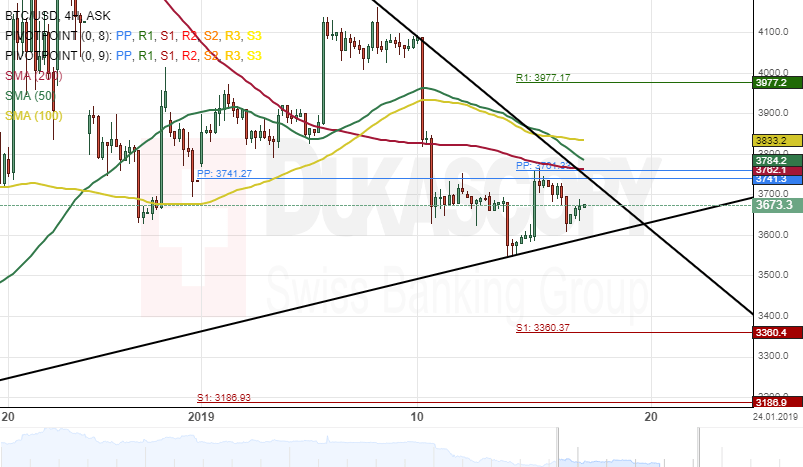
BTC/USD 4H Chart: Tests Resistance Cluster At 3764.5
The Bitcoin cryptocurrency has declined about 13.04% against the US Dollar since last week Thursday. The pair began depreciating after hitting the $4100 mark on January 10.
The BTC/USD pair tested a resistance cluster formed by the combination of the weekly and the monthly PPs at 3792.0 during the previous trading session.
Most likely, it is expected that the blockchain continues its decline during the following trading sessions, and potentially targeting a support level at 3360.3.
However, a support line formed by the lower boundary of an ascending trendline at 3600.0 could provide support for the pair today.
USDJPY Bullish Momentum Growing
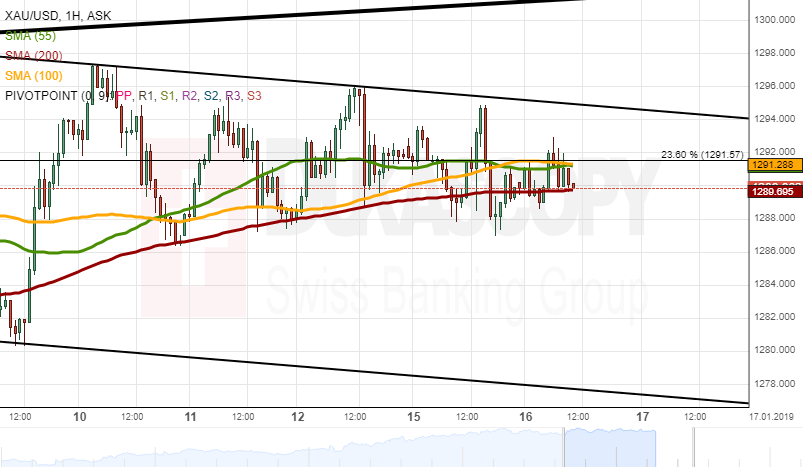
The US dollar is building bullish momentum against the Japanese currency on Wednesday, as the recent short-term recovery gains traction. The MACD and Momentum indicators on the daily time frame are starting trend higher, pointing to further intraday gains in the USDJPY pair. A clear break above the 109.08 resistance level may provoke further technical buying towards at least the 110.00 level.
The USDJPY pair remains bullish while trading above the 108.40 level, key technical resistance is found at the 109.08 and 110.00 levels.
If the USDJPY pair trades below the 108.40 sellers, a further decline towards the 108.10 and 107.75 levels may follow.