The Ethereum cryptocurrency has been depreciating against the US Dollar since January 10. The pair has lost about 24.12% of its values during the last week.
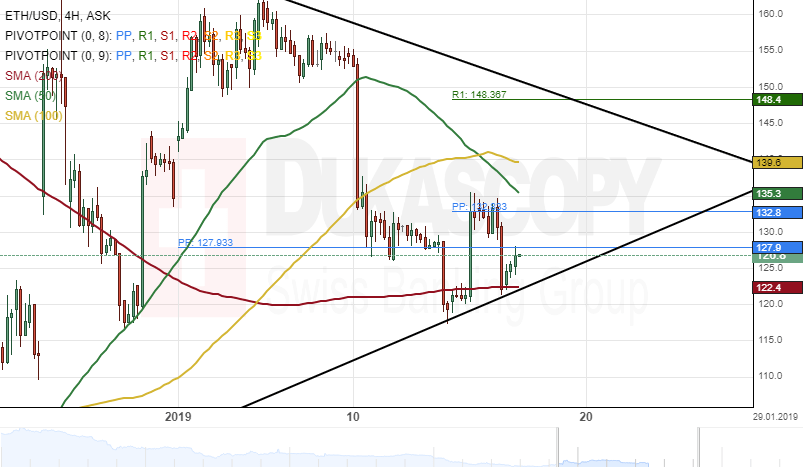
The ETH/USD pair tested the 200-hour simple moving average at 122.4 during the morning hours of Wednesday’s trading session.
If this support level formed by the 200-hour SMA holds, the blockchain will likely aim for the weekly R1 at 148.36 during the following trading session.
On the other hand, if the pair passes the SMA, the next target for bearish traders will be at the weekly S1 at 103.76.