

Sample Category Title
Gold: Yellow Metal Trading Slightly Lower In The Asian Session
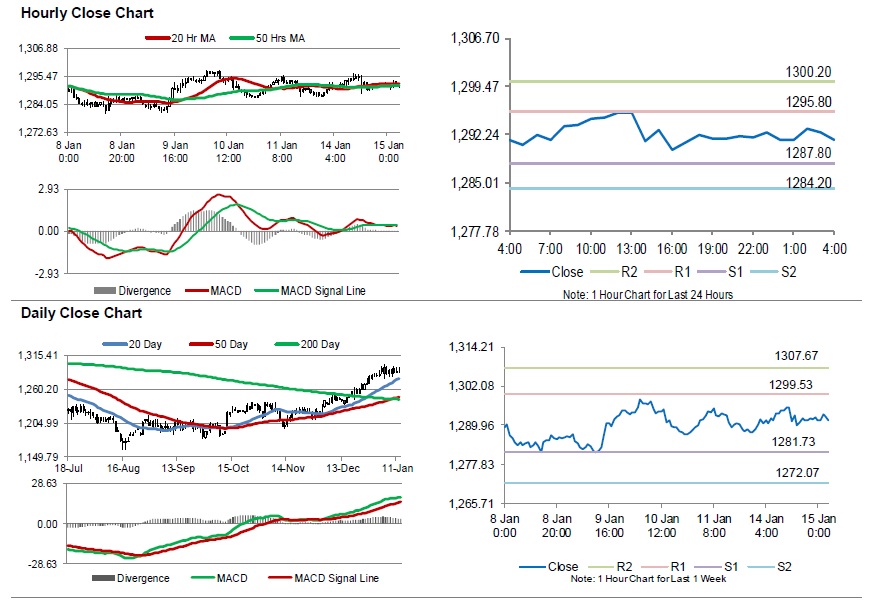
For the 24 hours to 23:00 GMT, Gold rose 0.30% against the USD and closed at USD1291.80 per ounce, as weakness in the US dollar strengthened demand for the precious yellow metal.
In the Asian session, at GMT0400, the pair is trading at 1291.40, with gold trading a tad lower against the USD from yesterday’s close.
The pair is expected to find support at 1287.80, and a fall through could take it to the next support level of 1284.20. The pair is expected to find its first resistance at 1295.80, and a rise through could take it to the next resistance level of 1300.20.
The yellow metal is showing convergence with its 20 Hr and 50 Hr moving averages.
Silver: White Metal Trading On A Stronger Footing This Morning
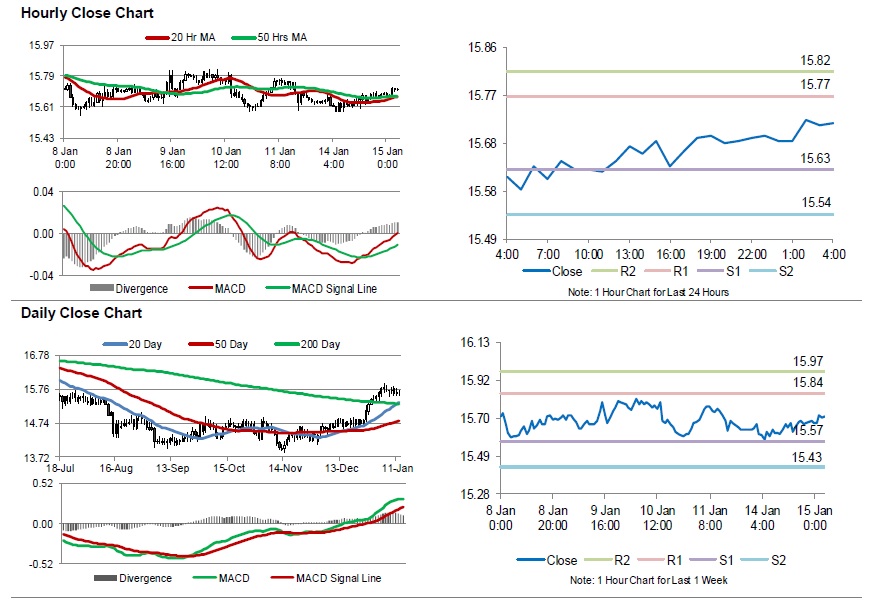
For the 24 hours to 23:00 GMT, Silver rose 0.32% against the USD and closed at USD15.69 per ounce, tracking gains in gold prices.
In the Asian session, at GMT0400, the pair is trading at 15.72, with silver trading 0.16% higher against the USD from yesterday’s close.
The pair is expected to find support at 15.63, and a fall through could take it to the next support level of 15.54. The pair is expected to find its first resistance at 15.77, and a rise through could take it to the next resistance level of 15.82.
The white metal is trading above its 20 Hr and 50 Hr moving averages.
Crude Oil: Oil Trading Higher, Ahead Of API’s Weekly Crude Oil Stockpiles Data
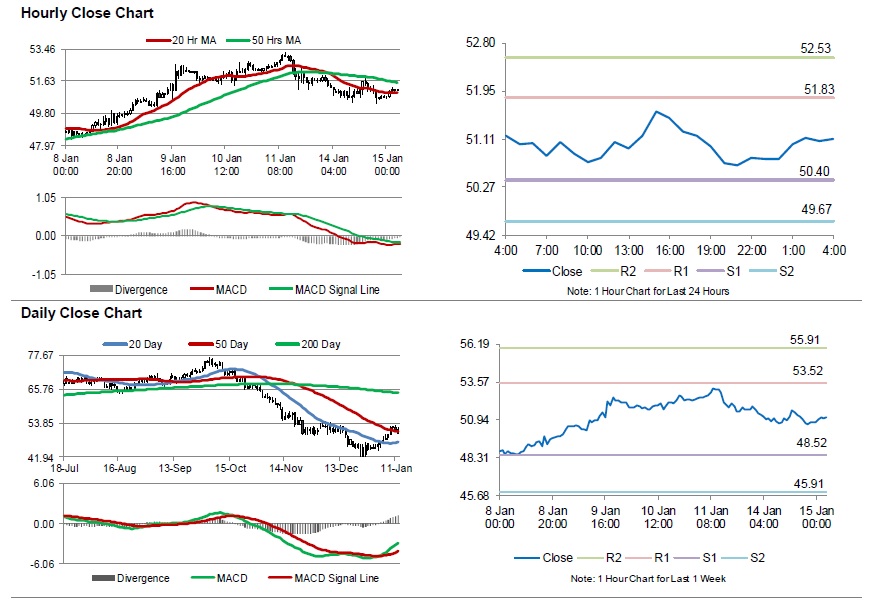
For the 24 hours to 23:00 GMT, Crude Oil declined 1.84% against the USD and closed at USD50.75 per barrel, as disappointing economic data from China raised concerns over global growth.
In the Asian session, at GMT0400, the pair is trading at 51.12, with oil trading 0.73% higher against the USD from yesterday's close.
The pair is expected to find support at 50.40, and a fall through could take it to the next support level of 49.67. The pair is expected to find its first resistance at 51.83, and a rise through could take it to the next resistance level of 52.53.
Crude oil is showing convergence with its 20 Hr moving average and trading below its 50 Hr moving average.
Asian update: Sterling strong ahead of Brexit vote, Yen soft as China lifts stocks
Risk sentiments are having an about turn after China pledges to work on a strong start in 2019. The rebound in is so far more than enough to reverse yesterday's selloff after ugly Chinese trade data. In the background, there is optimism of a deal between US and China to resolve the trade conflicts. Trump also reiterated yesterday again that "we're going very well with China" and "we are going to able to do a deal".
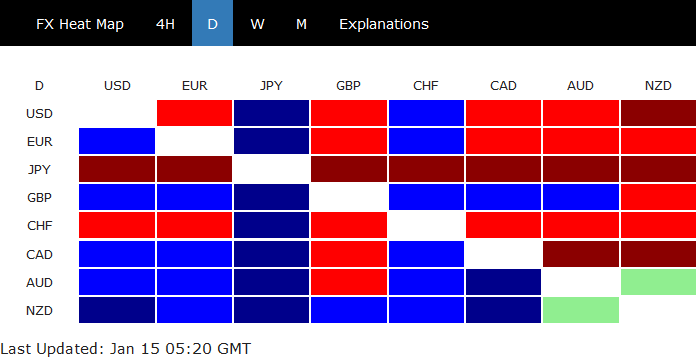
In the currency markets, Yen is the weakest one for today so far, followed by Swiss Franc and then Dollar. New Zealand Dollar leads commodity currencies higher. But for the week, Sterling is the strongest one after yesterday's surge. All eyes will be on the Brexit meaningful vote today, and the subsequent actions after the deal is defeated in the Commons.
At the time of writing:
- Nikkei is up 0.9%
- Hong Kong HSI is up 1.63%
- Shanghai SSE is up 0.90%
- Singapore Strait Times is up 1.31%
- 10 year JGB yield is down -0.0128 at 0.013, staying positive
Overnight:
- DOW dropped -0.36%
- S&P 500 dropped -0.53%
- NASDAQ dropped -0.94%
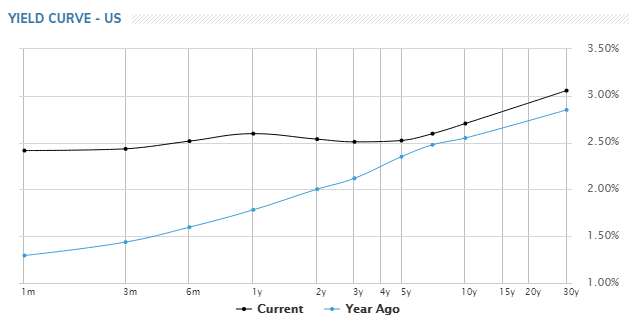
- 10-year yield rose 0.009 to 2.710
- 30-year yield rose 0.023 to 3.060
US yield curve remains inverted between 1-year and 5-year. But it's flattened much in the region. Also, strength is seen at the long end, with 30-year yield keeping 3% handle. Developments are so far positive.
China pledges to strive for good start in Q1
Stocks in Asia surge on hope that China would launch more stimulus measures to support the slowing economy. Chinese Premier Li Keqiang pledged to work to give the economy a strong start to achieve 2019 economic targets. There is no detail on the plan so far.
Li was quoted by State TV saying "we should strive for a good start in the first quarter to create conditions for completing the key full-year development targets and tasks." And, "our country's development environment is becoming more complex this year, there are more difficulties and challenges and the downward pressure on the economy is increasing,"
It's reported that the Chinese government is planning to lower growth target to 6-6.5%, down from expected 6.6% in 2018.
May could force a second vote with EU concessions, if the Brexit deal is defeated today
The highly anticipated meaningful Brexit vote in the UK Commons will take place today. There is no exact time set, but it's believed to be somewhere between 1900-2100 GMT.
Facing a lot of criticisms, Prime Minister Theresa May urged "all sides" to give her Brexit deal a "second look" in the Commons yesterday. She added that "No it is not perfect. And yes it is a compromise." But "I say we should deliver for the British people and get on with building a brighter future for our country by backing this deal tomorrow."
Separately, it's reported that May told Tories in a private meeting to focus on two things, "we have to deliver Brexit ... and two that we've got to keep Jeremy Corbyn as far away from Number 10 as possible."
While the deal is widely expected to be voted down, May could force a second vote after the defeat. It's reported that German Chancellor Angela Merkel is offering last-minute help to push for more EU concessions if the current deal is rejected. The concessions could include convincing Irish Prime Minister Leo Varadkar to agree to an end date to the so-called Irish backstop.
Fed Clarida: Fed to decide on interest rate on meeting by meeting basis
Fed Vice Chair Richard Clarida reiterated Fed should take a "patient" stance in 2019 and decide on interest rates on a "meeting by meeting" basis.
He added that "a lot has really happened since the first week of December." And, "we will look in particular at global developments and some of the global data that has been softening."
Though, he didn't see the the global slowdown as "severe" for now. And he doesn't see a recession "on the horizon".
Market Morning Briefing: Euro Is Again Heading Towards 1.15
STOCKS
The Resistance near 24000 on the Dow (23909.84, -0.36%), near 11000-11050 on the DAX (10855.91, -0.29%) and 2550 on the Shanghai (2543.11, +7.34, +0.29%) have all held yesterday, in line with expectation.
As mentioned yesterday, we might expect to see near-term dips towards 23500 and 10800-700 in the Dow and DAX respectively before they move up afresh later. A fall below 23500 and 10700, if seen, may trigger a deeper decline.
The Shanghai (2543.11, +7.34, +0.29%) might have scope to dip to 2500 over the next few days. Our preference is that it slowly starts moving up again from 2500.
Japan was closed yesterday. The Nikkei (20538.39, +0.88%) has been consolidative over the last few days. It is long-term bullish while above trendline Support at 19500 on the Weekly Line chart and dips are likely to be bought.
The Sensex (35,853.56, -156.28, -0.43%) and Nifty (10737.60, -57.35, -0.53%) have tested Supports at 35691 and 10730 respectively. Some more dip towards 35500 and 10650-600 respectively is possible in the near term. Such a dip, if seen, might present a buying opportunity for the long-term.
COMMODITIES
Commodities are trading at slightly higher levels today. Gold and Silver are stable and likely to continue their sideways movement.
China data reports a decline in the import-export concerning demand for oil. News states 3-cargoes of US Crude heading to China from the US Gulf Coast, first since late September after the 90-day pause started between the two countries.
Brent (59.71) and Nymex WTI (51.16) are slightly up after initial decline seen overnight. Crude prices look bearish in the near term or could remain ranged below 64 and 54 for the near term before declining further.
Brent-WTI Spread (8.52) could decline further towards 7.55 or even lower in the near term indicating a dip in the crude prices too.
Gold (1292.60) and Silver (15.71) continue to trade below important resistances of 1300 and 16 respectively and the prices are in a pause mode just now unable to decide which direction to move on. The bulls seem to be holding the prices at current levels not allowing the bears to take over just now. Near term could see a dip to 1280/70 and 15.25 on Gold and Silver respectively.
Copper (2.6455) has weekly long term support near 2.60 on the line chart but is unable to bounce above 2.70 just now. While below 2.70, we could expect some more of range trade in the 2.70-2.60 region. A break above 2.70 is needed to turn bullish for copper in the medium term.
FOREX
Dollar Index (95.52) has not been able to break above 95.78 and is coming off from there again towards 95.00. While below 95.75, the index looks bearish towards 95.00-94.50 in the near term. Although there is room on the upside, the index may possibly test 94.50 initially before bouncing back towards 96 or higher.
Euro (1.1483) is again heading towards 1.15. Resistance is now visible near 1.16/17 and while that holds, we may expect some ranged sideways movement within 1.14-1.16.
The Euro-Yen (124.54) is stuck below 125.20 and while that holds, narrow sideways movement could continue. A rise in Euro towards 1.16 could take Euro-Yen towards 125.20 or even higher in the near term. On the weekly line charts, medium term looks bullish.
Dollar Yen (108.45) is trading sideways and is in a consolidation mode. The long term support on the weekly line charts suggests bullishness in the medium to long term. The current sideways movement could be a pause period before a sharp upmove.
Pound (1.2893) is looking bullish for the near term targeting 1.30/31 soon. Decent near term resistance is visible on the 3-day line chart near 1.31.
Aussie (0.7211) is nearing to resistance at 0.73 from where a corrective dip is possible. Near term view is bullish but rejection from 0.73 could bring it back to 0.71.
USD-CNY (6.7521) is almost stable today. While 6.74 holds, we could see some stable and ranged movement in the 6.74-6.78 region.
Dollar Rupee (70.94) has scope of testing important resistance zone of 71.00/15 on the upside while the downside could be limited to 70.60. On the NDF, USDINR is trading at 70.74 indicating a possible dip today. But there is scope of testing upper band of 71.00/15 before sharply coming off from there.
INTEREST RATES
As it turns out, the Indian 10Yr GOI (7.4309%) saw a decent dip yesterday. With the December CPI (2.19%) coming in even lower than the reading of 2.33% for Nov, the market will price in greater chances of a rate cut by the RBI. Maybe this will pull the 10Yr GOI to dip below 7.40%. Let us see how that goes.
The German 10Yr (0.22%) is trading millimetrically lower while the German 2yr (-0.589%) seems to be moving up slowly. So, the Curve as a whole is getting a little flatter.
We remain unsure of the direction of US Yields (2Yr 2.53%, 5Yr 2.53%, 10Yr 2.70% and 30Yr 3.05%) in the near term and would like to wait and watch for a few days.
GBP/USD Could Test 1.3000 In Near Term
Key Highlights
- The British Pound gained momentum recently and broke the 1.2900 resistance against the US Dollar.
- There are two bullish trend lines formed with support at 1.2780 on the 4-hours chart of GBP/USD.
- China’s Trade Balance in Dec 2018 posted a surplus of $57.06B, more than the $51.53B forecast.
- The US Producer Price Index for Dec 2018 will be released today, which could decline 0.1% (MoM).
GBPUSD Technical Analysis
There were solid gains in the British Pound in the past few days above the 1.2700 and 1.2800 levels against the US Dollar. The GBP/USD pair even broke the 1.2900 resistance recently before correcting a few pips.
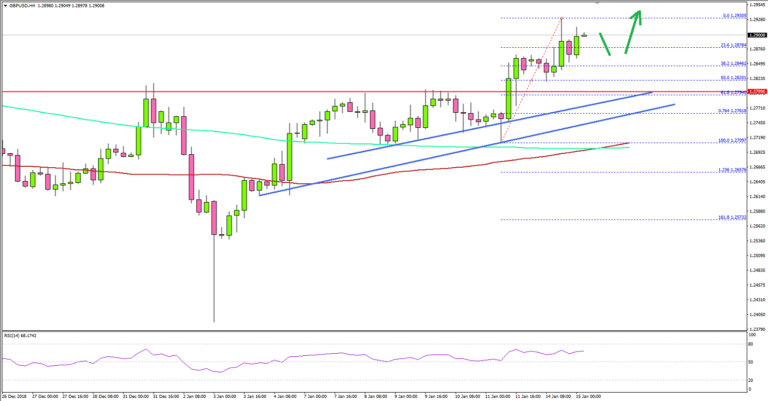
Looking at the 4-hours chart, the pair climbed higher above the 1.2770 and 1.2800 resistance levels. There was even a close above the 1.2800 pivot area and the 100 simple moving average (red, 4-hours), opening the doors for more gains.
The pair spiked towards the 1.2940 level and later started a downside correction. On the downside, the previous resistance at 1.2800 may act as a strong support for buyers. It also coincides with the 50% Fib retracement level of the last wave from the 1.2709 low to 1.2930 high.
Besides, there are two bullish trend lines formed with support at 1.2780 on the same chart. Therefore, dips in GBP/USD remain supported near the 1.2800 and 1.2780 levels, below which it could decline to 1.2700.
On the upside, an initial resistance is at 1.2930 and 1.2940, above which the pair is likely to climb sharply towards the 1.2960 and 1.3000 resistance levels.
Fundamentally, the Chinese Trade Balance report for Dec 2018 was released by the General Administration of Customs of the People’s Republic of China. The market was looking for a trade surplus of $51.53B in Dec 2018, compared with the last $44.71B.
However, the actual result was better than the forecast as there was a surplus of $57.06B. On the negative side, exports of goods and services declined 4.4% in Dec 2018 (YoY), compared with the +3.0% forecast.
The market sentiment was positive for GBP/USD and EUR/USD, but there could be short term dips before a fresh upward move.
Economic Releases to Watch Today
- US Producer Price Index Dec 2018 (MoM) – Forecast -0.1%, versus +0.1% previous.
- US Producer Price Index Dec 2018 (YoY) – Forecast +2.5%, versus +2.5% previous.
- US IBD/TIPP Economic Optimism Index for Jan 2019 (MoM) – Forecast 53.1, versus 52.6 previous.
Daily Markets Broadcast
Weak China data pushes Wall Street lower
China's December trade data was weak across the board, souring sentiment across global equity markets yesterday. The US financial sector was buoyed by mixed earnings from Citibank. UK Parliament votes on the Brexit deal today.
US30USD Daily Chart
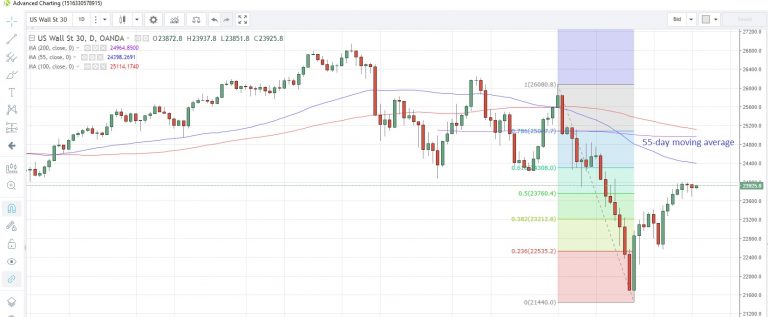
The US30 index fell for a second straight day yesterday after weak trade numbers pressured manufacturers
The 61.8% Fibonacci retracement of December's drop is at 24,308, while the 55-day moving average has edged lower to 24,398
US producer prices are expected to echo the decline in consumer prices reported last week. Prices are seen falling 0.1% m/m in December, the first decline in four months.
DE30EUR Daily Chart
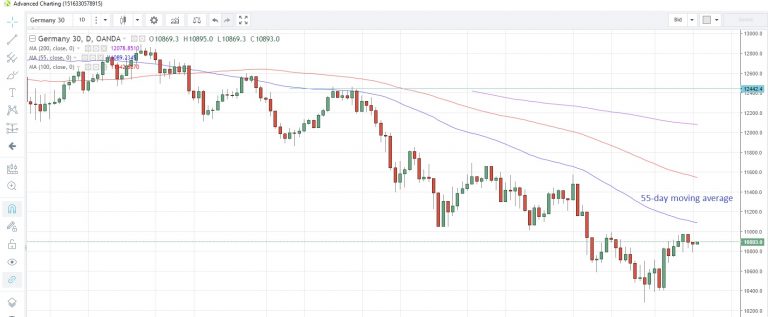
The Germany30 index slid for a second day yesterday, pressured by the China data and today's UK Brexit vote
The 55-day moving average at 11,089 continues to cap the index near-term
Euro-zone trade data for November is due today. It's expected to show a narrower surplus of E13.7b from E14.0b in October.
UK100GBP Daily Chart
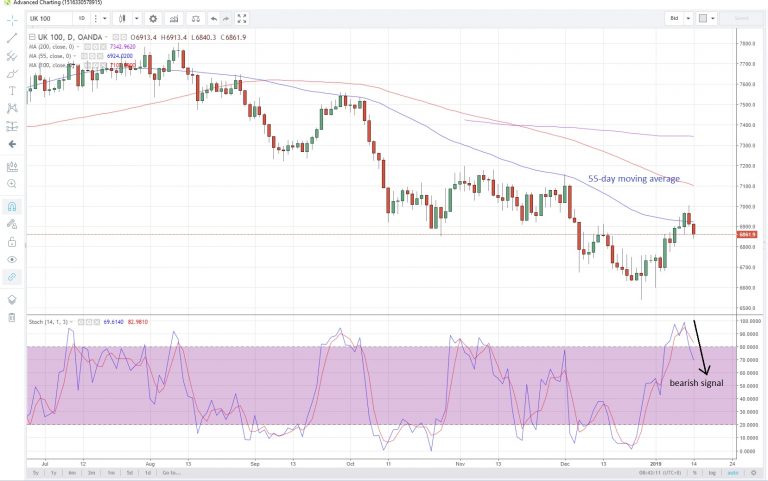
The UK100 index fell for a second consecutive day yesterday as the uncertainty surrounding today's UK Brexit vote impacted sentiment
The index failed to maintain a foothold above the 55-day moving average after closing above it last Thursday. The average is now at 6,924. Momentum indicators emitting bearish signals
General consensus is that the Brexit deal will be rejected as it stands, unless Europe offers better terms for the Irish border. The vote is scheduled for 7pm GMT.