Sample Category Title
Sterling Rises As Brexit Decision Day Arrives
The euro remained lower against the USD as investors grew wary about cracks in the European economy. This was after data from Europe showed that the economy was softening. Yesterday, data from Eurostat showed that the industrial production declined by 3.3% in November. This was a continuation of the weak data that has emerged from the EU in recent months. Last week, data showed that German manufacturing production declined by minus 1.9% while business confidence in the region declined as well. Previously, PMIs from the EU also declined sharply.
The sterling rose today as traders waited for the vote in the house of commons on Theresa May’s Brexit bill. Most investors expect the parliament to vote against the bill, a move that will leave the country in uncharted territory. Yesterday, Theresa May pleaded with the members to vote for the bill, saying that it was the best deal that the country could have got. Meanwhile, the European Union seems open to the idea of delaying the March deadline to later this year, a move that has been rejected by a number of Eurosceptic members of parliament.
Yesterday, the price of crude oil declined as traders grew wary about the slowing demand from China. This happened after data from the country pointed to weaker growth. The price recovered in overnight trading and rallied by more than 1% as traders started to focus on the supply cuts announced by OPEC.
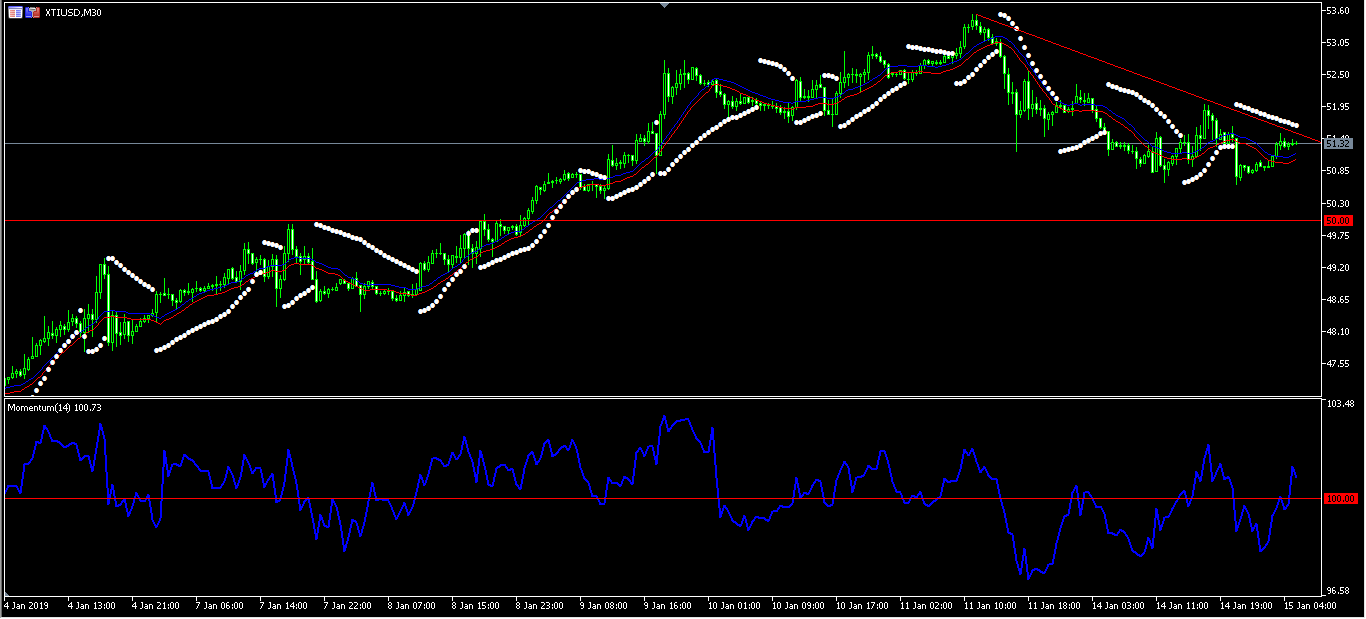
XTI/USD
The XTI/USD pair rose by more than 1% in overnight trading and is currently trading at 51.32. This is lower than last week’s high of 53.55. On the hourly chart, the price is slightly above the Envelopes indicator while the Parabolic SAR indicator points to more downward moves. The Momentum indicator has also moved above the 100 level. There is a likelihood that the price will resume the downward momentum later today. If it does, it will test the important support of 50.
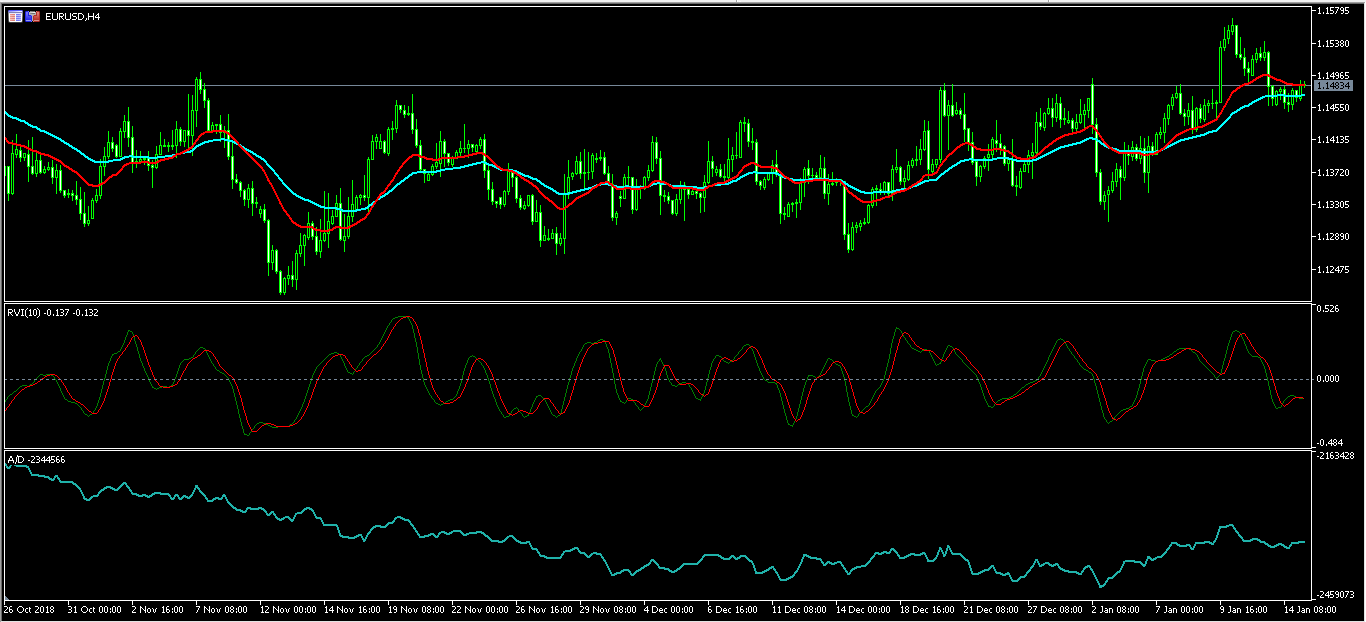
EUR/USD
The EUR/USD pair remained closer to Friday lows as traders waited for the Brexit vote in parliament. The pair is now trading at 1.14900, which is along the 42-day and 21-day EMA. The Relative Vigor Index (RVI) has moved below the neutral level while the Accumulation/Distribution indicator has flattened. The pair will likely head lower if Theresa May loses the Brexit vote today.
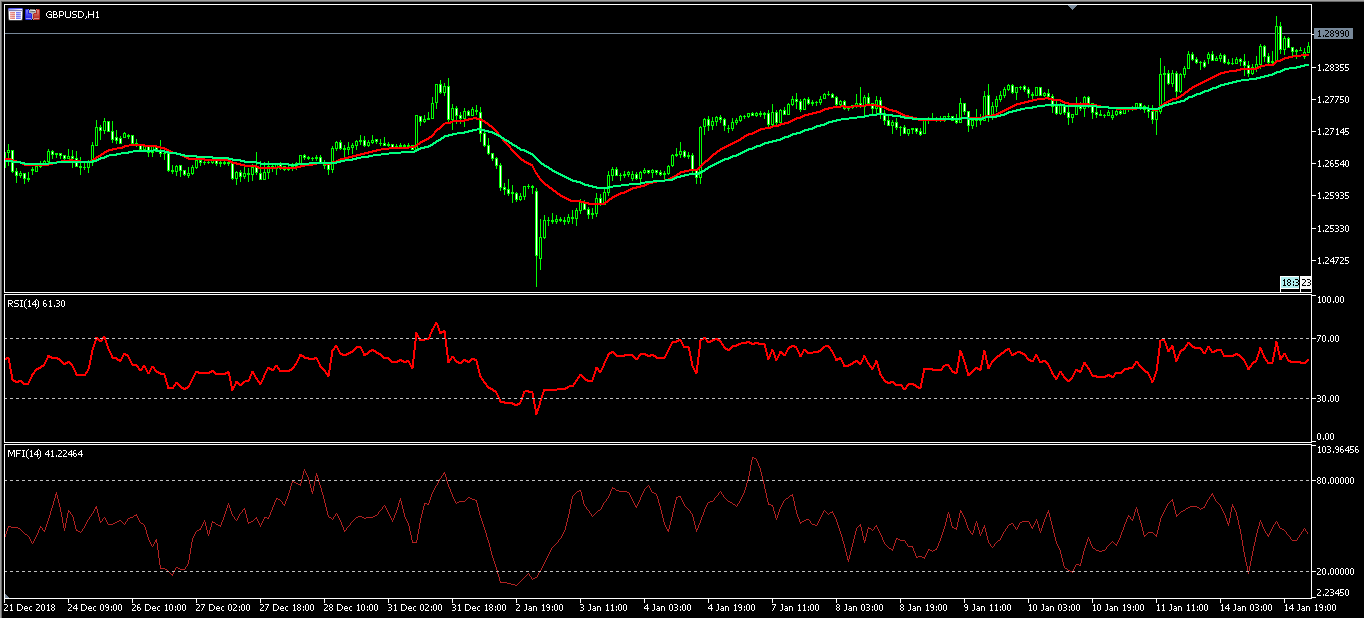
GBP/USD
The GBP/USD remained closer to the 7-week high as traders waited for a decision on Brexit. The pair is now trading at 1.2896 level, which is closer to the weekly high of 1.2928. On the hourly chart, the pair’s price is above the short and medium-term moving averages while the RSI remains flat along the 61 level. The Money Flow index, which is similar to the RSI is also flat along the 41 level. Today, the price could move in either way depending on how the vote goes.
USD/CAD Daily Outlook
Daily Pivots: (S1) 1.3256; (P) 1.3277; (R1) 1.3302; More...
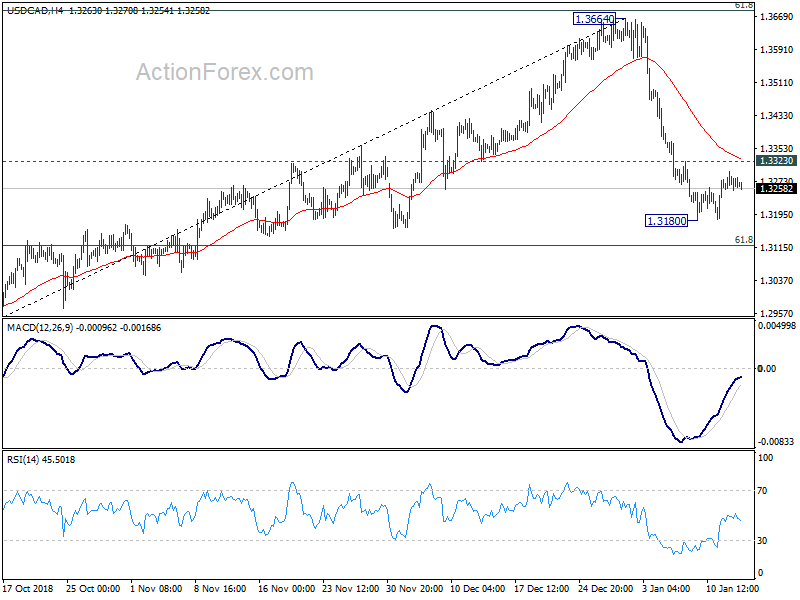
Intraday bias in USD/CAD stays neutral as consolidation from 1.3180 is still in progress. Recovery should be limited by 1.3323 minor resistance to bring another decline. On the downside, break of 1.3180 will resume the fall from 1.3664 and target 61.8% retracement of 1.2781 to 1.3664 at 1.3118. We'll start to look for bottoming sign below there. On the upside, above 1.3323 will suggest short term bottoming and turn bias back to the upside for stronger rebound.
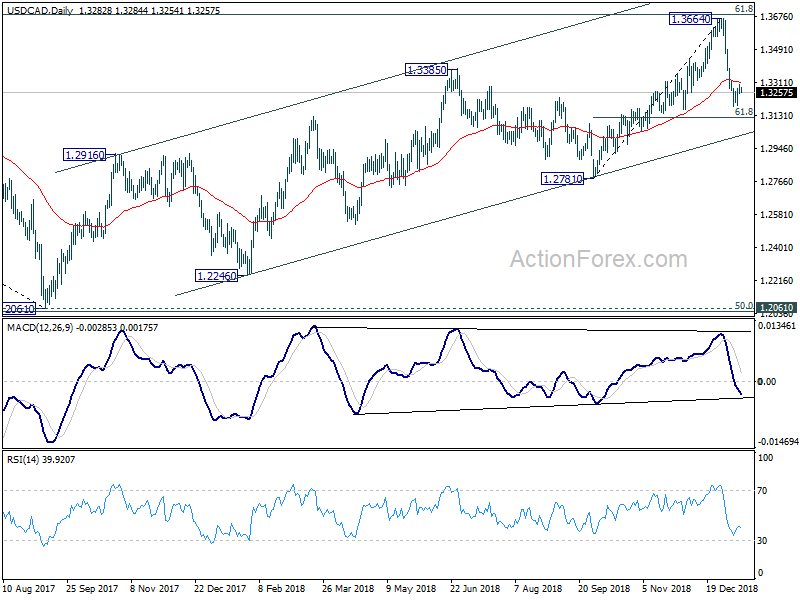
In the bigger picture, the medium term rise from 1.2061 (2017 low) might continue further. But the structure of such rise is not clearly impulsive so far. Hence, we'd stay cautious on strong resistance from 61.8% retracement of 1.4689 (2016 high) to 1.2061 at 1.3685 and 1.3793 resistance to limit upside, and bring medium term topping. But in any case, medium term outlook will stay bullish as long as channel support (now at 1.2993) holds. Sustained break of 1.3793 will pave the way to retest 1.4689 (2015 high).
GBP/JPY Daily Outlook
Daily Pivots: (S1) 138.51; (P) 139.28; (R1) 139.95; More...
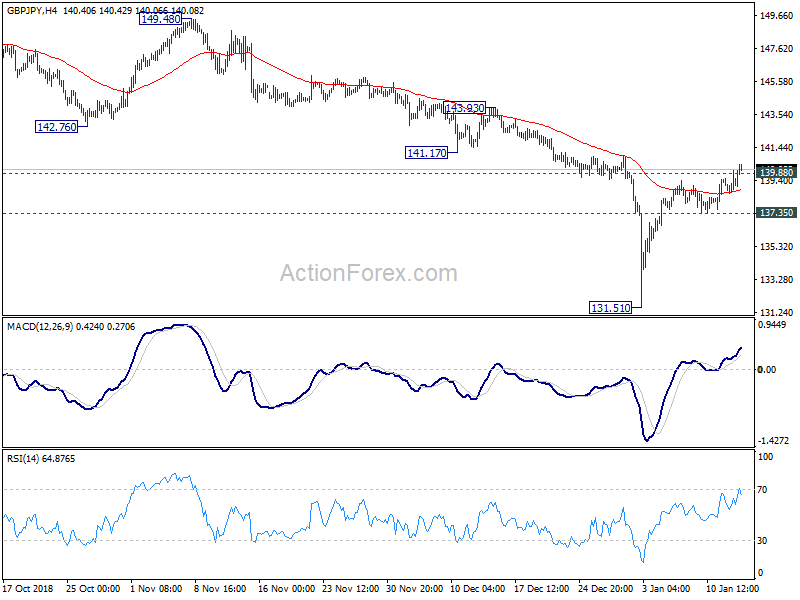
GBP/JPY's rebound from 131.51 extends today and focus remains on 139.88 resistance. Sustained trading above 139.88 will dampen our bearish view and bring stronger rise to 143.93 resistance next. Nevertheless, reversal from current level, followed by 137.35 support will confirm completion of rebound from 131.51. Intraday bias will be turned back to the downside for retesting 131.51 low.
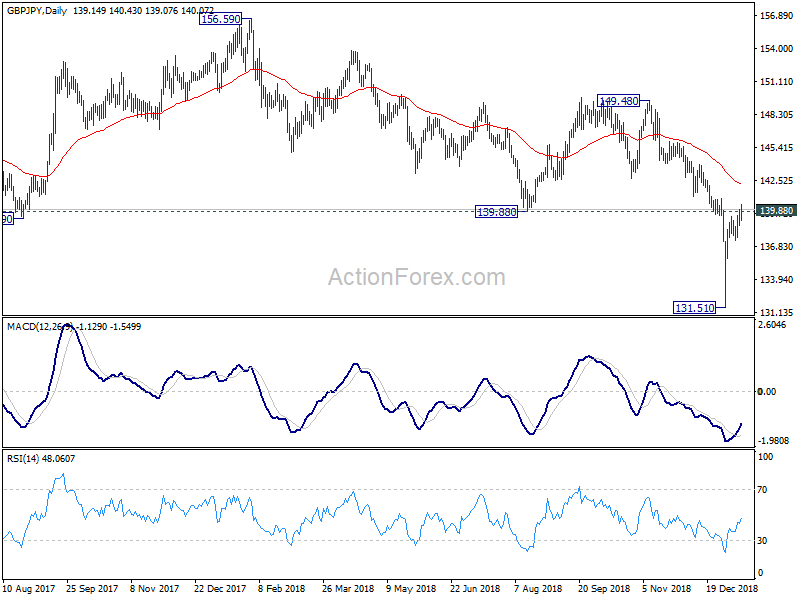
In the bigger picture, corrective medium term rise from 122.36 (2016 low) has completed at 156.69 already. That came after failing to break through 55 month EMA. Fall from 156.59 (2018 high) is seen as resuming the long term down trend from 195.86 (2015 high). Below 131.51 will target 122.36 low first. And this will now remain the preferred case as long as 139.88 support turned resistance holds. Sustained break of 139.88 will mix up the outlook and we'll reassess on the final structure of the rebound from 131.51.
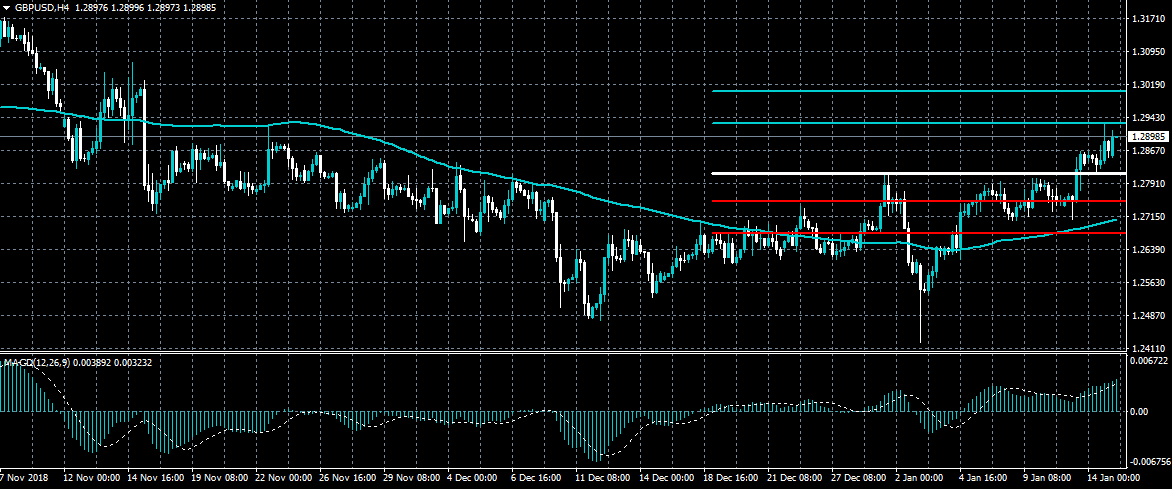
GBPUSD 1.2930 Level Now Key Resistance
The British pound continues to advance to the upside against the US dollar, with the recent rally extending all the way to the 1.2930 resistance level. Overall, the short-term trend remains bullish while price continues to trade above the pivotal 1.2810 level. It also worth noting that we may be seeing a short-squeeze in the GBPUSD pair, ahead of today’s crucial Brexit vote in UK parliament.
The GBPUSD pair remains intraday bullish while trading above the 1.2810 level, key technical resistance is now found at the 1.2930 and 1.3000 levels.
If the GBPUSD pair trades below the 1.2810 level, we could see a decline towards the 1.2760 and 1.2660 support levels.
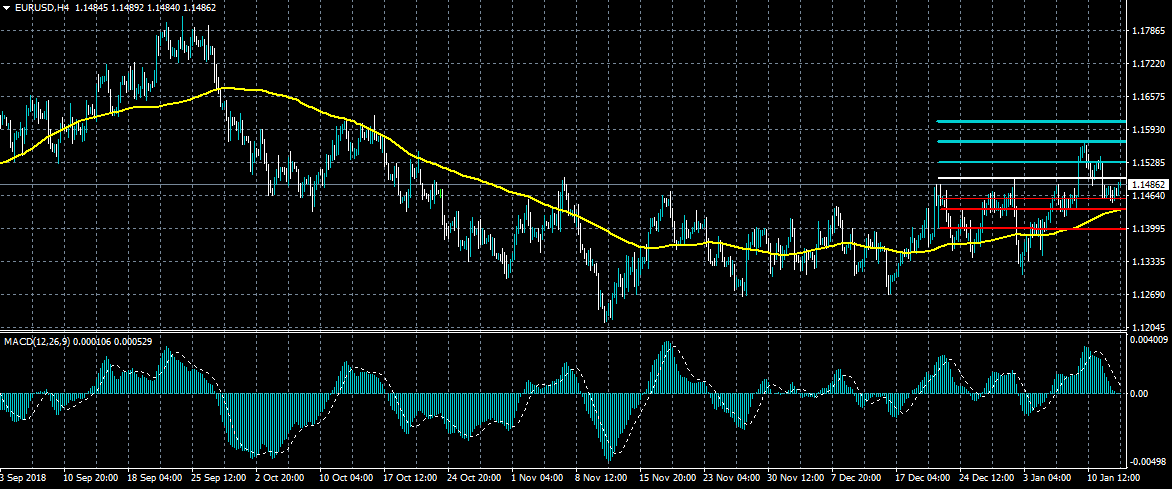
EURUSD Bulls Attempting To Take Control
The euro has moved back towards the top of its weekly trading range against the US dollar, as the greenback comes under selling pressure across the board on Tuesday. EURUSD buyers are now attempting to take control of price action, with a strong move above the 1.1490 level now needed for bulls to advance towards the 1.1430 resistance barrier. Technical failure around the 1.1490 resistance level will likely encourage sellers to attack the 1.1460 support zone once again.
The EURUSD pair is only intraday bullish while trading above the 1.1490 level, key technical resistance is found at the 1.1530 and 1.1569 levels.
If the EURUSD pair fails around the 1.1490 level, sellers may test towards the 1.1460 and 1.1430 support levels.
EUR/JPY Daily Outlook
Daily Pivots: (S1) 123.73; (P) 124.09; (R1) 124.40; More....
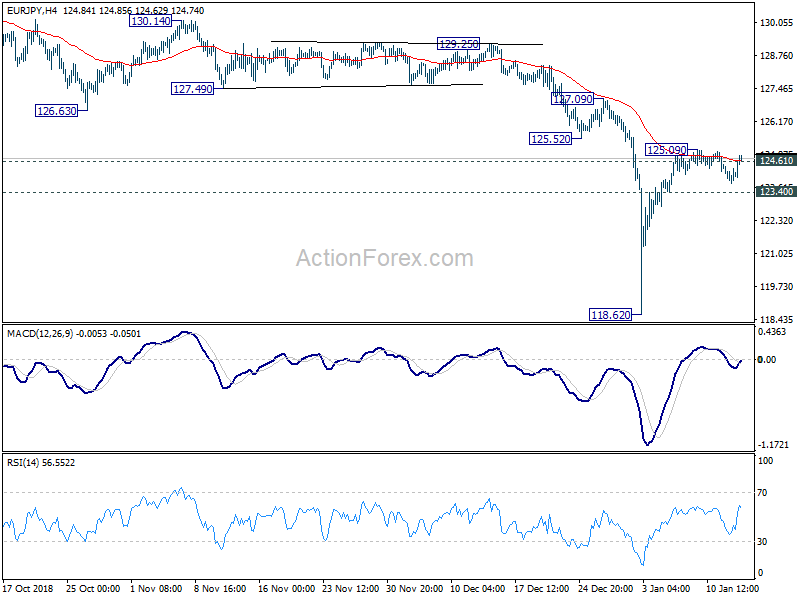
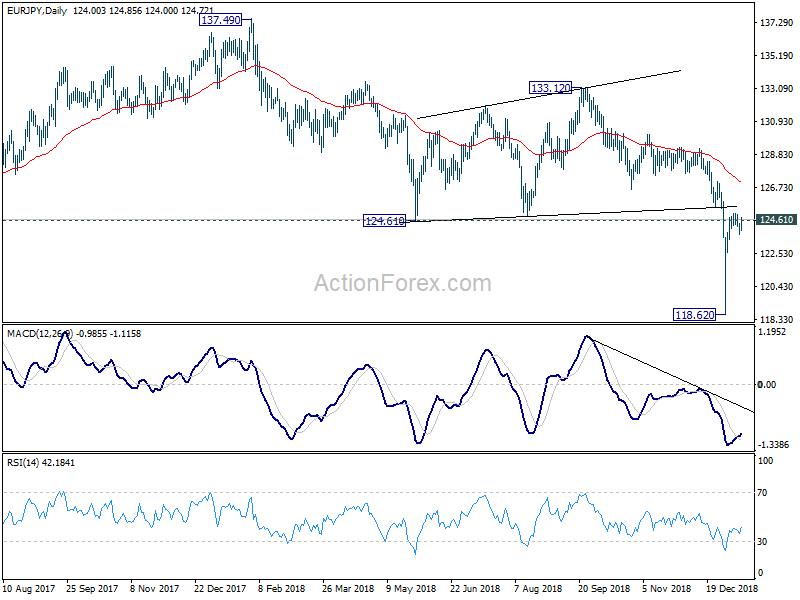
EUR/JPY is staying in right range below 125.09 and intraday bias remains neutral first. For now, we'd still expect strong resistance around 124.61 to complete the rebound from 118.62 low. Larger decline is expected to resume afterwards. Break of 123.40 will affirm our view and turn bias back to the downside for retesting 118.62 low first. However, sustained break of 124.61 will dampen our view and extend the rebound to 127.09 resistance next.
In the bigger picture, medium term rebound from 109.03 (2016 low) has completed at 137.49 already, with corrective structure. Fall from 137.39 is seen as a medium term fall, resuming the decline from 149.76 (2014 high). Such decline should break through 109.03 low next. This will remain the preferred case as long as 124.61 support turned resistance holds. Sustained break of 124.61 will mix up the outlook and we'll reassess on the final structure of the rebound from 118.62.
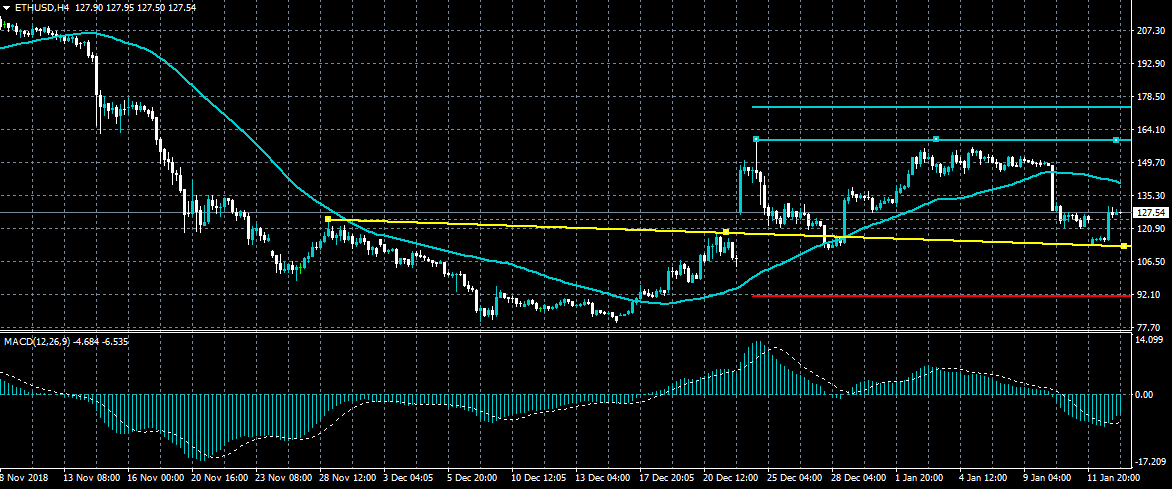
ETHUSD Key Treandline Support Holds
Ethereum bulls are attempting to recover upside momentum in early Tuesday trade, with the ETHUSD pair bouncing sharply from key trendline support. If buyers can sustain the recovery, the recent pullback will have created a third higher trading low for the ETHUSD pair. Bullish momentum is also building, as the MACD indicator on the one and four-hour time frames are starting to move higher.
The ETHUSD pair is bullish while trading above the $126.00 level, key resistance is found at the $158.00 and $170.00 levels.
If ETHUSD pair trades back under the $126.00 level, sellers may test towards the $110.00 and $92.00 support levels.
EUR/CHF Daily Outlook
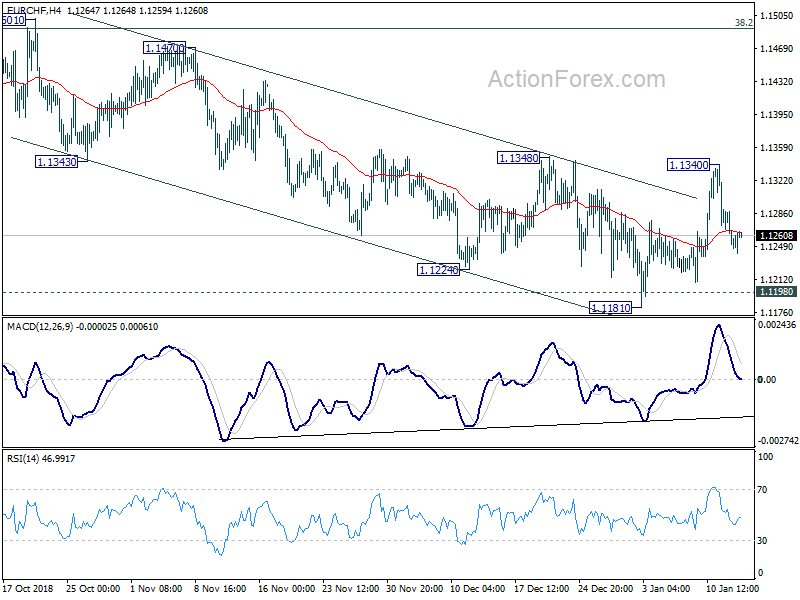
Daily Pivots: (S1) 1.1234; (P) 1.1262; (R1) 1.1278; More...
Intraday bias in EUR/CHF remains neutral at this point. For now, we're still slightly favoring the case the choppy decline from 1.1501 has completed at 1.1181 already. On the upside, break of 1.1348 will confirm this bullish case and turn bias to the upside for retesting 1.1501 next. On the downside, in case of another fall, we'd expect strong support from 1.1154/98 support zone to contain downside to bring rebound.
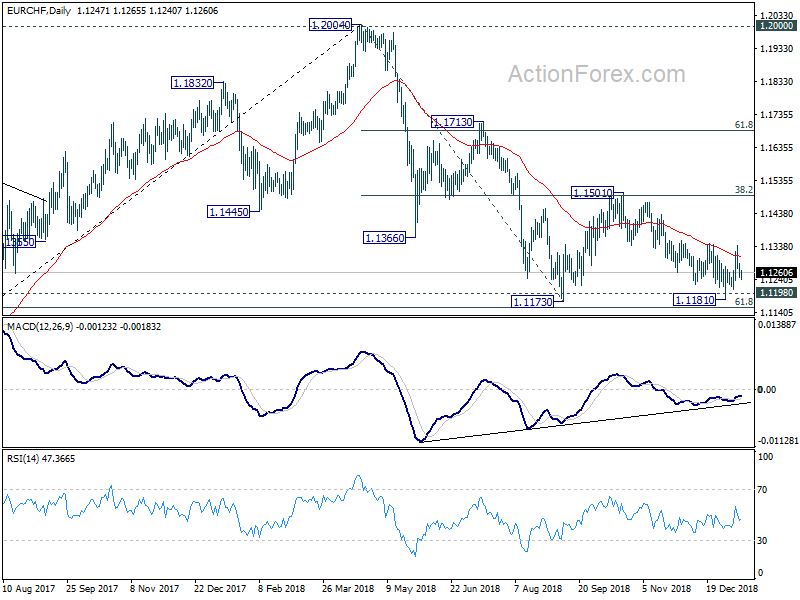
In the bigger picture, price actions from 1.2004 medium term top is seen as a correction only. Downside should be contained by support zone of 1.1198 (2016 high) and 61.8% retracement of 1.0629 to 1.2004 at 1.1154 to complete it and bring rebound. A break of 1.2 key resistance is still expected in the medium term long term. However, sustained break of the mentioned support zone will mark reversal of the long term trend. In that case, 1.0629 key support will be back into focus.
EUR/AUD Daily Outlook
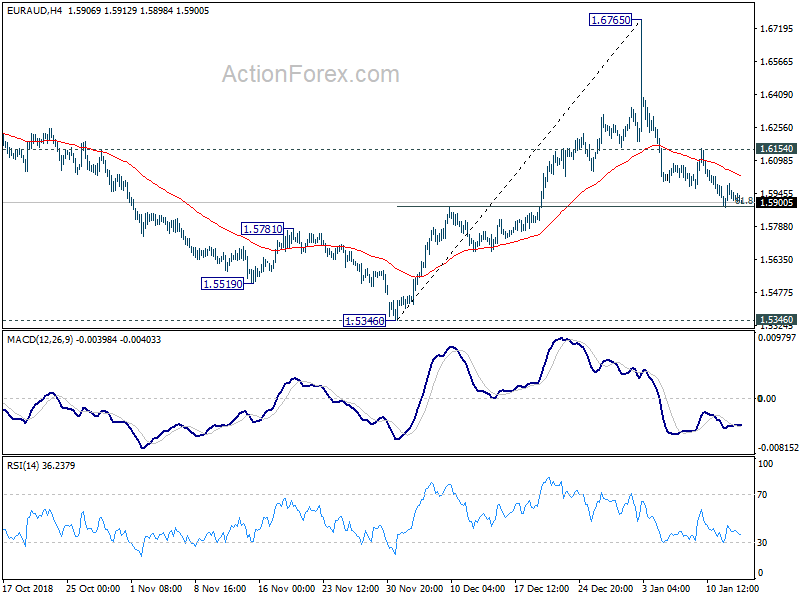
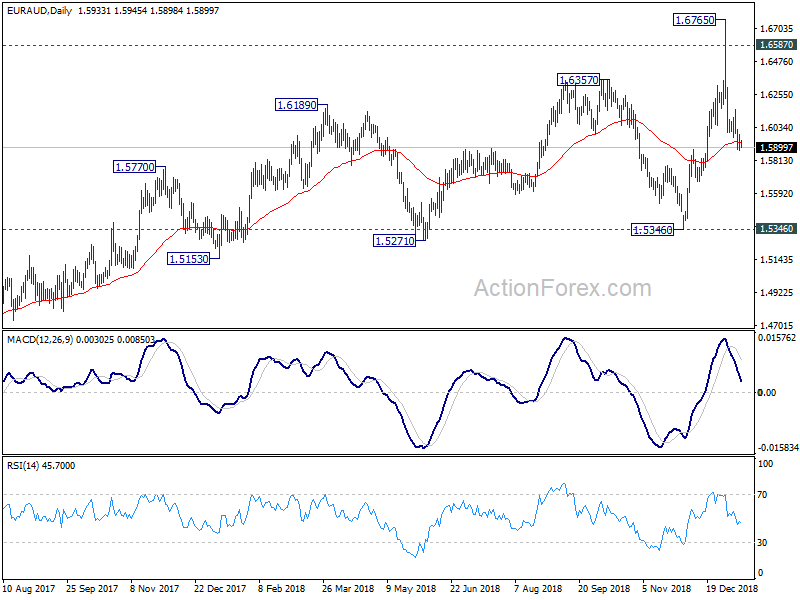
Daily Pivots: (S1) 1.5880; (P) 1.5935; (R1) 1.5990; More....
No change in EUR/AUD's outlook. With 1.6154 minor resistance intact, fall from 1.6765 is expected to extend lower. On the downside, sustained break of 61.8% retracement of 1.5346 to 1.6765 at 1.5888 will pave the way to 1.5346 key support level. On the upside, however, break of 1.6154 will indicate short term bottoming. Intraday bias will then be turned back to the upside for retesting 1.6765.
In the bigger picture, the failure to sustain above 1.6587 key resistance (2015 high), argues that up trend from 1.1602 (2012 low), is not ready to resume yet. But still, as long as 1.5346 support holds, outlook will remain bullish. Break of 1.6765 will target 61.8% retracement of 2.1127 (2008 high) to 1.1602 at 1.7488 next. However, firm break of 1.5346 key support will indicate trend reversal, with bearish divergence condition in weekly MACD, and turn outlook bearish.
Elliott Wave View: 5 Waves Rally In Alibaba (BABA)
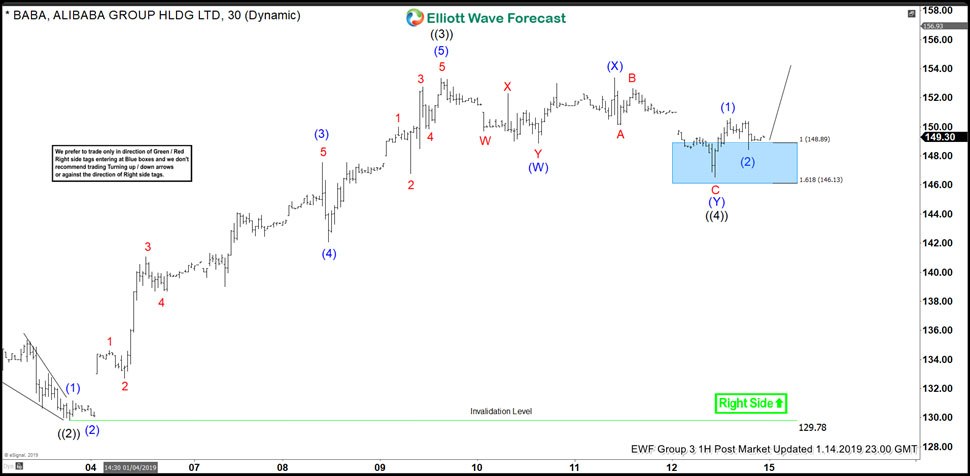
Short term Elliott Wave view of Alibaba (BABA) calls for the rally from Dec 24, 2018 low ($129.1) as a 5 waves impulse Elliott Wave structure. Up from there, wave ((1)) ended at $142.51 and wave ((2)) pullback ended at $129.99. Wave ((3)) rally ended at $153.35 and wave ((4)) pullback is proposed complete at $146.54. The stock still needs to break above wave ((3)) at $153.35 to avoid a double correction.
As an Impulse, internal of wave ((1)), ((3)), and ((5)) subdivide in 5 waves of lesser degree. Within wave ((3)), we see the lesser degree Impulse in wave (1) at $131.15, wave (2) at $130.05, wave (3) at $147.54, wave (4) at $142.06, and wave (5) at $153.35. Wave ((4)) pullback ended as a double three Elliott Wave structure, where wave (W) ended at $148.88, wave (X) ended at $153.38, and wave (Y) ended at $146.54.
Near term, expect Alibaba to extend higher in wave ((5)) while it stays above $146.54. Potential target wave ((5)) can reach as high as $160 – $163 area when wave ((5)) = ((1)). Afterwards, cycle from Dec 24, 2018 should end and Alibaba can pullback to correct that cycle in 3, 7, or 11 swing.
Alibaba (BABA) 1 Hour Elliott Wave Chart