Sample Category Title
Week Ahead: ECB, Brexit & TradeWar
US non-Farm Payrolls disappointed relative to markets forecast, as US economy added 155K jobs on November and employment rate at 3.7%. OPEC+ agreed to cut their production by 1.2 mb/d with effect from January 2019. Trade deal developments between the US and China have been important market drivers last week and fueled by the arrest of Huawei’s CFO.
EURUSD
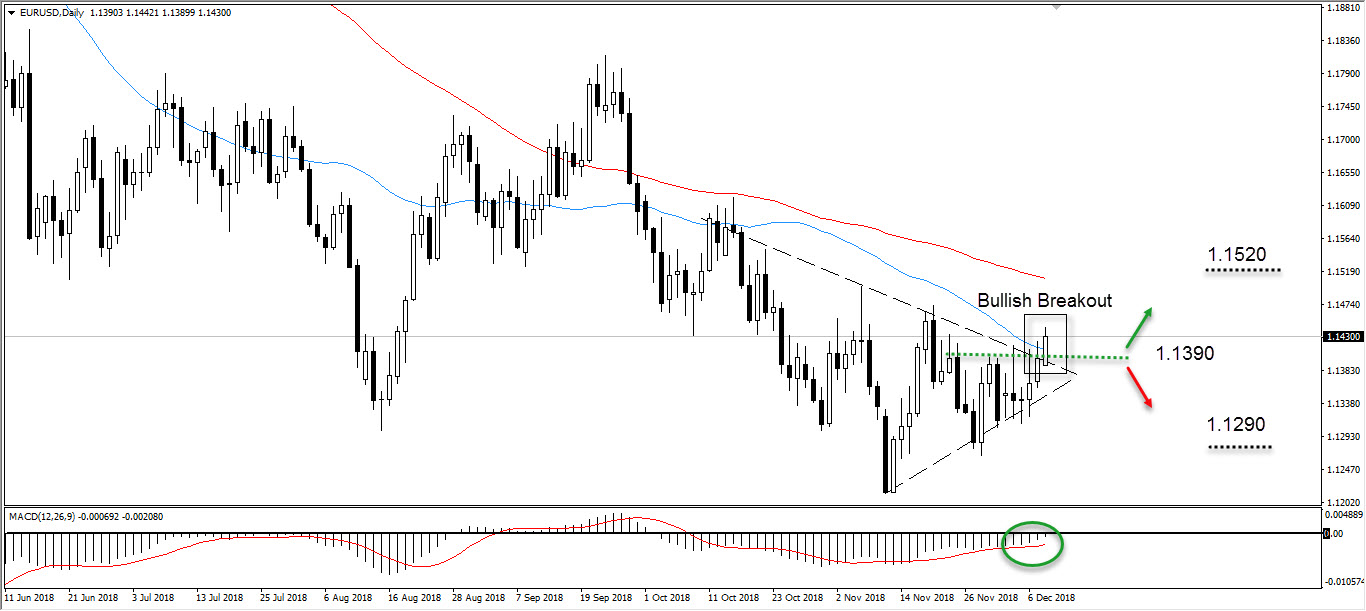
There is a high probability to see a leg higher to target the resistance at 1.1520. The pair was trading within asymmetrical triangle, however, by the start of this week we can see buying momentum is building up. Support is seen at 1.1390 and 1.1290.
GBPUSD
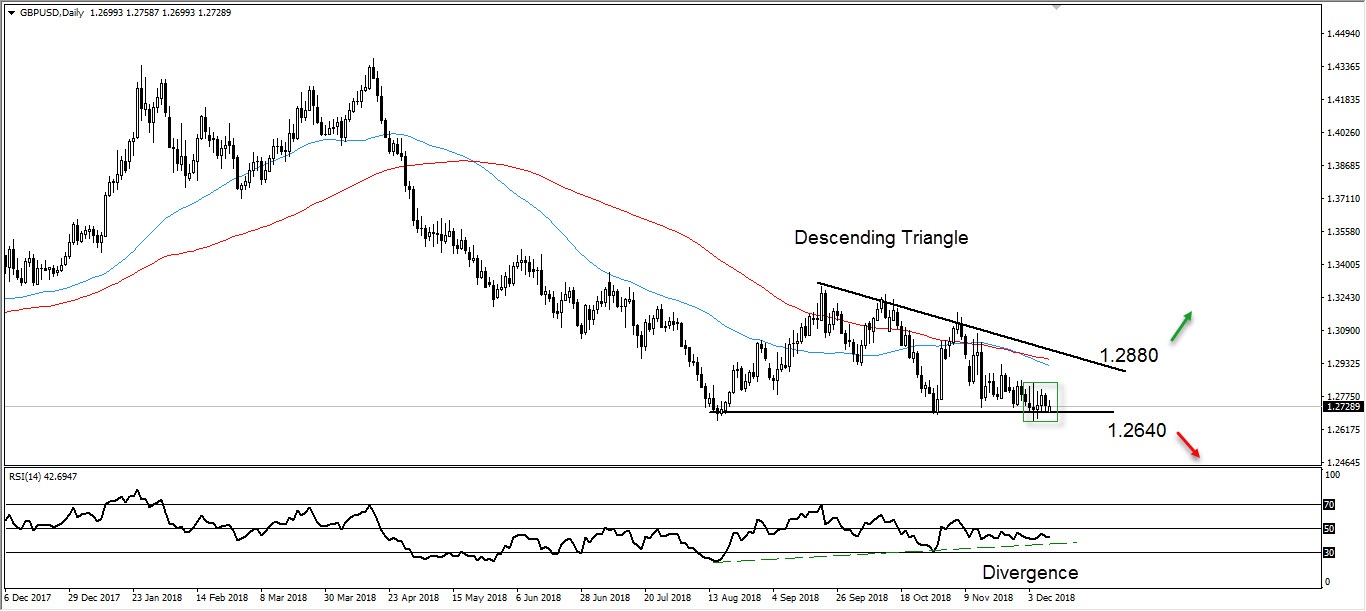
The risk is seen higher, Early strength today at the major support would continue to the upper boundary of the descending channel at 1.2880. Support initially seen at 1.2645.
USDJPY
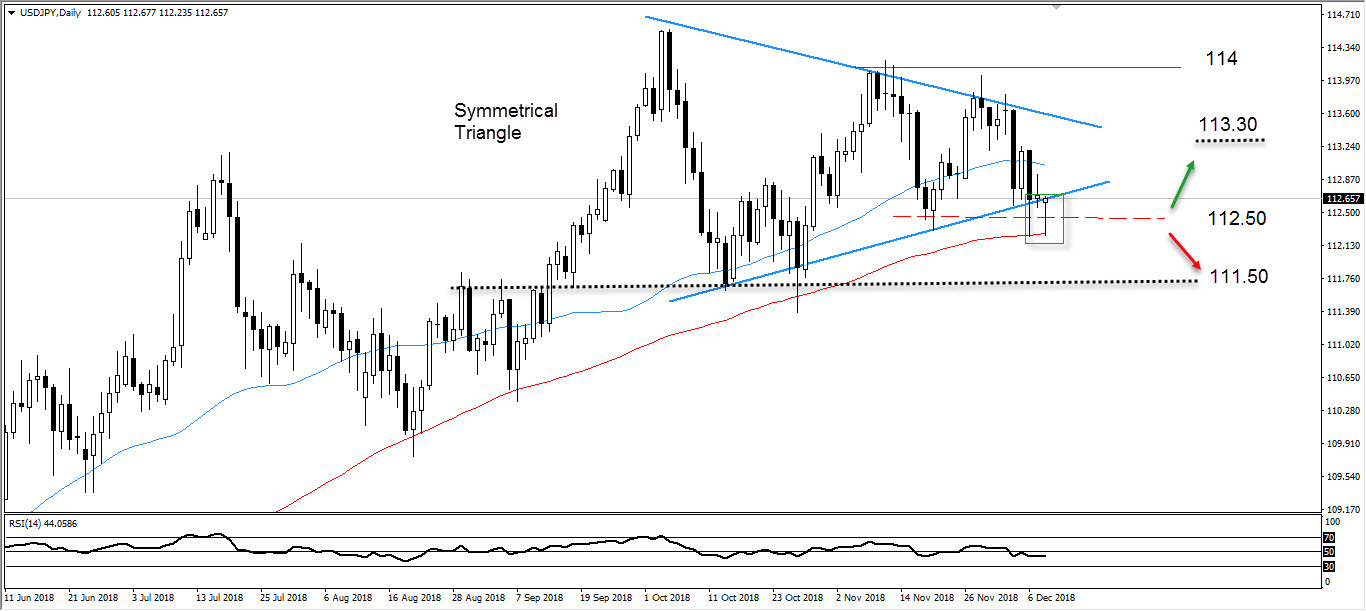
The pair is still trading within symmetrical triangle, after the strong bounce from key support at 112.50. As USDJPY is trading above 112.50 the risk is higher and next resistance is seen at 113.30. Support is initially at 112.50/111.80.
XAUUSD
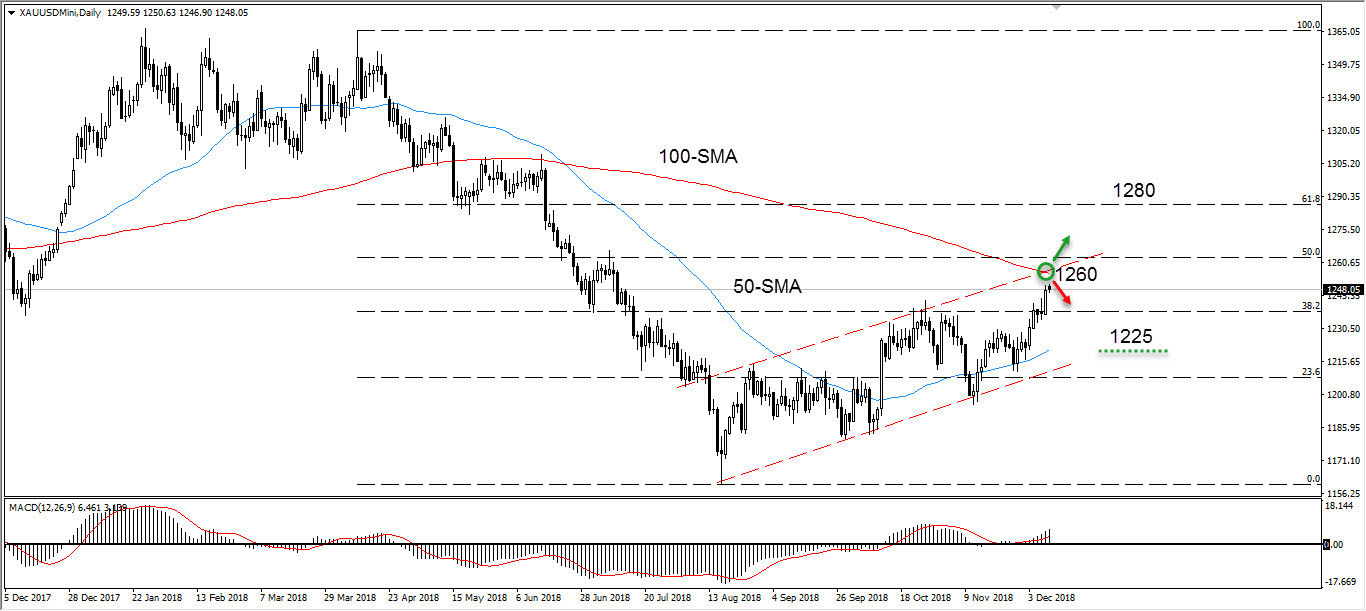
The spotlight stays directly on the top of the rising channel. On Friday, we saw the rally continue further to the upper band of the rising channel, we could see resumption toward the resistance at 1255/1258. However, the support is seen at 1242/1238.
WTI
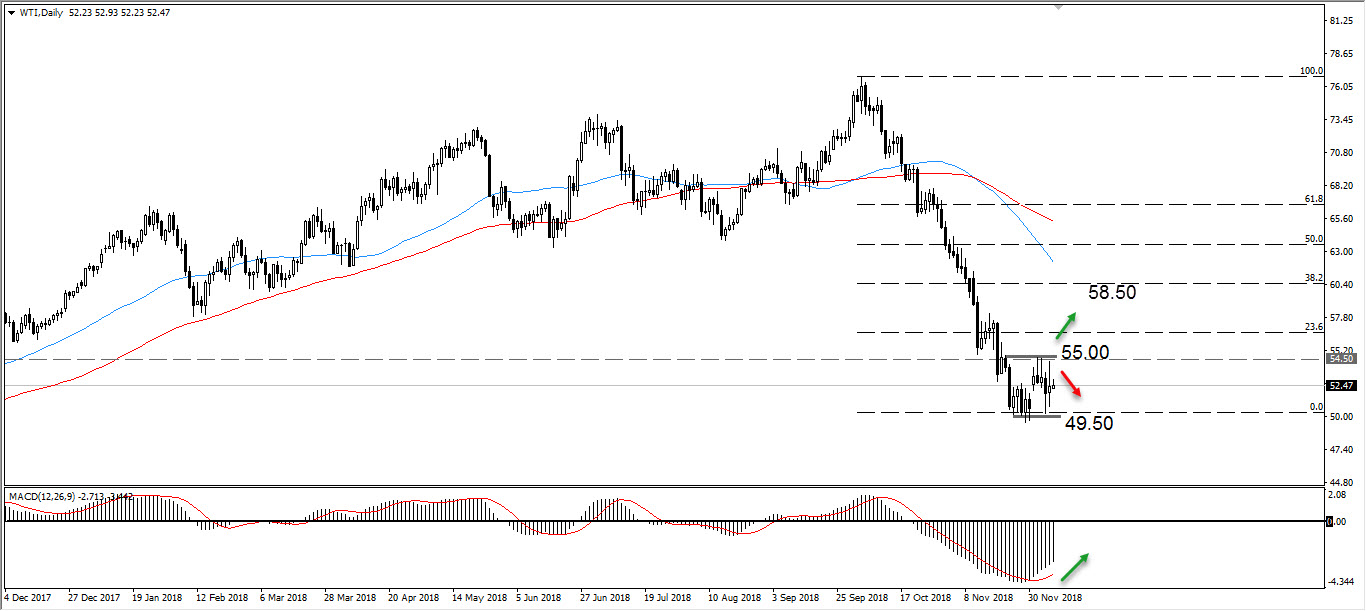
The major support at 50.00 still on hold, which will allow a further rebound with next key resistance at 55 and 58.
Dow Jones
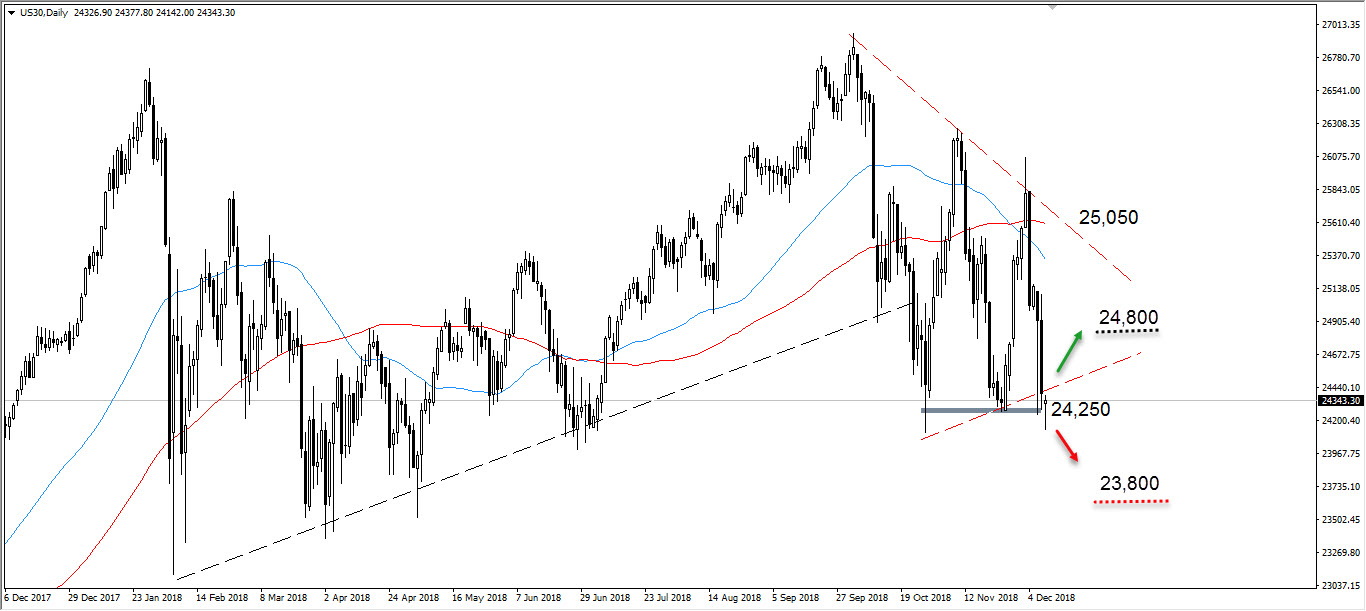
Our bias stays bearish; however, we could see a rebound from the current level toward the resistance which is seen at 24,800. Clear break below 24,150 would enforce a more decline toward 23,800.
GBP/USD Outlook: Pound Dips On Weak GDP Data, Historical House Of Commons Vote On Brexit Deal In Focus
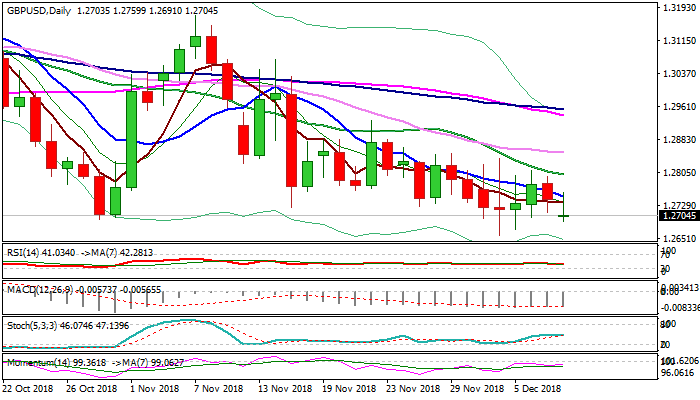
Cable dipped to new session low at 1.2691 and reversed overnight's recovery to 1.2755 after gap-lower opening on Monday and dip to Asian low at 1.2702. UK Q3 GDP data showed that the economy slowed down in three months to October that pushed sterling lower at the beginning of historic week, as the UK parliament is going to vote on Brexit deal. Near-term action remains biased lower as daily techs maintain bearish tone and recovery attempts were repeatedly capped by falling 10SMA. Repeated probes below 1.2695 pivot (30 Oct low) also cracked key support at 1.2661 (2018 low) last week, but without clear break so far. Negative scenario on close below 1.2661 would risk stronger bearish acceleration and could be triggered if the House of Commons votes down the deal. Initial bullish signal could be expected on close above 10SMA that would expose falling 20SMA (1.2800) but confirmation would requires break and close above 30SMA (1.2853).
Res: 1.2750, 1.2800, 1.2839, 1.2853
Sup: 1.2691, 1.2671, 1.2658, 1.2600
Japanese Economy Weak
Japanese economy weak
In its hardest contraction since June 2014, Japan’s economy is facing its second drop since the beginning of the year. Largest contributors to the drop are: the trade war between Washington and Beijing; Typhoon Trami that disrupted production and distribution channels; and a 6.7 earthquake that hit the Northern Island Hokkaido. Given an outlook of a 2.50% decline, Japan’s GDP is worrisome, as Japanese domestic demand dropped 2.20%. Meanwhile, Japan’s current account balance has declined in October, given at 1.3 trillion yen ($ 11.6 billion) and 28% lower than September. The trade deficit has been widened 321.7 billion yen ($ -2.8 billion), the most in 5 months.
In the context of a slowdown in global growth and an ongoing trade war, a Q4 rebound is questionable. Policymakers hope capital expenditures will help the economy rebound, but this has yet to be seen. USD/JPY is currently trading at 112.70 (+0.06% year-to-date), heading higher as safe haven demand builds, approaching 112.80 short-term.
Unhappy Monday
Lots of red in equity markets at the start of the week. Following America’s weak payroll and wage data for November (following weak German GDP and export data), markets have ramped concern over slowing global growth. OPEC’s and Russia’s oil production cuts had limited effect: worry is about demand. Despite fears of inverse yields, US treasury prices dropped. History indicates that two of the last three recession coincided with Fed hiking and inverse yields. A rally in oil prices would give inflation bulls hope that flattening/inverting yields could reverse. Yet real fears that USA’s continued tensions with China – especially following arrest of a top Huawei executive – could trigger Chinese reprisals. Graphic images of French riots reinforce pessimism. Finally, massive event risk is embedded in the Brexit drama, as the UK parliament’s vote is set for tomorrow. Consensus is the Chequers’ plan will be rejected, sending negotiations into absolute chaos.
We are seeing a build-up in long GBP as markets anticipate the least disruptive path toward Brexit. We suggest traders move carefully in GBP ahead of critical vote. Despite the growing weight on equity prices, we suspect a quick fix is possible. A potential US slowdown and volatility in stocks has triggered thinking that hawkish Fed path could be in jeopardy. Further statements regarding policy limits or a dovish Fed December meeting would do wonders for investor sentiment.
The Analytical Overview Of The Main Currency Pairs
The EUR/USD currency pair
Technical indicators of the currency pair:
Prev Open: 1.13687
Open: 1.13907
% chg. over the last day: +0.11
Day's range: 1.13906 – 1.14426
52 wk range: 1.1214 – 1.2557
On Friday the USD weakened against the major currencies. The US published weak labour market reports for November. The yield of the US Treasury obligations keeps lowering, which adds pressure on the US curency. The financial market participants expect the Central Bank to slow the growth of the key interest rate down. The EUR/USD is consolidating at 1.14150-1.14400, you should open positions from these levels.
The Economic News Feed for 10.12.2018:
Job Openings and Labor Turnover Survey (US) – 17:00 (GMT+2)
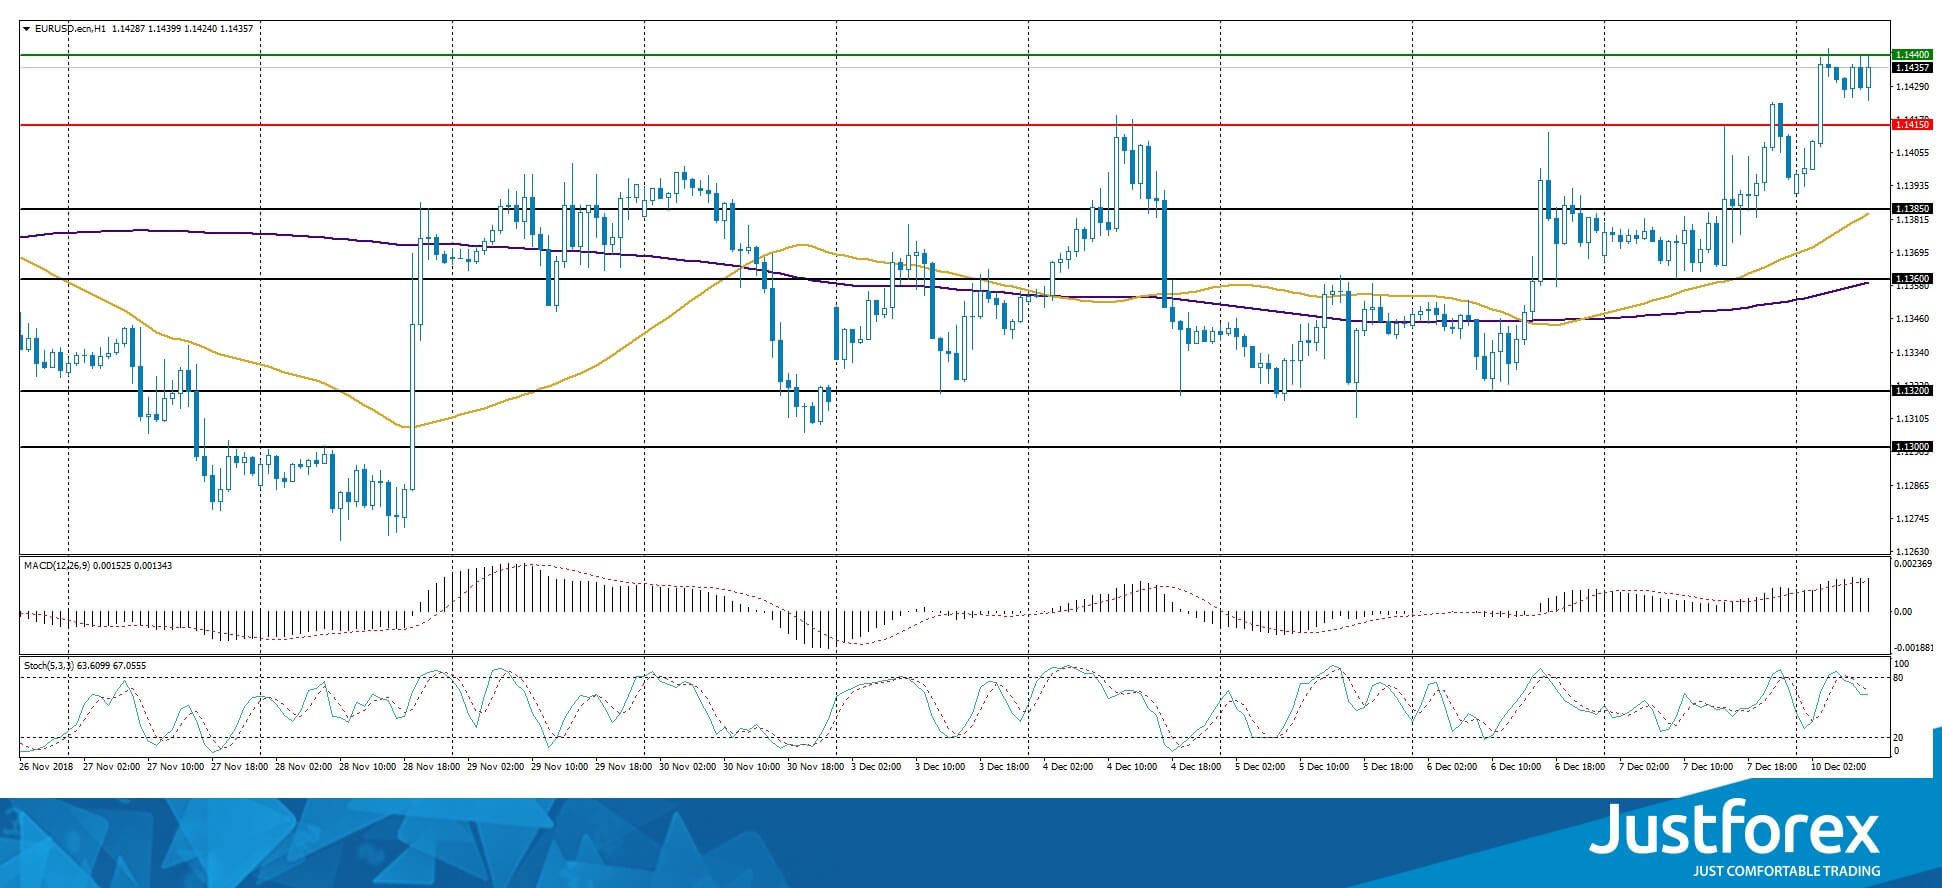
The price fixed above both 50 MA and 200 MA, which indicates the power of the buyers.
The MACD histogram is in the positive zone and above the signal line which gives a signal towards the purchase of EUR/USD.
Stochastic Oscillator is in the neutral zone, the %K line is below the %D line, which indicates a bearish sentiment.
Trading recommendations
Support levels: 1.14150, 1.13850, 1.13600
Resistance levels: 1.14400, 1.14800
If the price fixes above the resistance level of 1.14400, it is necessary to consider buying EUR/USD. The movement is tending to 1.14800-1.15000.
Alternatively, the quotes could descend to 1.13850-1.13600.
The GBP/USD currency pair
Technical indicators of the currency pair:
Prev Open: 1.27748
Open: 1.27022
% chg. over the last day: -0.44
Day's range: 1.27021 – 1.27594
52 wk range: 1.2659 – 1.4378
The technical picture of GBP/USD remains ambiguous. The pound is being traded in a long flat. The event of the week is the voting on the Brexit project, which will happen on December 11. You should keep an eye on it. The key support and resistance levels are 1.27000 and 1.27400. Positions should be opened from these levels.
The Economic News Field for 10.12.2018:
GDP report for the 3rd quarter (UK) – 11:30 (GMT+2:00);
Manufacturing Industry Volume Report (UK) – 11:30 (GMT+2:00).
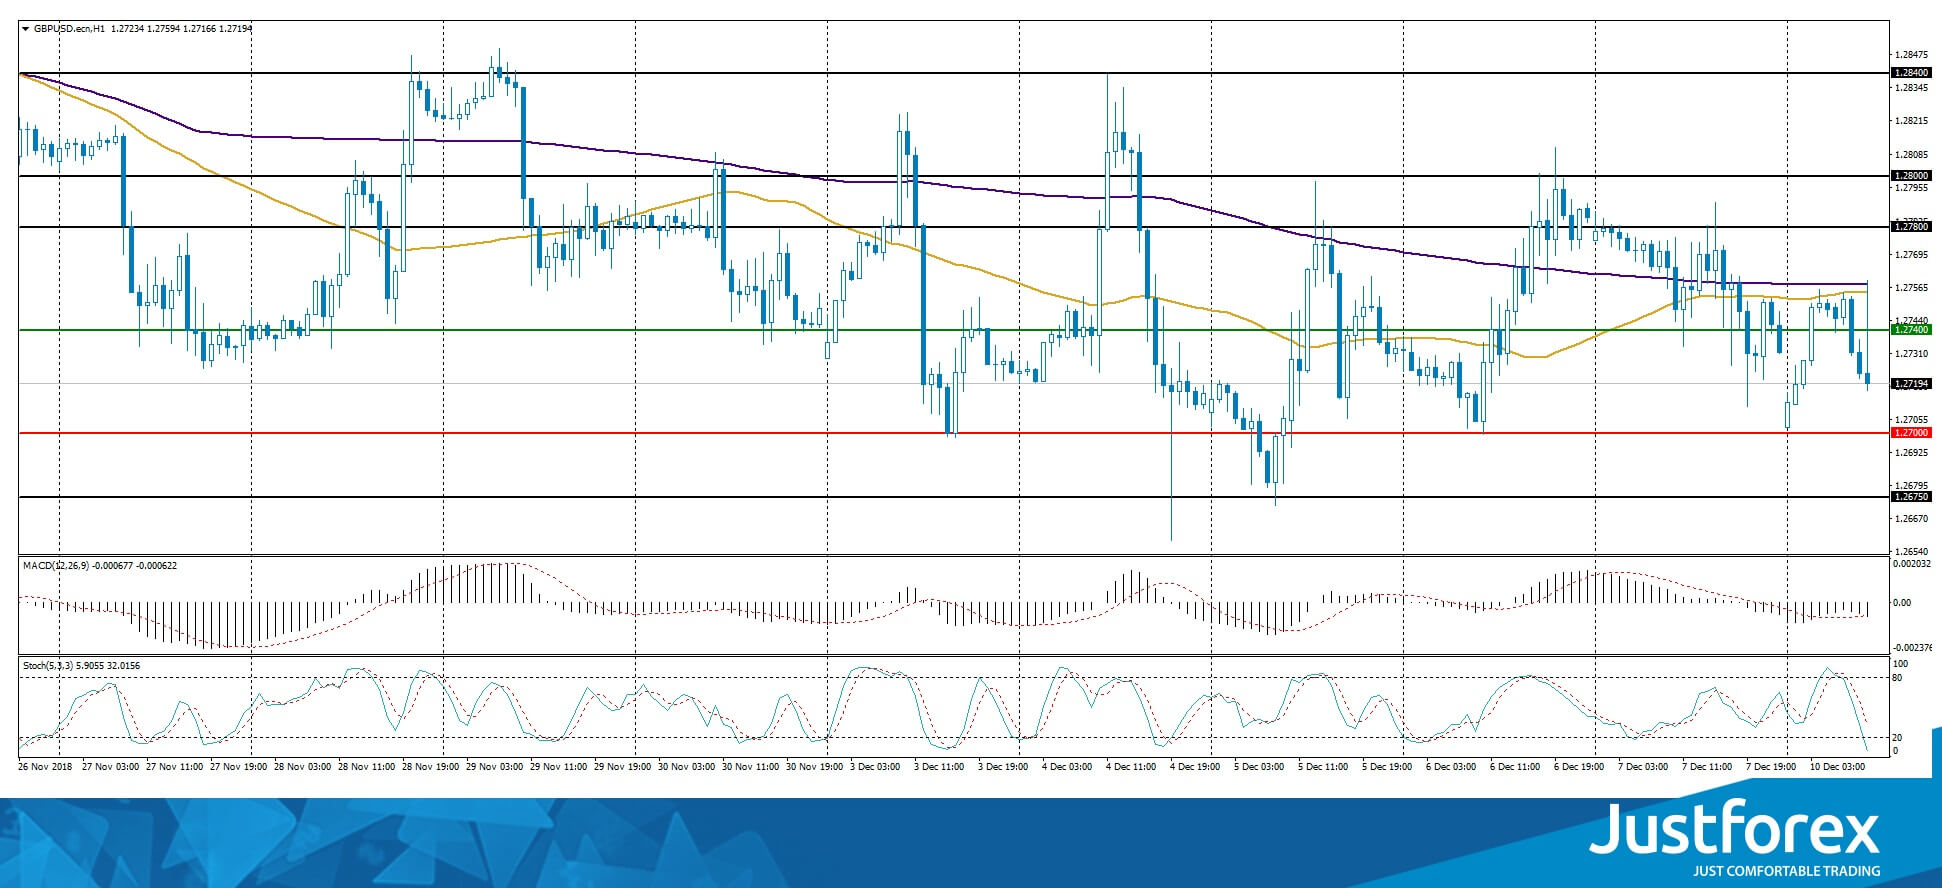
Indicators show the power of the sellers. The price is below 50 MA and 200 MA.
The MACD histogram is in the negative zone and keeps falling, which indicates a strong bearish sentiment.
Stochastic Oscillator is in the neutral zone, the %K line is below the %D line, which points towards the descend of the GBP/USD.
Trading recommendations
Support levels: 1.27000, 1.26750
Resistance levels: 1.27400, 1.27800, 1.28000
If the price fixes below 1.27000, the GBP/USD quotes are expected to fall. The movement is tending to 1.26750-1.26500.
An alternative could be a growth in the GBP/USD currency pair to 1.27800-1.28000.
The USD/CAD currency pair
Technical indicators of the currency pair:
Prev Open: 1.33772
Open: 1.33328
% chg. over the last day: -0.44
Day's range: 1.32929 – 1.33332
52 wk range: 1.2248 – 1.3445
Friday was marked by the aggressive sales of USD/CAD. The demand for CAD grew after the release of the positive labour market report in Canada. The USD/CAD quotes` price lowered by more than 100 pips and updated the local minimums. The quotes are consolidating at 1.32900-1.33300. Positions should be opened from these levels. The USD/CAD quotes can descend further.
At 15:30 (GMT+2:00), Canada will publish the real estate market reports
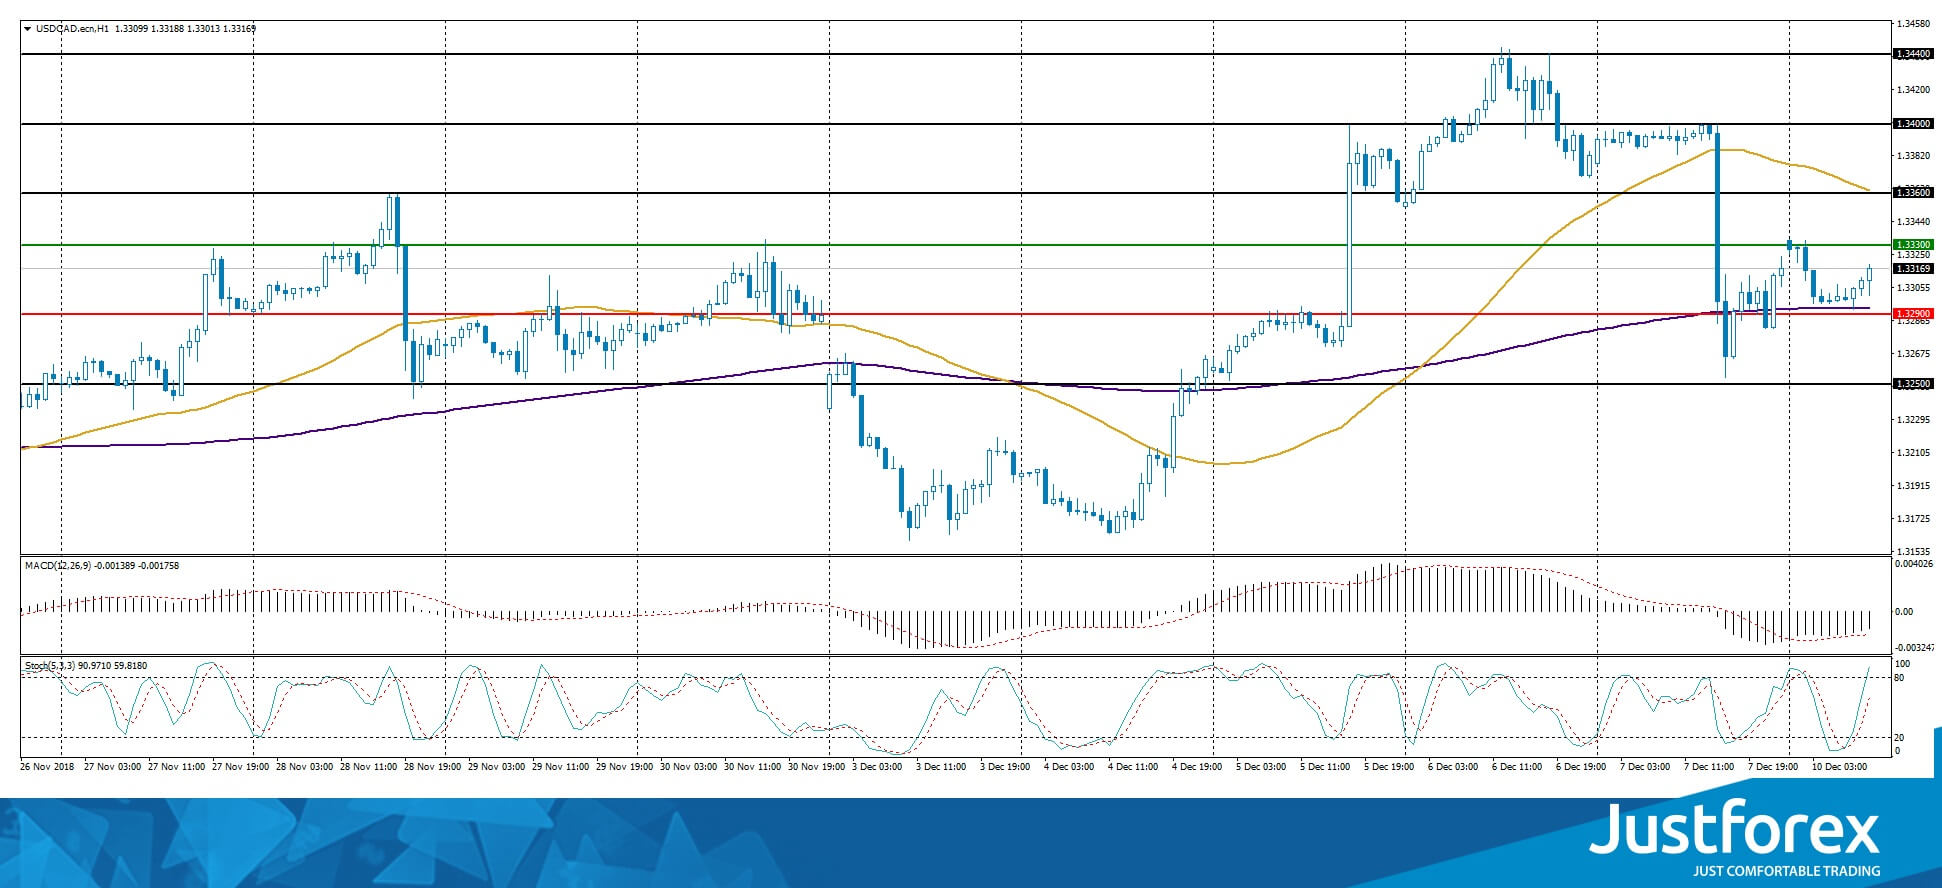
The indicators are ambiguous, the price has fixed between the 50 MA and 200 MA.
The MACD histogram is in the negative zone, the %K line is above the %D line, which points towards the growth of the USD/CAD quotes.
The Stochastic Oscillator is in the neutral zone, the %K line is above the %D line, which points towards the growth of the USD/CAD quotes.
Trading recommendations
Support levels: 1.32900, 1.32500
Resistance levels: 1.33300, 1.33600, 1.34000
If the price fixes below the local support of 1.32900, further descend of the USD/CAD quotes is expected. The movement is tending to 1.32500-1.32300.
Alternative option. If the price fixes above 1.33300, we recommend looking for market entry points to open long positions. The movement is tending to 1.33600-1.33800.
The USD/JPY currency pair
Technical indicators of the currency pair:
Prev Open: 112.649
Open: 112.613
% chg. over the last day: -0.05
Day's range: 112.240 – 112.739
52 wk range: 104.56 – 114.56
The USD/JPY technical picture points toward a possible growth. The technical instrument is showing a classic reversal figure. The local support and resistance levels are 112.600 and 112.850. The weak GDP report from Japan adds pressure on the yen. You should open positions from the key levels.
The GDP growth in Japan slowed down by 0.6% in the third quarter. Experts expected it to slow down by 0.5%.
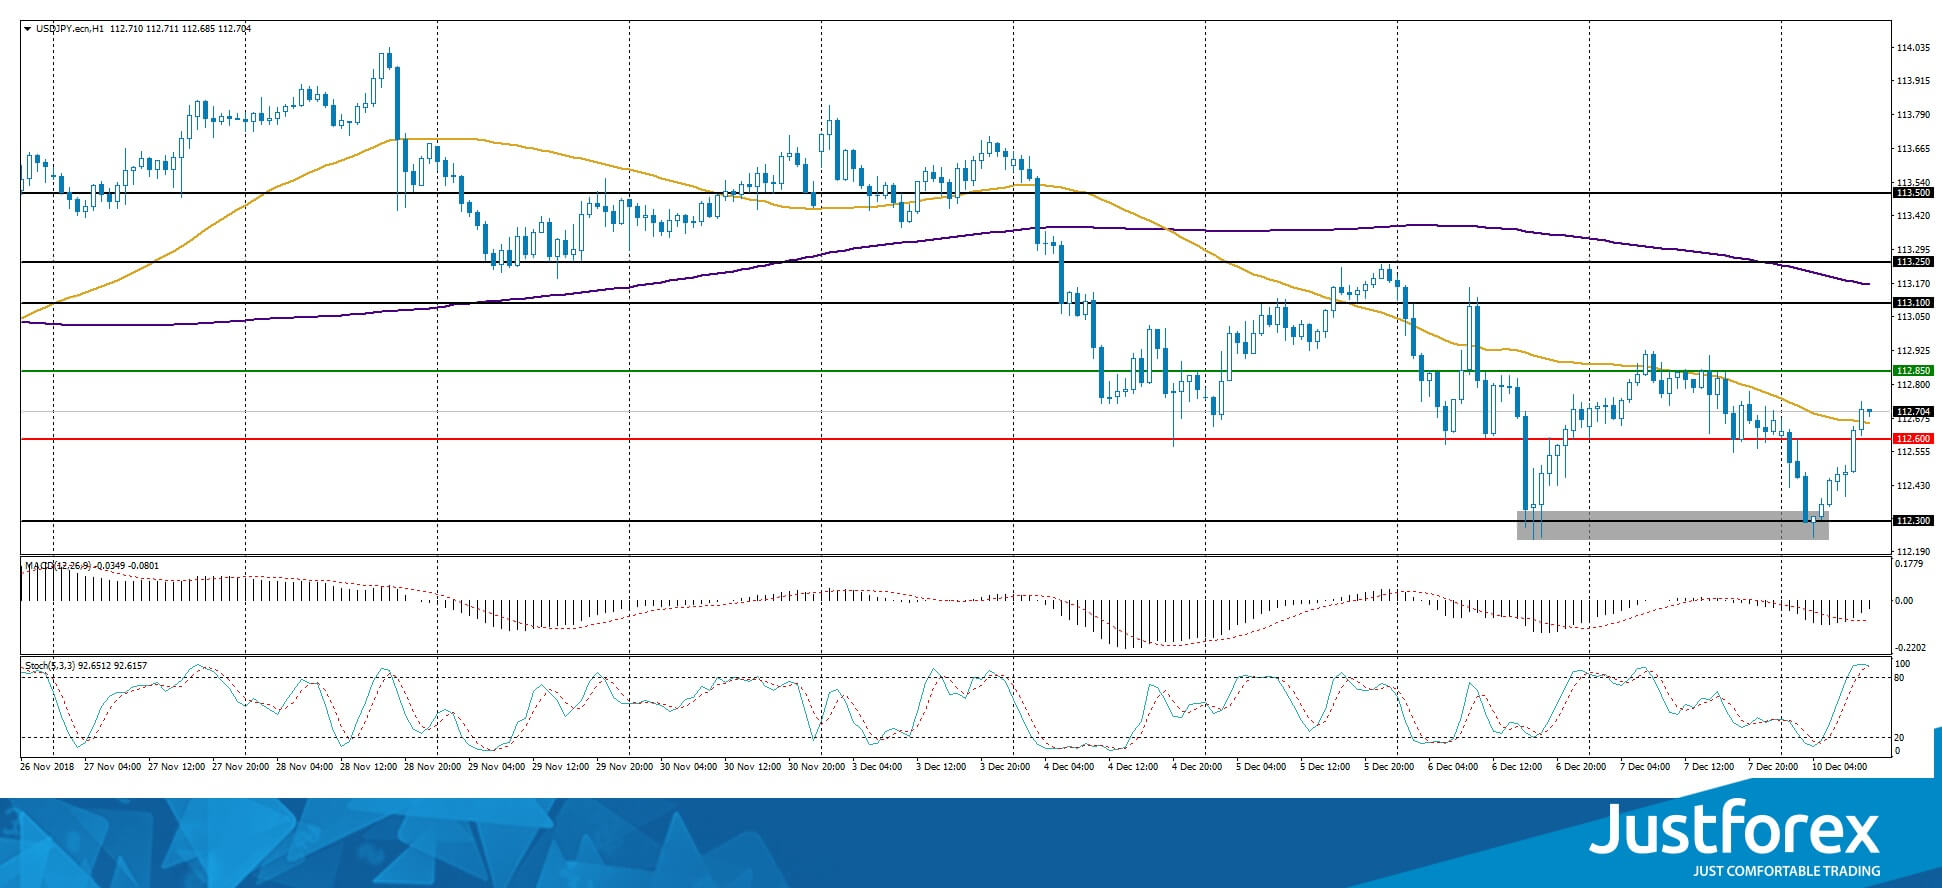
Indicators do not provide precise data, the price has crossed the 50 MA.
The MACD histogram is in the negative zone but above the signal line, which gives a weak signal to sell USD/JPY.
The Stochastic Oscillator is in the overbought zone, the %K line is crossing the %D line. There are no signals at the moment.
Trading recommendations
Support levels: 112.600, 112.300
Resistance levels: 112.850, 113.100, 113.250
If the price fixes above the support level of 112.850, it is necessary to consider buying USD/JPY. The movement is tending to 113.100-113.250.
An alternative could be the descend of the USD/JPY quotes to 112.400-112.200.
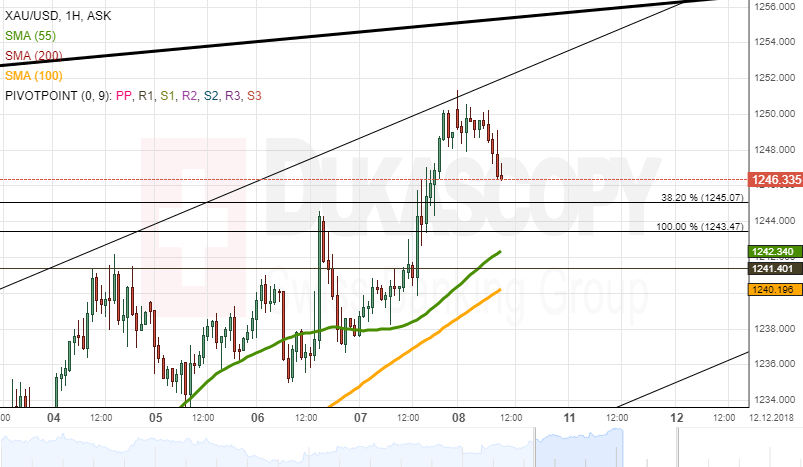
USD/JPY Outlook: Shows Strong Hesitation At Key Fibo / Cloud Base 112.45 Support
The dollar regained traction and bounced above daily cloud (112.67/112.46) in European trading on Monday, after weak opening and spike to 112.14 in Asia.
Dip probed below daily cloud base and was contained by 100SMA (112.26), with subsequent bounce marking the fourth failure to clearly break below 112.45 pivot (Fibo 61.8% of 111.37/114.20 / daily cloud base).
This could be a bullish signal, which needs close above daily cloud as minimum requirement to keep downside risk sidelined.
Further advance would need to clear a cluster of daily MA’s between 113.05 and 113.24, to neutralize bears and generate stronger bullish signal.
The dollar remains bid on rising tensions between the US and China, with limited impact on weaker than expected US jobs data.
Long tails on today’s / last Thursday’s daily candles support the notion, however, caution is required as momentum on daily chart is weakening and overall structure is bearish.
Negative scenario on close below 112.45 pivot requires extension and close below 100SMA for confirmation, which would unmask initial support at 112.04 (Fibo 76.4% and risk extension towards 111.37 (26 Oct trough).
Res: 112.79, 113.05, 113.24, 113.65
Sup: 112.67, 112.45, 112.26, 112.04
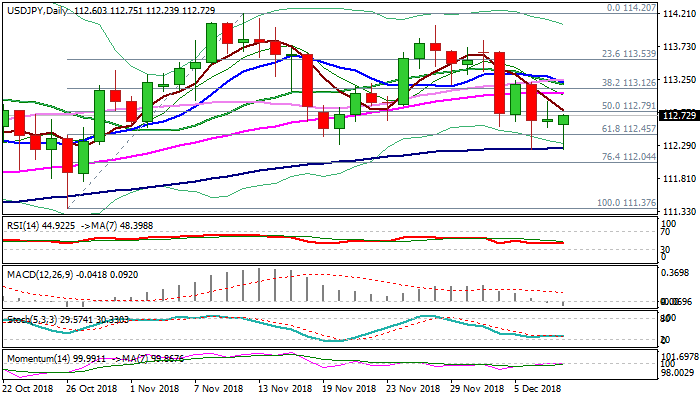
EUR/USD Analysis: Breaks Dominant Resistance
During the late part of Friday's trading session the EUR/USD managed to break the resistance of the dominant descending channel pattern at the 1.1400 level. The event increased volatility, which lasted into the second half of Monday's trading.
The surge ended after meeting the weekly R1 at 1.1430. Due to that reason a decline began, which is expected to decline below the 1.1400 mark. The reason for that is the fact that the pair has no technical support as low as the 1.1380 level.
On the other hand, the volatility is set to remain high and direction unclear until the UK parliament votes on the Brexit deal.
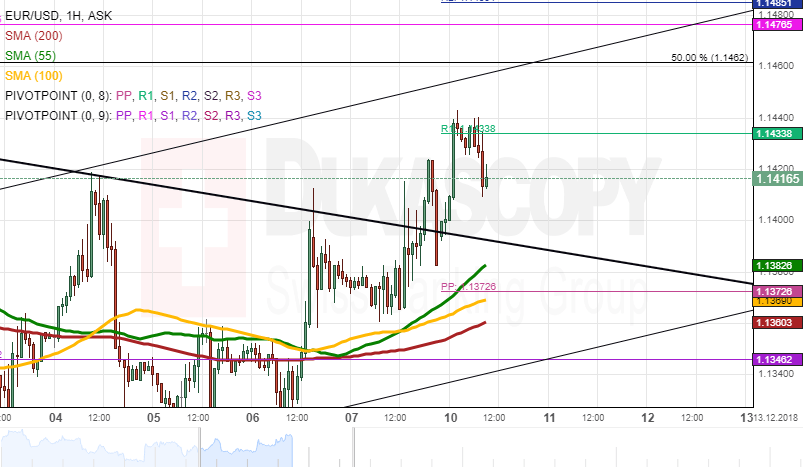
GBP/USD Analysis: Declines Prior To Brexit Vote
The volatility of the GBP/USD has once more increased, as the UK Parliament is set to vote on the Brexit deal that Theresa May has agreed upon with the European Union.
Meanwhile, from a technical analysis perspective the currency exchange rate is expected to decline, as it has no technical support as low as the 1.2680 mark. At that level the lower trend line of a horizontal pattern is located at.
Although, traders can be sure that during the Parliament debate and the vote, the rate will ignore all technical indicators, as fundamental changes of this scale overpower everything.
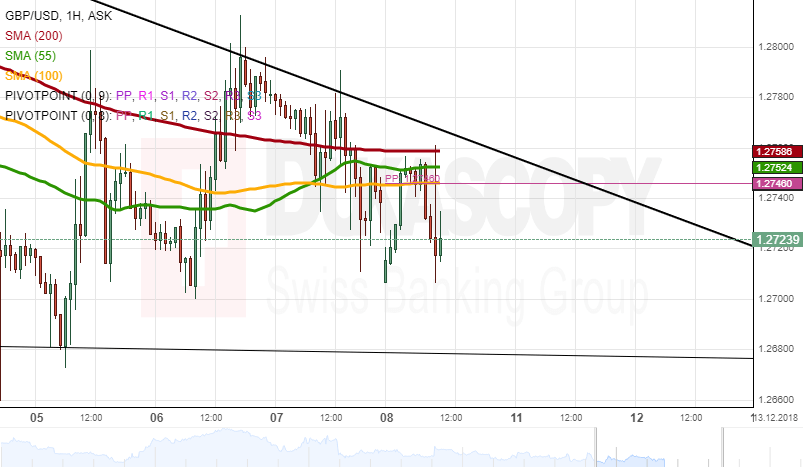
Gold Analysis: Reaches Above 1,250.00
After reaching above the 1,250.00 level, the yellow metal's price was consolidating its gains and retreated on Monday. Namely, the rate encountered the upper trend line of an ascending pattern and began a retreat.
The decline is expected to reach down to the support of the 1,245.07 level where a 38.20% Fibonacci retracement level is located at. As the rate meets this level, the 55-hour simple moving average should approach and provide additional support. Due to that support the surge is expected to resume.
Although, note that the simple moving average might take longer to reach the commodity price than one day.
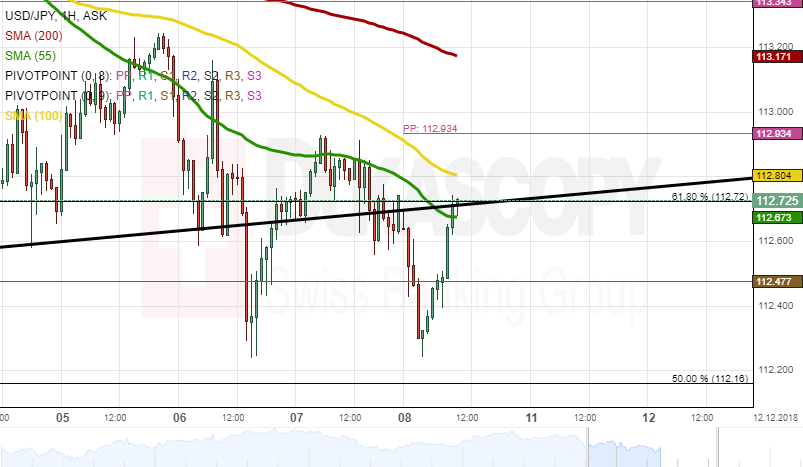
USD/JPY Analysis: Stands At Significant Level At 112.70
The USD/JPY surged on Monday up to the resistance levels near the 112.70 mark. In general, the rate has two possible scenarios.
The pair could break through the resistance levels and surge to the 100-hour simple moving average at the 112.80 level and afterwards pass it to surge to the weekly pivot point at 112.93.
On the other hand the rate might bounce off the resistance cluster and decline down to the 112.50 mark. Most likely, the pair will decline, as a decline would be consistent with the larger scale charts.
GBP/AUD 4H Chart: Possible Breakout
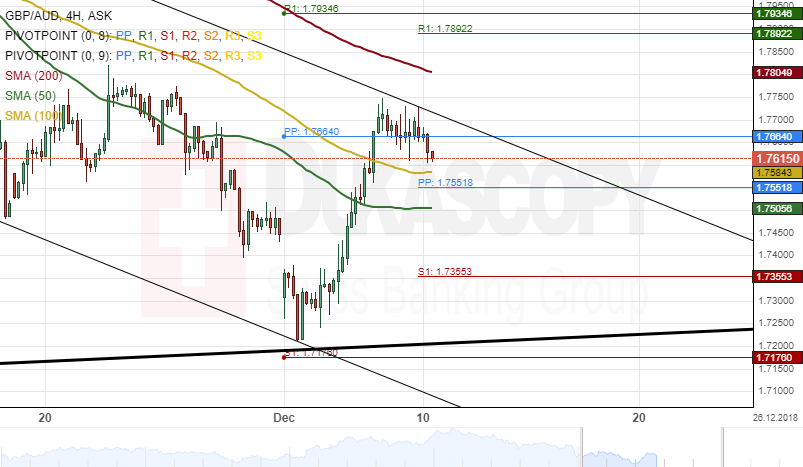
The Pound Sterling reversed from the lower boundary of a dominant ascending channel at 1.7200 on December 3 and started gaining strength against the Australian Dollar.
The currency pair was trading near the upper border of a medium-term descending channel pattern at 1.7700 during the morning hours of Monday's trading session.
If the exchange rate breaks the descending channel pattern, it will aim at a resistance cluster formed by the weekly and the monthly PPs near the 1.7892 regions.
However, it is important to note that the political situation in the United Kingdom might play a significant roll in the positioning of the currency exchange rate during this week trading sessions.