Sample Category Title
The USD Index Lowered
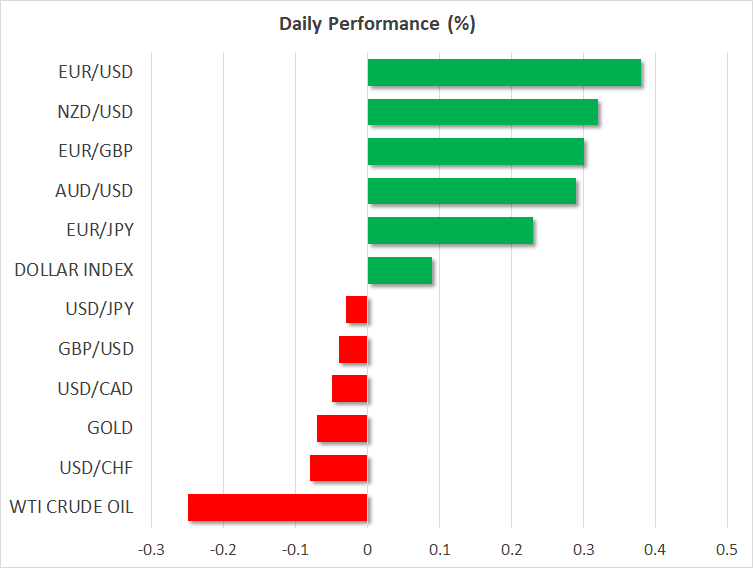
USD weakened on Friday against the basket of other currencies. Ambiguous economic reports were published in the US. The number of employees in the Non-Farm Sector shortened to 155K while the experts were expecting 200K. The reports from October were also re-reviewed and closed at 237K instead of 250K. The unemployment level remained at 3.7%. Also on Friday, the head of Federal Reserve Jerome Powell announced that the key interest rate is close to the neutral level. Investors are expecting the US to slow the growth of the key interest rate down. The USD index (#DX) closed in the red (-0.30%).
Canada published positive Labour Market reports on Friday. The number of employed citizens grew by 94K instead of 10.3K while the unemployment level shrank to 5.6% instead of 5.8%. Today during the Asian trading session Japan published rather weak GDP reports. The financial market participants expect important reports from the UK and the US.
The main event this week will be the British Parliament voting on the Brexit plan presented by Theresa May. The voting is scheduled to commence tomorrow, on December, 11. If the plan does not receive their support, all bets are off – anything can happen, including a second Brexit referendum. Keep an eye on the relevant data regarding this situation.
The prices on oil stabilized. The WTI futures are testing the 52.50 USD/barrel.
Market Indicators
- On Friday the US stock market was marked by aggressive sell-off: #SPY (-2,32%), #DIA (-2,17%), #QQQ (-3,30%).
- The US Treasury bonds 10-year yield keeps lowering and is currently at 2.85-2.86%.
The Economic News Feed for 10.12.2018:
- GDP report (UK) – 11:30 (GMT+2:00);
- Manufacturing Industry Volume report (UK) – 11:30 (GMT+2:00);
- Job Openings and Labor Turnover Survey (US) – 17:00 (GMT+2:00).
Gold Falls Following Rebound To 5-Month High, Bullish In Medium Term
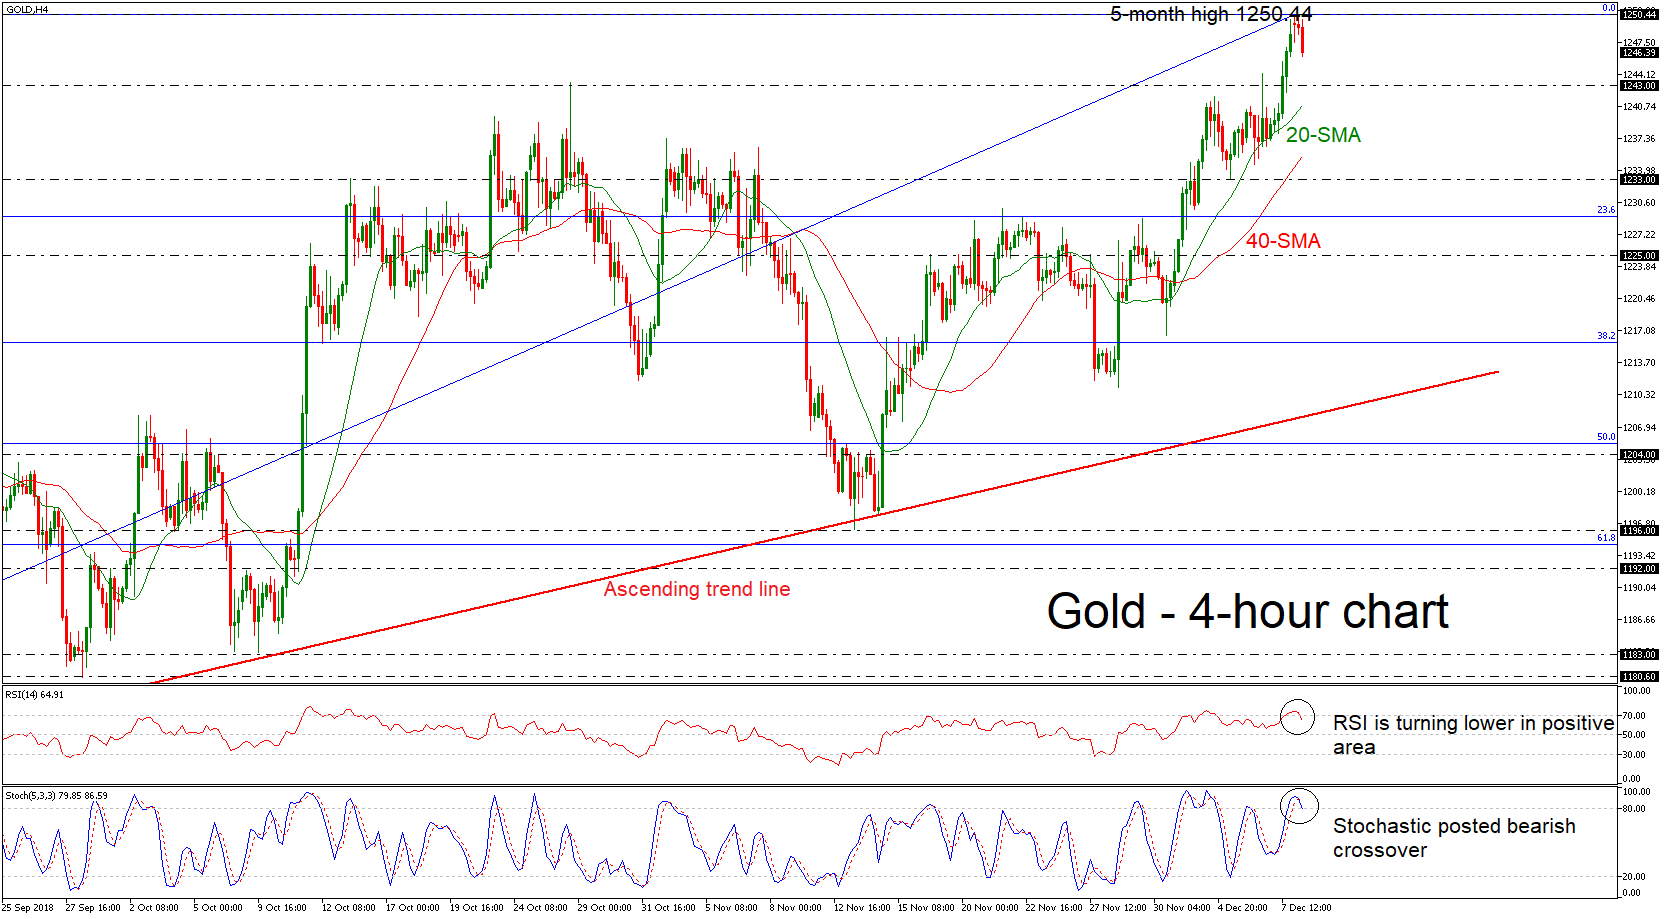
Gold prices pared some gains on Monday, following the new five-month high of 1250.44 that was achieved in the preceding week. The yellow metal holds above the 20- and 40-simple moving averages (SMAs) in the 4-hour chart, however, the momentum indicators are turning lower. The RSI indicator is pointing down after hitting the overbought zone, while the %K line of the stochastic oscillator posted a bearish crossover with the %D line.
A bearish correction would drive prices until the 1243 support level, taken from the high on October 26. Then the price could challenge the 20- and the 40-SMA at 1240.85 and 1235.35 respectively. If the market fails to hold above these levels, the yellow metal could meet support at 1233, where it bottomed on December 5.
On the flipside, more upside movements could send prices towards the immediate resistance of the five-month high of 1250.44, while even higher the area around 1260.00 – 1265.60 could attract attention as well.
Concluding, gold prices remain above the rising trend line, which has been holding since August 16 and is trying to post significant gains in the short-term.
Trade Fears Heighten As Huawei Story Complicates, Brexit In Center Stage
- Stocks in the red as Huawei story ramps up trade concerns
- Pound on the back foot ahead of GDP growth data; May could delay Brexit vote in Parliament
- OPEC-Non-Opec members set supply cut but global growth concerns weigh
Huawei story continues, pushing stocks lower
On Sunday, the Chinese government summoned the American ambassador in protest to the arrest of Huawei’s Chief Financial Officer in Canada on December 1, ramping up tensions between Washington and Beijing. Stocks in Asia opened in the red on Monday, with Japanese ones losing the most as an unexpected downward revision in Japanese Q3 GDP growth readings caused sales from funds in the market. Despite its safe-haven feature, the dollar was also trading lower by 0.22% against the yen after Friday’s disappointing Jobs report, which indicated a weaker-than-expected rise in nonfarm payrolls, added further evidence that the Fed might not rush to raise interest rates next year; growth in average hourly earnings stood flat on a yearly basis but in monthly terms it appeared softer. Given the inflamed trade turmoil and worries that monetary tightening in the US will take a pause in 2019, the dollar might face more pressure in coming months. Wall street is on track to open 0.50% lower later today according to US stock futures.
Meanwhile in China, the surprising pullback in consumer and producer prices on Sunday, reflected reluctance from both consumers and businesses to spend,and reduced confidence that the US-Sino trade dispute could end sooner than later. The latter was also echoed by the US Trade Representative, who said yesterday that there is a hard deadline in March and the US President is not planning to delay tariffs on Chinese products beyond that day.
Pound awaits GDP growth data for support but Brexit in the center stage
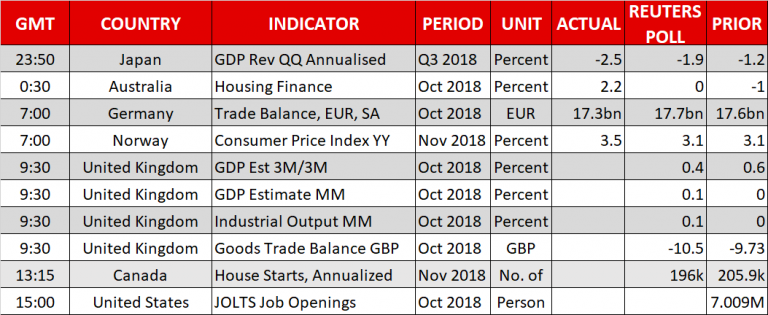
While investors are fully concentrated on Brexit, eagerly awaiting a negative vote on May’s Brexit plan at the Parliament on Tuesday, the National Bureau of Statistics is expected to say later today that the British economy has slowed down in the three months to October compared to the previous three-month period, from 0.6% to 0.4%. On a yearly basis, GDP growth is anticipated to have ticked up from 1.5% in September to 1.6% but traders will likely remain cautious and show patience instead until the Brexit issue gets resolved. Yet, chances for a solution are currently minimal as divisions within the UK’s political environment about how Brexit should happen threaten to humiliate the British Prime Minister on Tuesday and destroy her political career. In an attempt to avoid these negative consequences, the UK leader could attempt to postpone Tuesday’s Brexit vote today and head to the EU summit on Thursday with scope to seek for some kind of compromise from EU leaders. In FX markets, the pound is consolidating last week’s losses against the dollar around 1.2727, while versus the euro, the currency is facing strong pressure today, falling near to two-month lows.
OPEC agrees production cut levels
After a tumultuous meeting on Thursday, OPEC and other no-OPEC members including the heavyweight Russia agreed to cut production by 1.2 million barrels per day from January (measured against October 2018 levels), with an 800,000 bpd reduction coming from the former and 400,000 bpd decline planned from the latter. The London-based Brent crude closed 2.60% higher on Friday and continued to gain today, last seen around $61.80/barrel (+0.21%). WTI crude though failed to extend upside, reversing back to $52.42 (-0.53%) as disappointing data releases out of China and Japan as well as trade conflicts between Washington and Beijing signal a growth slowdown in global economy.
Other highlights
In other events of interest, Eurozone Sentix investor confidence could affect the euro at 0930 GMT, with analysts anticipating the measure to slowdown for the fourth consecutive month, while political risks in Italy and in France are likely to keep buying interest subdued.
In the US, the calendar features JOLTs Job openings at 1500 GMT, whilst in the neighbor Canada, building permits at 1330 GMT could provide support to the loonie which rallied significantly on Friday in the wake of an upbeat employment report.
Elsewhere, kiwi traders will likley pay attention to electronic card retail sales out of New Zealand at 2145 GMT.
Worst December For Markets In 16 Years
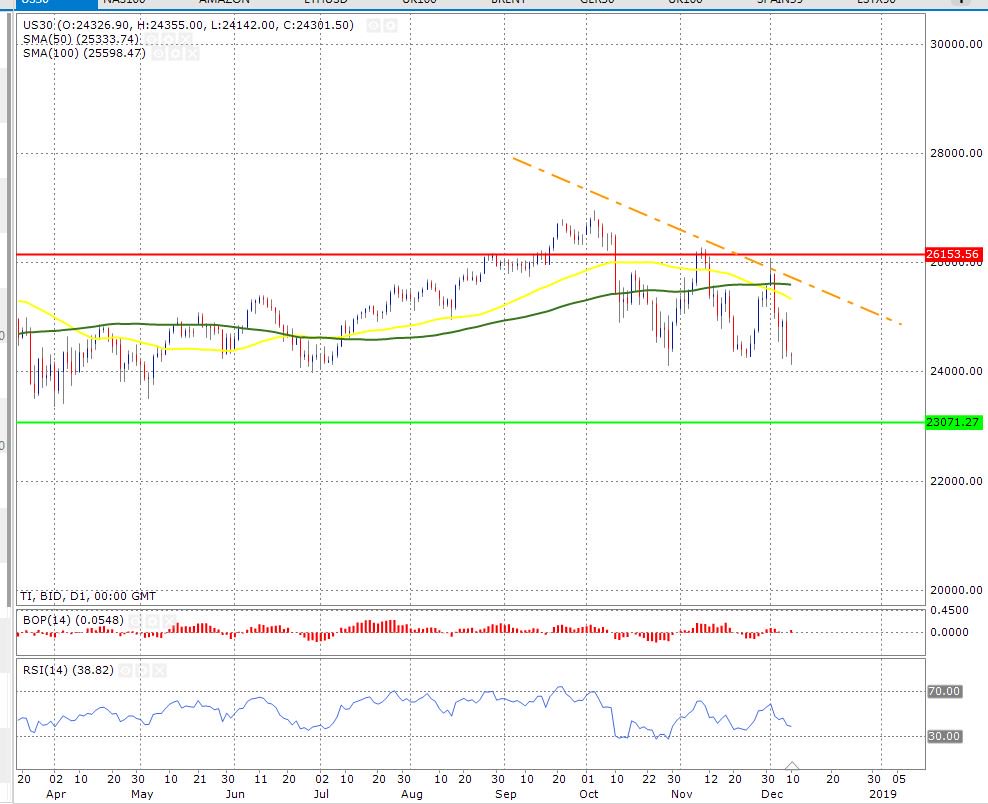
The Dow Jones index is trading in a downtrend on a daily time frame. The confirmation of this comes from the fact that the price is trading below the downward trend line shown in orange colour. The fact that the 50-day moving average (shown in yellow) is trading below the 100-day moving average (shown in green) further strengthens the case for the bears.
The green horizontal line shows the support zone and the red solid horizontal line shows the resistance zone
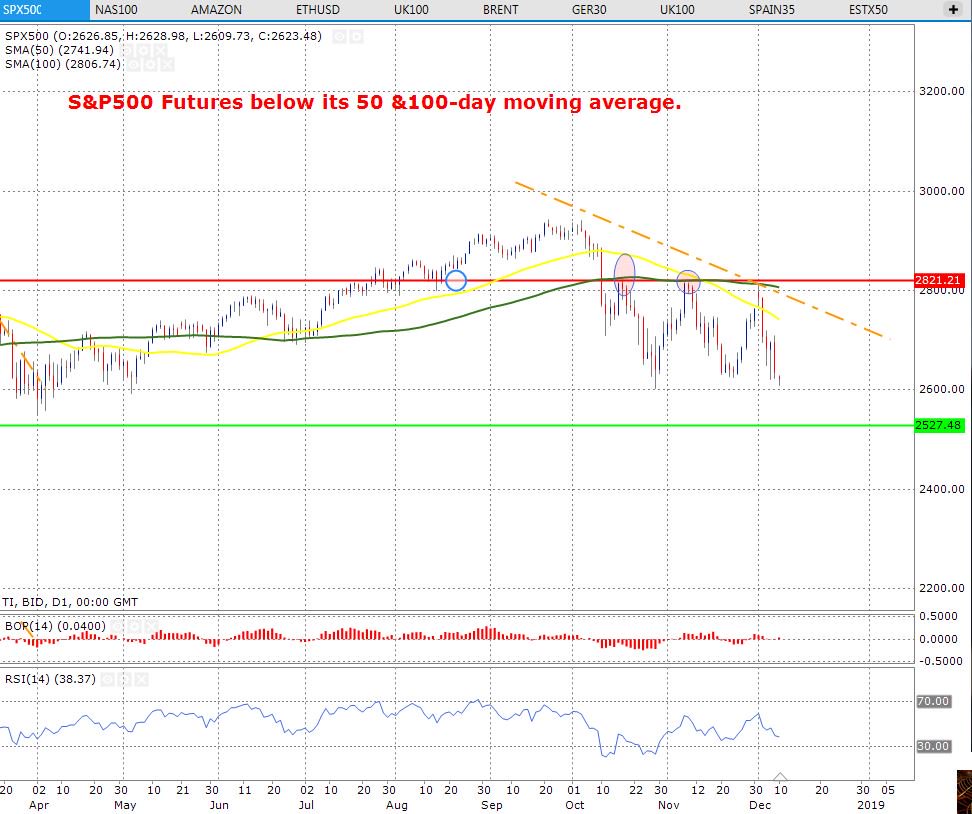
The S&P500 index has formed triple top shown by three circles on the chart below. The triple top is a clear indicator that the price doesn’t have the bull momentum behind it. Simply put, there are higher chances the price may break below the 2600 mark and it may actually touch the support shown on the chart below. The RSI isn't giving any bullish as well so the overall sentiment is still negative
The green horizontal line shows the support zone and the red solid horizontal line shows the resistance zone
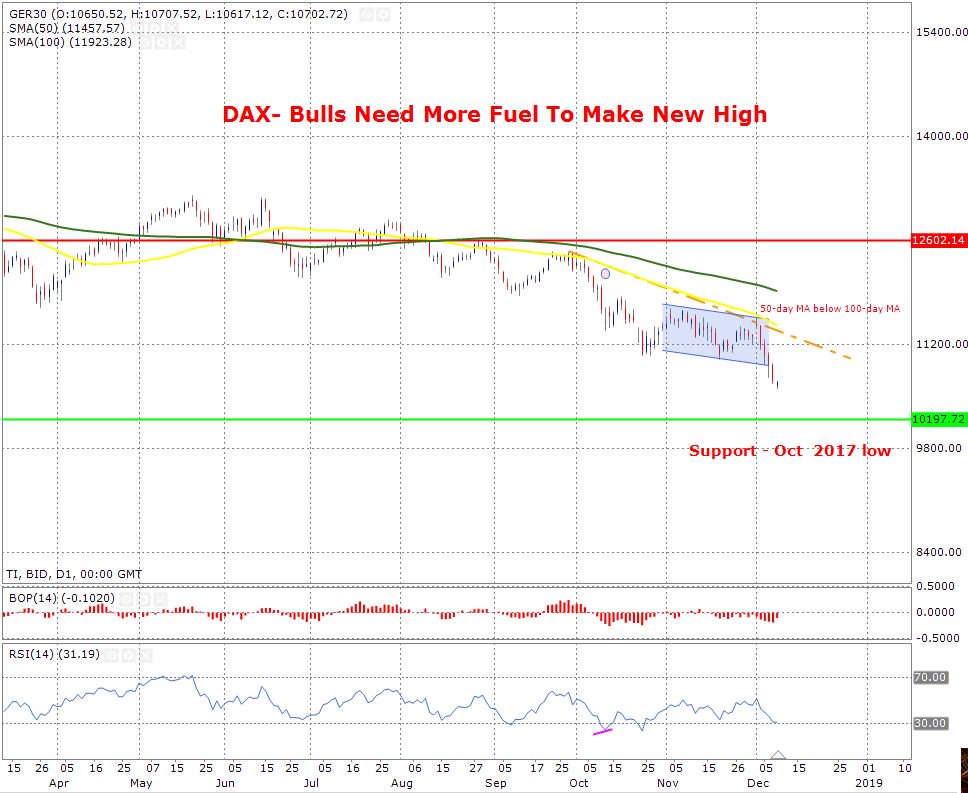
The price of the Dax index has broken out of its current consolidation zone to the downside. The DAX index is trading in a solid downtrend and the confirmation of this comes from the fact the price is trading below the moving averages. The 50-day moving average is shown in yellow and the 100-day moving average is shown in green. The RSI is near oversold zone and it is likely that we may see some new buying pressure and this is because any reading near 30 or below is considered an opportunity to buy.
The green horizontal line shows the support zone and the red solid horizontal line shows the resistance zone
US: Economy Set To Remain Strong In 2019
- GDP growth is set to remain above potential in 2019, as fiscal policy continues to be expansionary and optimism is high. The risk of a recession is higher in 2020, but predicting the timing is difficult.
- US government debt is on an increasing path due to Trumponomics, which is unsustainable in the long run.
- Core inflation is set to move slightly higher but it is a gradual process.
- The Federal Reserve will continue to raise rates, but we still expect EUR/USD to move higher in 2019.
Next downturn unlikely in 2019
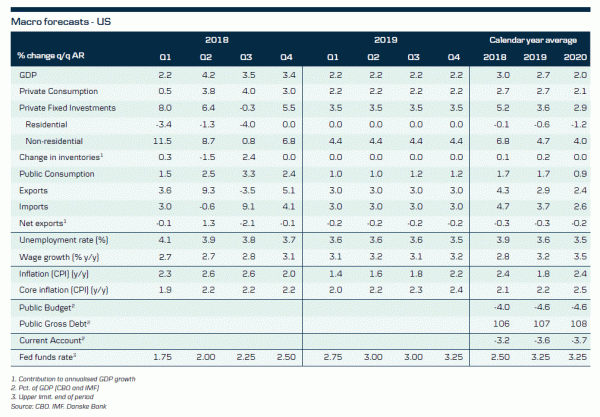
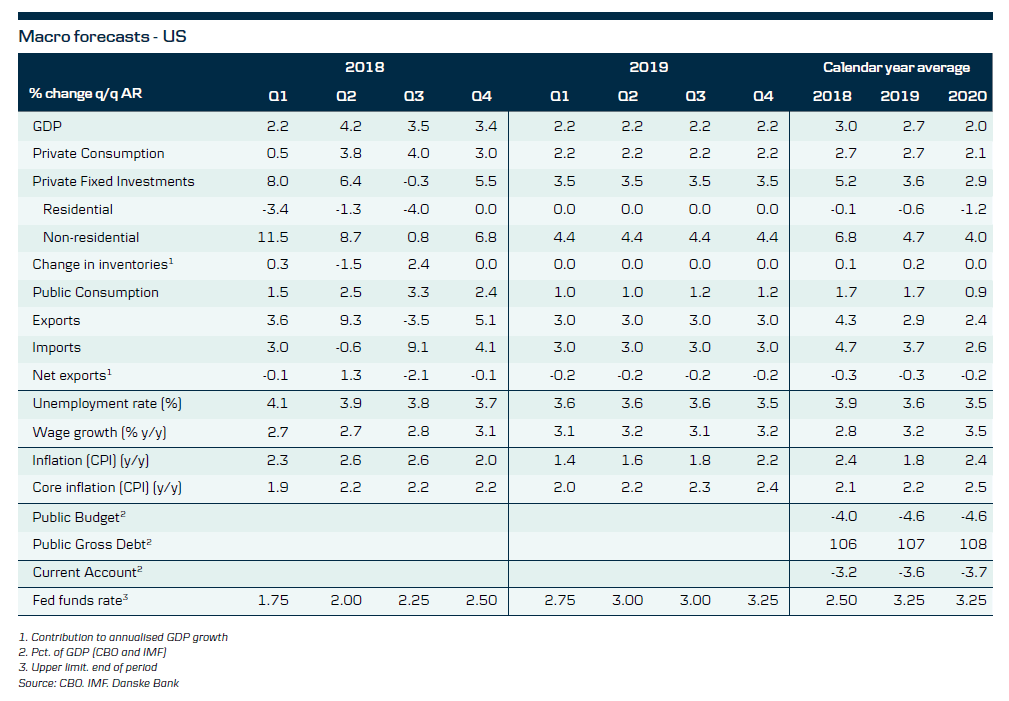
While the rest of the world has slowed, US growth has been strong with GDP growth in the range 3.5%-4.00% q/q annualised in the past two quarters and GDP growth this year is probably set to end at 3.0% y/y. The main difference between the US and everyone else is that fiscal policy is very expansionary due to Trump’s tax cuts and higher fiscal spending. In the fiscal year 2018 (covering Q4 17 to Q3 18), the CBO estimates legislative changes increased the fiscal deficit by 1.4% of GDP without taking into account the impact on the economy.
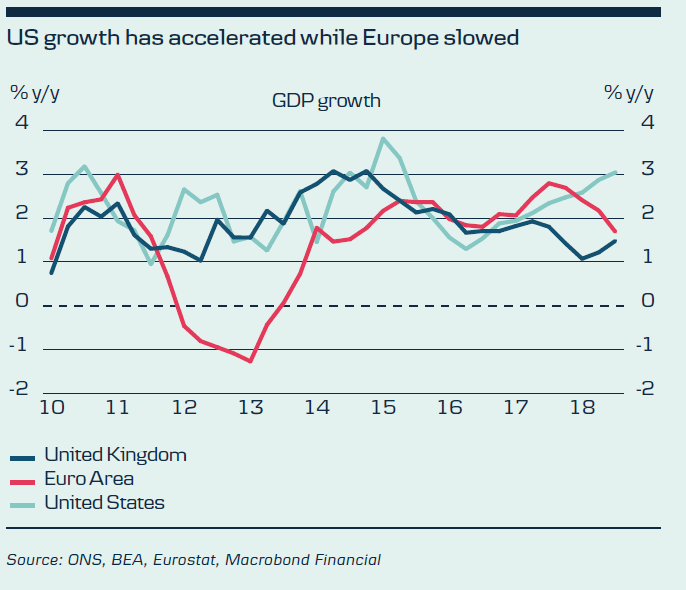
As the current expansion will soon be the longest in US history, many are asking themselves, when does the next recession hit? Not least with the flattening of the US yield curve, which is considered a reliable recession indicator. We think it is important to remember that expansion does not die of old age, meaning that just because the expansion has lasted a long time, a crisis does not have to be just around the corner.
Something needs to go wrong for the economy to turn around. We are having a hard time seeing a downturn in 2019, as optimism is still high and fiscal policy remains expansionary. The CBO estimates legislative changes add an additional 0.9% of GDP to the deficit during the fiscal year 2019 (covering Q4 18 to Q3 19), so while the fiscal boost has declined, it is still considerable.
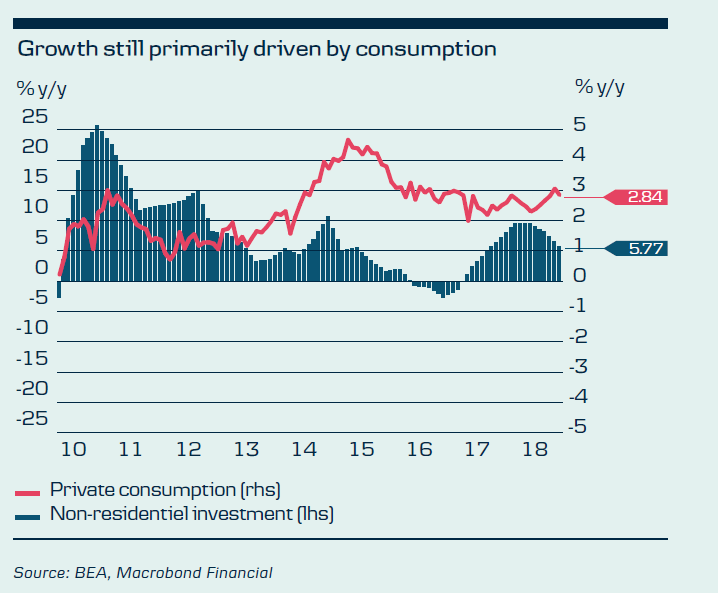
We are more concerned about 2020, when the probability of a recession is higher, as the Fed continues to raise rates further and fiscal policy is no longer expansionary (the CBO estimates it may contract 0.5% of GDP). Other risks to the outlook are the ongoing trade war with China and the housing market, which seems to be cooling down following higher mortgage rates. We forecast GDP growth will slow over the forecast horizon. We expect quarterly GDP growth to slow to 2.2% q/q AR in 2019 and back to the range of potential growth 1.75%-2.00% in 2020. Calling the precise timing of a recession is one of the most difficult things to do, so we will abstain from that but just repeat that the risks are bigger in 2020 than in 2019.
Finally stronger wage growth
Jobs growth has been strong in 2018 with jobs growth slightly above 200,000. Many indicators suggest there is not much, if any, slack left in the labour market and that some problems are supply side issues like mismatch problems between demand for and supply of skills. We expect jobs growth will slow, as labour becomes increasingly scare, but productivity growth will probably still hover around 1%.
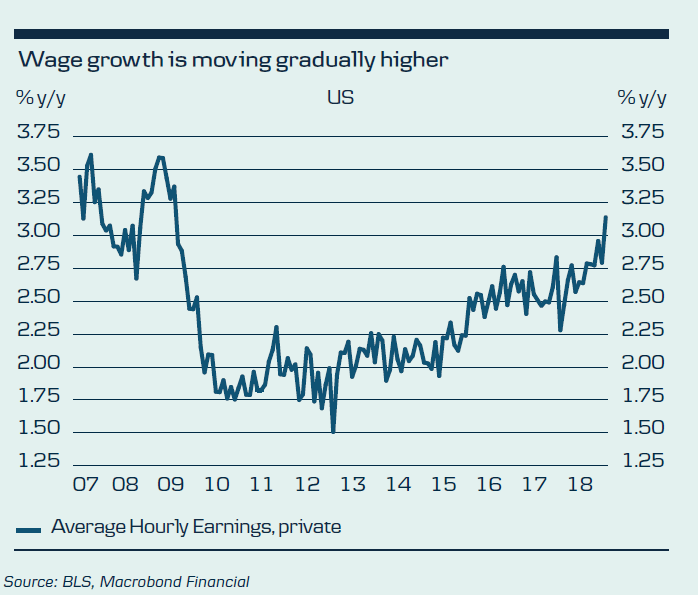
It has been a puzzle why wage growth has been stubbornly low in this expansion but there are signs that it has started increasing – perhaps the Phillips curve is alive after all. Wage growth is right now at the highest in this cycle and we expect it will continue to move gradually higher.
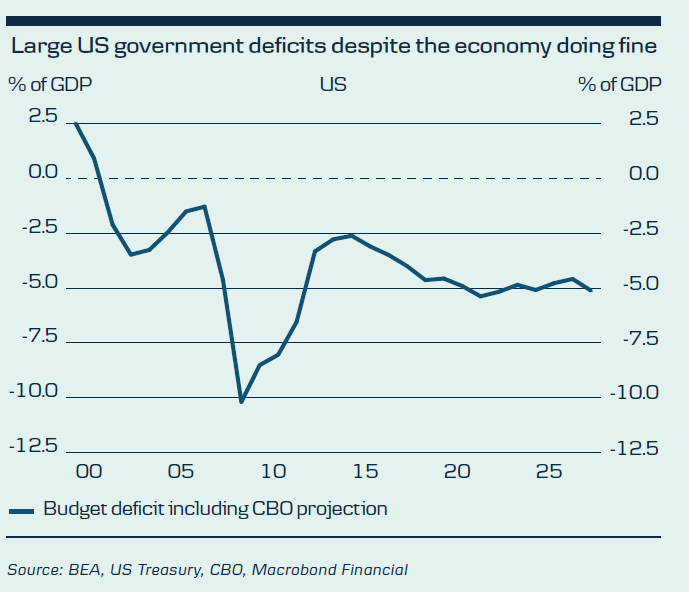
Large deficits due to tax cuts and more spending US government deficits are increasing due to the combination of deficit-financed tax cuts and higher budget spending caps, meaning a higher issuance of US Treasuries in coming years. The US Congressional Budget Office (CBO) estimates US government public debt will increase to 96% of GDP over the next 10 years on the back of deficits in the range 4-6% of GDP. Debt may even move higher if the politicians decide to extend some of the temporary elements in the budget and tax reform (or make them permanent). CRFB previously estimated government public debt may be as high as 110% in 10 yearss. Markets do not seem worried at the moment, as the low rates mean interest payments are still low but this may change, especially when the economy falls into a recession next time. Here deficits may even exceed what we saw during the financial crisis, as the economic policy has increased structural government deficits.
Inflation remains in control
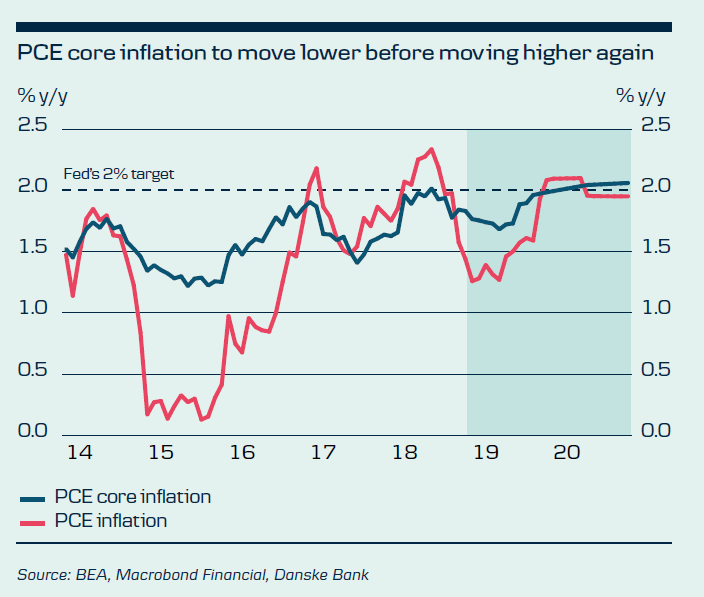
While some had feared core inflation would accelerate this year, it has not materialised yet, in line with our expectation that higher core inflation is mostly a 2019 story. Actually, core inflation has been lower than we predicted too. The reason we were cautious saying inflation would accelerate this year was that price pressure is a gradual process, as inflation is quite persistent. When inflation is low (high), it is likely to remain low (high) for a while, before it moves back towards its long-run level. We still have sympathy for the idea that core inflation will move gradually higher in 2019 but lower inflation expectations and oil prices mean there is a risk we may be too optimistic. We forecast PCE core inflation will fall in the first half of 2019 before it starts rising again. We think PCE core inflation will be 2.1% y/y by the end of the forecast horizon.
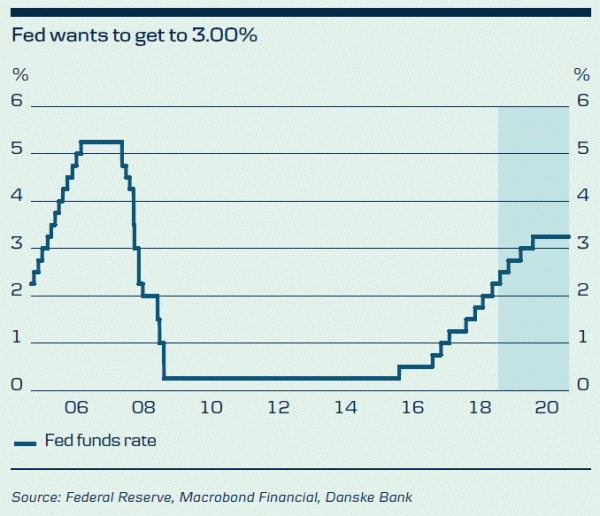
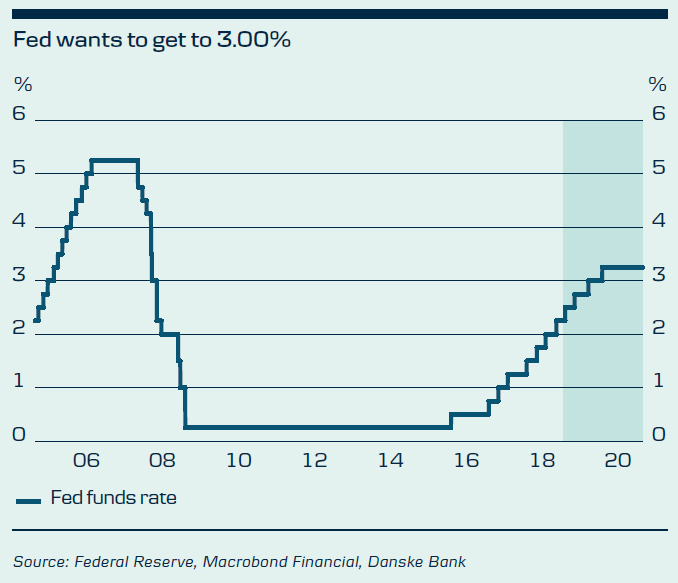
Fed wants to get to 3.00%
There has been some speculation that the Fed has turned more dovish recently. We think this is an over-interpretation, as the FOMC members overall still argue the Fed funds rate needs to go to neutral (i.e. where monetary policy is neither expansionary nor contractionary), which the Fed estimates to be 3.00%. We believe this will happen in June 2019 after hikes later here in December, March and June. After that it is probably more stop and go for the Fed and more rate hikes will depend on how the economy and the markets are doing. This is probably also the reason why more FOMC members including Fed Chair Powell and Vice Chair Clarida say that the Fed is data dependent. We think the Fed is able to hike once in the second half of 2019, i.e. a total of four hikes from now until year-end 2019. We think the Fed will stop there with the Fed funds rate at 3.25%.
We still believe EUR/USD will move higher next year. In the near term, the next 3M, we expect the cross to trade in a range around 1.13 on a 3M horizon with the risk of a dip towards 1.11. While the ECB is more confident on inflation, we think Draghi and co are in no hurry to push for fast ‘normalisation’ of monetary policy. But, medium term, the euro capital outflows of recent years will fade as the first ECB hike draws closer. Alongside valuation, this is set to support EUR/USD in 6-12M. We see EUR/USD at 1.18 in 6M, and 1.25 in 12M
 Trump has become a lame duck
The midterm elections ended as expected with a divided Congress, where the Democrats won control over the House and the Republicans retained power in the Senate. This means President Trump has become a 'lame duck' on domestic policy, as he will be unable to push his policy agenda through. This is also the main reason why we thought and still believe that the midterms have had limited implications for the economy and markets, as they will not lead to any major changes to economic policy. While Trump cannot make new tax cuts, the Democrats are unable to roll back tax reforms from December 2017. Trump and some Democrats have talked about making infrastructure investments but we think it is easier said than done.
With Trump as a 'lame duck', his focus is now turning to foreign and trade policy. We already know that Trump is more hawkish on foreign policy than President Obama, but the question is what Trump will do on trade policy. It is possible to argue that he will become more aggressive or more pragmatic. Based on the recent development, it seems like Trump wants to strike a deal with China, which would be positive for market risk sentiment and the economy.
Based on the election result, our base case is that Trump will lose the presidential election in 2020 but it is difficult to forecast an election result so far away. What is more interesting is that even if the Democrats are able to win the presidency, it is difficult to see the political gridlock going away, as the Democrats will have a difficult path winning Senate control also next time.
UK GDP rose 0.1% mom, industrial and manufacturing production contracted
Some volatility is seen in Sterling in early part of European session. It firstly declined against Euro, then was limited mildly by ECJ's ruling on Brexit revocation. But overall movements are limited and not even a batch of weak economic data was economy to kick the Pound out of range.
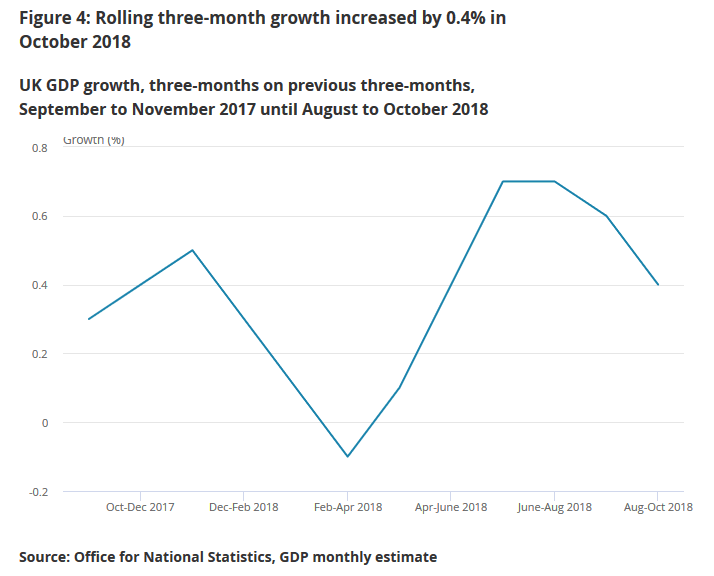
UK GDP rose 0.1% mom in October, matched expectations. For the rolling three months Aug to Oct, growth to 0.4%, down from 0.6% from Jul to Sep. The slow down was even more noticeable, comparing to 0.7% recorded in both May to Jul and Jun to Aug periods.
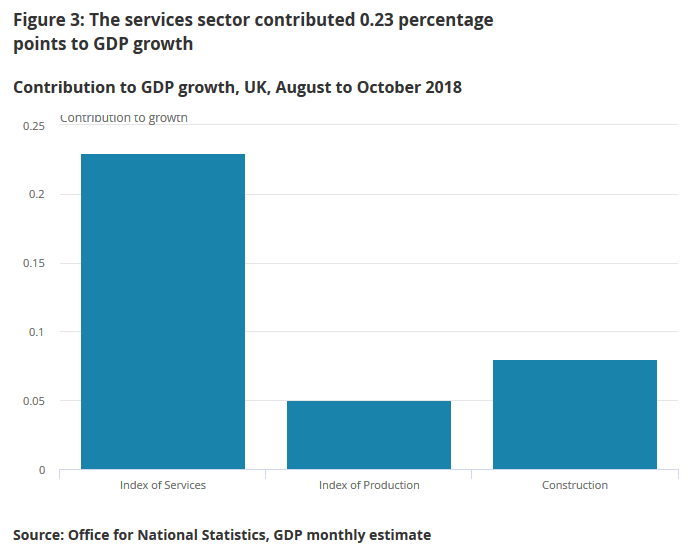
Services was the biggest contributor to growth in the Aug to Oct period, up 0.23%. Production rose merely 0.05% while construction rose 0.08%.
Also from UK, industrial production dropped -0.6% mom, -0.8% yoy in October versus expectation of 0.1% mom, -0.2% yoy. Manufacturing production dropped -0.9% mom, -1.0% yoy versus expectation of 0.0% mom, 0.0% yoy. Trade deficit widened to GBP -11.9B versus expectation of GBP -10.5B. Construction output dropped -0.2% mom versus expectation of -0.4% mom.
ECJ said UK free to revoke Brexit unilaterally
As widely expected, the European Court of Justice finally ruled today that "the United Kingdom is free to revoke unilaterally the notification of its intention to withdraw from the EU." And, "Such a revocation, decided in accordance with its own national constitutional requirements, would have the effect that the United Kingdom remains in the EU under terms that are unchanged as regards its status as a Member State.
The UK Parliament is set to vote on Prime Minister Theresa May's Brexit agreement tomorrow. Should the agreement passes, there is no doubt that UK is heading for Brexit in March. However, it's more likely than not that the agreement is voted down. That will open up a wide range of options in "uncharted waters" as described by May. There could be a new election, or even a new Brexit referendum.
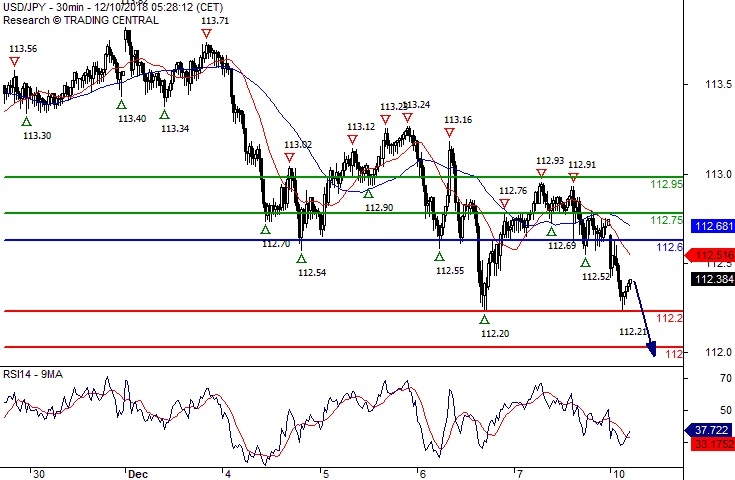
USD/JPY Watch 112.00
Pivot (invalidation): 112.60
Our preference Short positions below 112.60 with targets at 112.20 & 112.00 in extension.
Alternative scenario Above 112.60 look for further upside with 112.75 & 112.95 as targets.
Comment A break below 112.20 would trigger a drop towards 112.00.
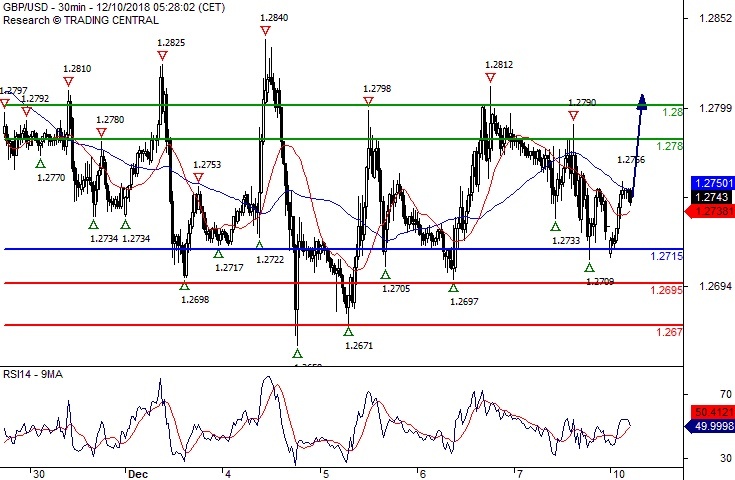
GBP/USD Turning Up
Pivot (invalidation): 1.2715
Our preference Long positions above 1.2715 with targets at 1.2780 & 1.2800 in extension.
Alternative scenario Below 1.2715 look for further downside with 1.2695 & 1.2670 as targets.
Comment The RSI calls for a new upleg.
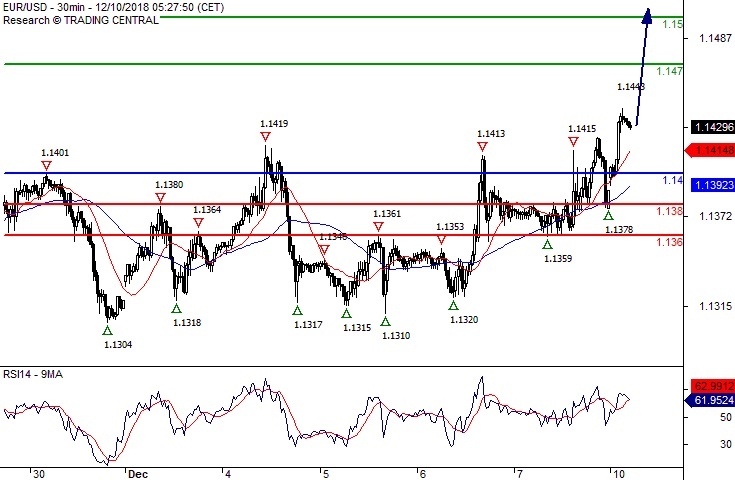
EUR/USD The Upside Prevails
Pivot (invalidation): 1.1400
Our preference Long positions above 1.1400 with targets at 1.1470 & 1.1500 in extension.
Alternative scenario Below 1.1400 look for further downside with 1.1380 & 1.1360 as targets.
Comment The RSI calls for a new upleg.