Sample Category Title
EUR/USD Surpasses Short-Term SMAs, Posts Bullish Days
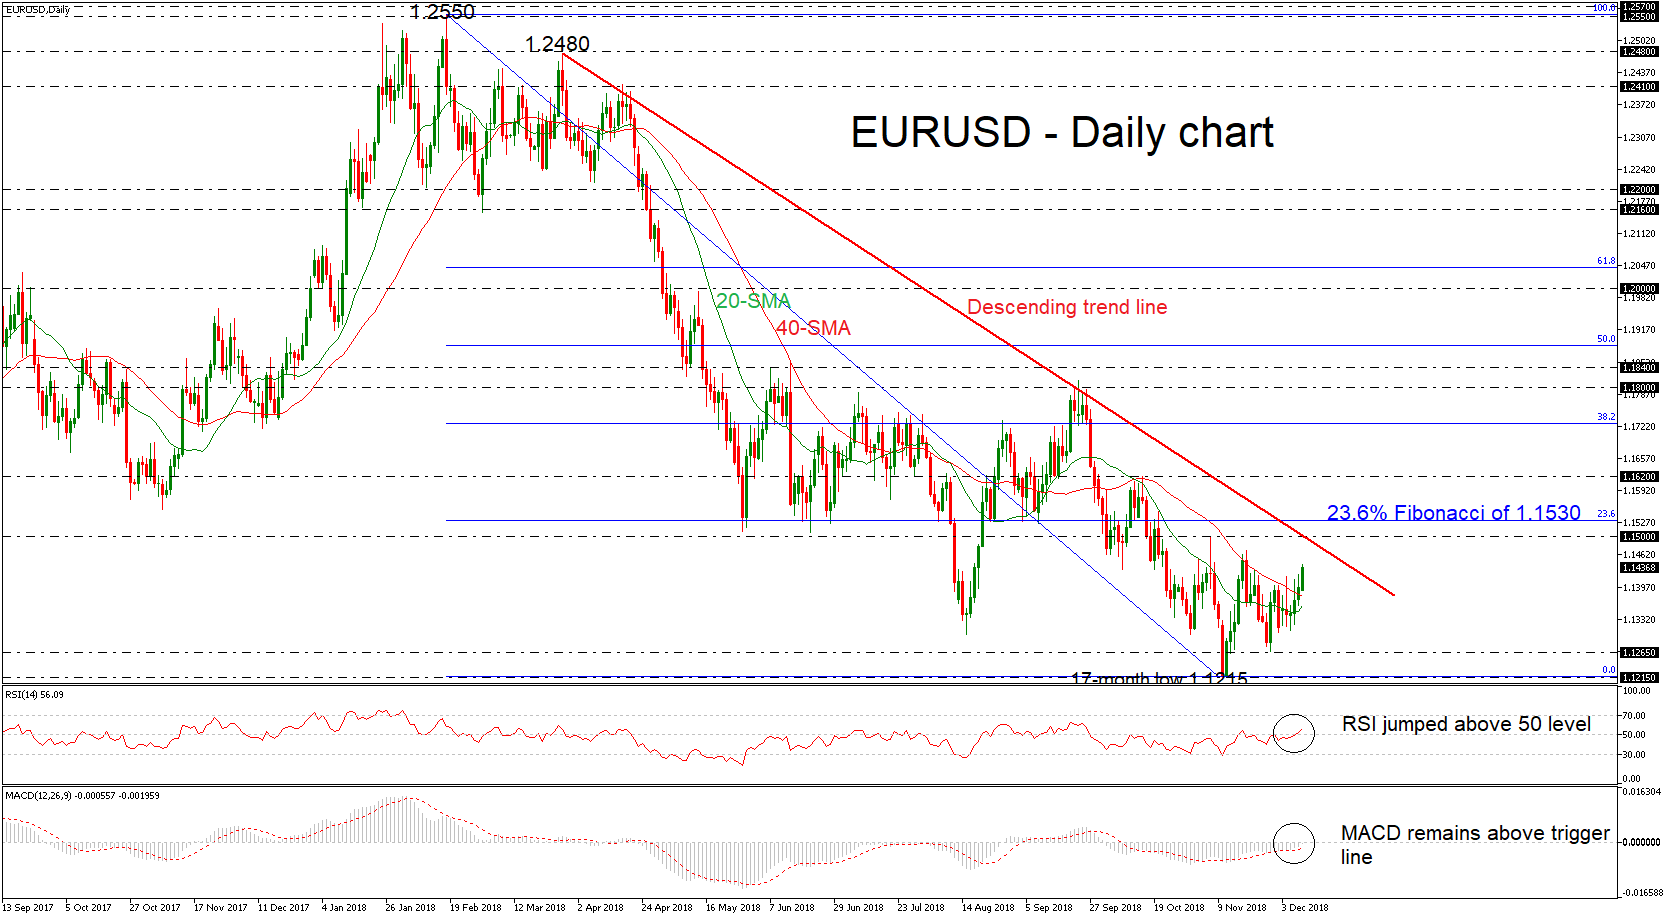
EURUSD has reversed back up after finding support at the 1.1265 barrier, successfully surpassing the 20- and 40-simple moving averages (SMAs) in the daily chart. Price advanced above the 1.1400 handle and is set to complete the fourth green day in a row, approaching the long-term descending trend line. The bullish bias is further supported by the MACD, which is holding above the trigger line, while the RSI entered positive territory, signaling more gains in the very short-term.
In case of further upside pressure, the price could challenge the 1.1500 strong psychological level, registered on November 7. A strong upside violation of the aforementioned level and the downtrend line could shift the bias to a more neutral one, challenging the 23.6% Fibonacci retracement level of the downleg from 1.2550 to 1.1215, around 1.1530. Even higher, the 1.1620 resistance could be a level to focus on.
However, should the pair experience negative pressure, the market could meet support at the 1.1265 support, identified by the recent lows on November 28, before heading towards the 17-month low of 1.1215. More losses could lead the price until the 1.1115 mark, registered on June 2017.
In the long-term view, the bearish picture looks to persist for a while longer as EURUSD has been developing in a downtrend since March of the current year. A penetration of this line could move prices to post an upside correction mode.
GBP/USD: Bullish Reversal If Price Remains Above 1.27
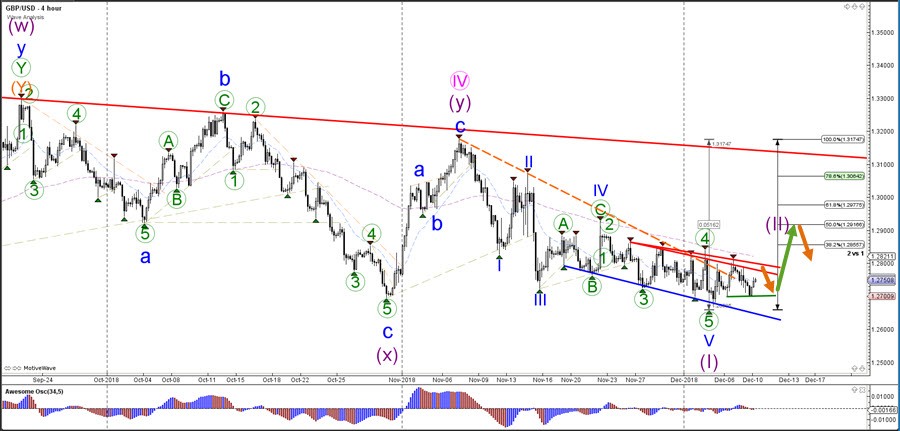
The GBP/USD bullish breakout would probably be part of a wave 2 (purple) correction. A break above the 100% Fibonacci level invalidates this wave pattern whereas a reversal below the 100% Fib could confirm it. An immediate break below the support trend line (green) invalidates the wave 2 and indicates a downtrend.
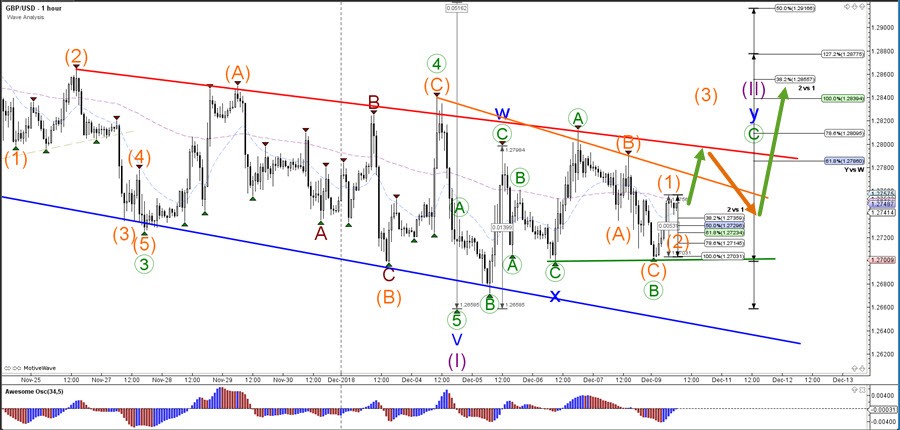
The GBP/USD seems to have completed a bearish ABC zigzag pattern within wave B (green) as expected. The sharp bullish bounce could indicate an ongoing wave 1 (orange), which could push up higher to the resistance zone. There a retracement within wave 2 (orange) might occur and the Fibonaccilevels could act as a support zone.
U.S. Stocks On Track For Worst December In 16 Years
December has so far been one of the worst year-ends for global investors in recent history. The S&P 500 has fallen 4.6% from the beginning of the month, and if it remains at current levels until year's end it will mark the worst performing December since 2003. Neither the dovish statements we heard from the Federal Reserve's policy makers nor the trade truce between U.S. President Donald Trump and his Chinese counterpart Xi Jinping provided signs of relief to the financial markets.
October's selloff was mainly attributed to fears of the Fed's tightening policy. However, after Fed Chair Jerome Powell said rates are “just below” neutral, anxiety over higher interest rates is no longer justified.
The arrest of Huawei Chief Financial Officer Meng Wanzhou in Canada, following a U.S. extradition request, have created serious concerns that the truce between the two Presidents may end before the 90 days agreed upon. This is occurring at a time when the global economy is experiencing a slowdown - and here comes the big threat. Bond markets have been more accurate than stock markets in predicting economic slowdowns. The short end of the U.S. Treasury yield curve already inverted last week and it looks like a matter of time before the long end of the curve inverts too. While this doesn't necessarily indicate a recession is imminent, it's a bold warning signal.
When looking at latest U.S. economic data, it doesn't look bad. Despite the U.S. NFP missing market expectations coming in at 155,000, the unemployment rate remains at a nearly 50-year low. U.S. factory activity remains healthy according to the latest ISM figures, and similarly the service sector has reflected strong growth in November. However, the U.S. economy won't be able to sustain its growth levels when everywhere else is experiencing a slowdown, and the real test will be next year when Trump's fiscal policy goes into reverse.
Equities in Asia resumed their selloff from last week, while Europe along with U.S. markets are also set to open in the red according to futures.
This week is a big one for the UK with the European Court of Justice expected to rule on whether the UK can cancel Brexit unilaterally.UK Prime Minister Theresa May is expected to face defeat in aHouse of Commons vote on her Brexit deal on Tuesday. Today we will get to know whether May decides to delay the vote on her Brexit deal, but the biggest unknown is what happens if MPs vote down the deal. Are we going to see a second referendum, no-confidence vote, a hard Brexit, or even a general election? This will keep Sterling in a very volatile mode until the clouds clear.
Souring Risk Sentiment As We Enter Eventful Week
Market movers today
A very eventful week starts rather slowly with the big event today being inflation data in Norway ( see Scandi markets) and the last day of the Brexit debate ahead of the vote in the UK House of Commons. Otherwise, key events this week are monetary policy decisions in the euro area, Norway and Switzerland, flash market PMIs and CPI inflation in the US and Sweden. Also, market focus will remain on global trade war concerns, general risk appetite and the oil price following Friday's OPEC+ deal.
With respect to Brexit , it seems unlikely PM Theresa May's Brexit deal will be passed tomorrow despite her attempt to secure public and political backing. As a defeat is widely expected, markets would react to the size of the defeat, although we doubt the market reaction would be significant, as political uncertainty is likely to remain elevated. Many political analysts say it is likely that May will try to hold a second vote in the House of Commons at a later stage. What happens if the deal is voted down a second time? Well, then we are in uncharted territory, which opens up for a range of possible outcomes. We have updated our game tree of the Brexit end-game. See Brexit monitor: Vote on Tuesday is not the final word in the Brexit saga , 9 December.
Selected market news
The sour risk sentiment from late Friday trading has continued into this week with most Asian indices trading in the 'red' this morning. Key to the sustained weak risk appetite are disappointing Chinese trade figures alongside news that China's Vice Foreign Minister has summoned the US ambassador over last week's arrest of Huawei's CFO. 10Y US Treasury yields have consequently fallen back to around 2.83% - the lowest level since August.
Friday's non-farm payrolls disappointed slightly relative to consensus, with headline job growth, revisions and wage growth falling short of expectations. Meanwhile, we do not think markets should over interpret the release as the labour market still looks sufficiently strong for the Fed to gradually hike rates to the estimated 'neutral' 3.0%.
On Friday, OPEC+ agreed to cut production by 1.2mb/d with effect from January 2019. The decision followed two days of back-and-forth negotiations. The output cut will be based on the level of production in October but the country-specific production cuts will not be published even if Iran, Libya and Venezuela are exempt from the deal. OPEC is set to contribute 800kb/d while non-OPEC will contribute the remaining 400kb/d. The deal is set to last six months and is up for review in April. In our view, this deal underpins that oil market fundamentals in general lately have become more positive and we expect the oil price to move above USD70/bbl over the coming month.
Late Friday, Annegret Kramp-Karrenbauer (AKK) was elected as new CDU party leader. On balance, it means policy continuity and makes it more likely that Merkel will stay as Chancellor until 2021, which is positive for EMU reforms.
Over the weekend, the right-wing Belgian party N-VA left its position in the government in protest against a likely international UN agreement on migration, which is set for approval in Morocco next week. The decision comes just months before elections.
Oil Stable But Not Roaring Higher After Output Cut Agreed
Sell-Off continues on Monday
It's shaping up to be another tough week in financial markets, with Europe soon to join Asia in the red and the US joining the club later in the day unless we see a dramatic shift in sentiment.
Friday's jobs report did little to stop the bleeding, with jobs growth in November coming in well short of expectations and monthly wage growth also missing. This weaker assessment has softening expectations for near-term rate hikes, with even December which only a week ago looked a near certainty now dropping to around 70% and another next year being less likely than not.
We may have hoped that this less hawkish outlook for interest rates would support the market – with the opposite having been the catalyst for the sell-off back in October - but with the yield curve still inverted between three and five years and more people now anticipating a slowdown next year, the bullish case for stocks looks to be fading fast.
Can May survive a failed vote on Tuesday?
It's not just the markets that are facing a tough week, Theresa May will struggle to still have a job by Friday if she fails to get her Brexit deal through parliament on Tuesday. The PM has shown incredible staying power over the past 18 months having survived numerous hairy moments that could have toppled her but this could be a step too far unless she can convince MPs that she can deliver what they want.
There are so many avenues that this process could go down if the vote fails on Tuesday and that uncertainty could drag on sterling which is currently clinging on for dear life around 1.27 against the dollar. I still feel that traders are reluctant to let go just yet on the stubborn belief that a positive outcome lies ahead, the only problem being that there could be some severe turbulence between now and then. If the vote fails on Tuesday, as is widely expected at this point, it could take 1.27 with it and the downside could be quite significant.
Oil stable but not roaring higher after output cut agreed
OPEC and its allies managed to get a production cut over the line on Friday, promising to pump 1.2 million barrels less from January than it did in October, with OPEC shouldering 800,000 of those. The agreement is clearly a success for the group, which is desperate to remain relevant in a world that is dominated by the three largest producers, the US, Russia and Saudi Arabia. Russia's agreement at a larger cut is the only reason this got over the line, otherwise it would have been a total failure.
With the review now set for April, just before the US waivers on Iranian oil expire, producers will be hoping they've done enough to stem the bleeding. We saw a nice rally in response to the news on Friday but prices still remain under pressure. A rebound back above $70 in Brent or $60 in WTI may not be on the cards just yet but the deal may have succeeded in avoiding another trip back towards $40 which producers will be relieved about.
Euro-Zone’s Economy Expanded As Estimated In 3Q 2018
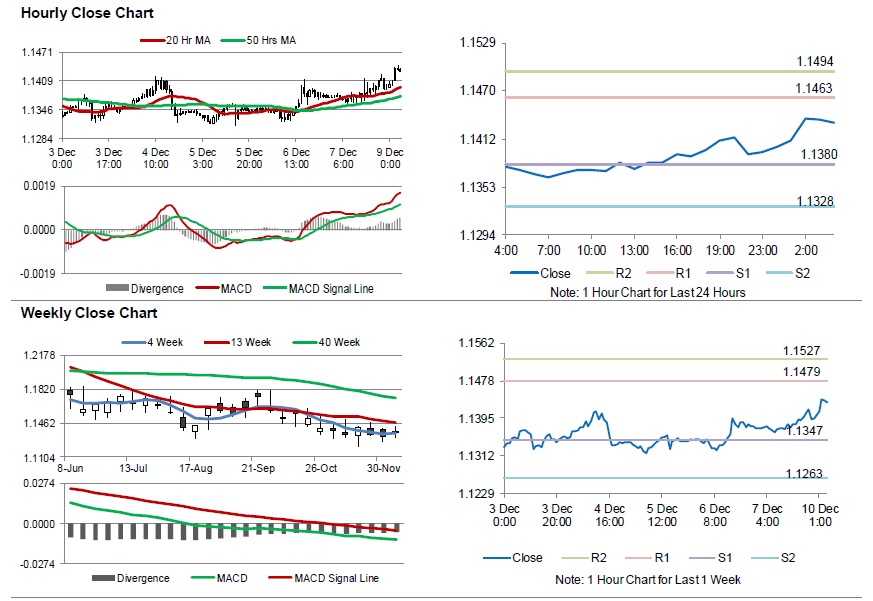
For the 24 hours to 23:00 GMT, the EUR rose 0.32% against the USD and closed at 1.1414 on Friday.
Macroeconomic data indicated that the Euro-zone's seasonally adjusted final gross domestic product (GDP) climbed 0.2% on a quarterly basis in 3Q 2018, meeting market expectations and confirming the preliminary print. In the previous month, GDP had recorded an advance of 0.4%. Separately, in Germany, seasonally adjusted industrial production unexpectedly declined 0.5% on a monthly basis in October, cofounding market expectations for a gain of 0.3%. In the prior month, industrial production had registered a revised rise of 0.1%.
The US dollar declined against a basket of currencies, as weaker than expected US jobs data raised doubts over the Federal Reserve's future interest rate path.
In the US, data showed that the US non-farm payrolls dropped more than expected by 155.0K in November, following a revised increase of 237.0K in the preceding month. Market participants had envisaged non-farm payrolls to fall to a level of 198.0K. However, average hourly earnings of all employees climbed 0.2% on a monthly basis in November, undershooting market expectations for a gain of 0.3%. Average hourly earnings of all employees had registered a revised rise of 0.1% in the previous month. Moreover, consumer credit registered a more-than-expected rise of $25.4 billion in October. In the previous month, consumer credit had climbed $10.9 billion. Meanwhile, the nation's unemployment rate remained unchanged at a rate of 3.7% in November, in line with market expectations. Also, the flash Reuters/Michigan consumer sentiment index remained steady at 97.5 in December.
In the Asian session, at GMT0400, the pair is trading at 1.1431, with the EUR trading 0.15% higher against the USD from Friday's close.
The pair is expected to find support at 1.1380, and a fall through could take it to the next support level of 1.1328. The pair is expected to find its first resistance at 1.1463, and a rise through could take it to the next resistance level of 1.1494.
Moving ahead, traders would closely monitor the Euro-zone's Sentix investor confidence index for December, along with Germany's trade balance data for October, set to release in a few hours. Later in the day, the US JOLTS job openings for October will be on investor's radar.
The currency pair is trading above its 20 Hr and 50 Hr moving averages.
UK’s Halifax House Price Index Dropped To A 6-Year Low Level In November
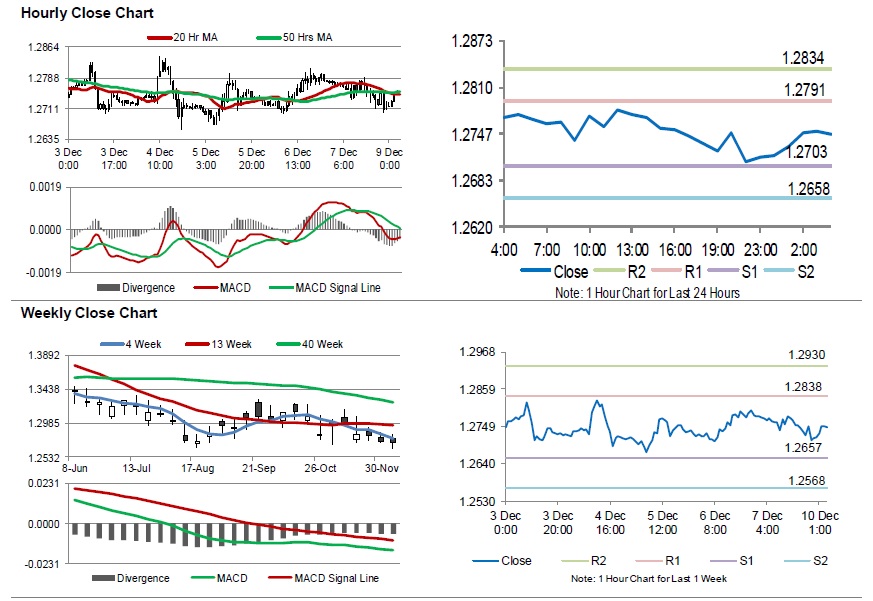
For the 24 hours to 23:00 GMT, the GBP declined 0.27% against the USD and closed at 1.2749 on Friday.
On the data front, UK's Halifax house price index unexpectedly slid to a six-year low level of 1.4% on a monthly basis in November, defying market consensus for an advance of 0.2%. The index had recorded a gain of 0.7% in the prior month.
In the Asian session, at GMT0400, the pair is trading at 1.2747, with the GBP trading a tad lower against the USD from Friday's close.
The pair is expected to find support at 1.2703, and a fall through could take it to the next support level of 1.2658. The pair is expected to find its first resistance at 1.2791, and a rise through could take it to the next resistance level of 1.2834.
Trading trend in the sterling today is expected to be determined by UK's trade balance data, industrial production and manufacturing production, all for October, scheduled to release in a few hours.
The currency pair is showing convergence with its 20 Hr and 50 Hr moving averages.
Japan’s Gross Domestic Product Fell At Its Quickest Pace Since 2014 In 3Q 2018
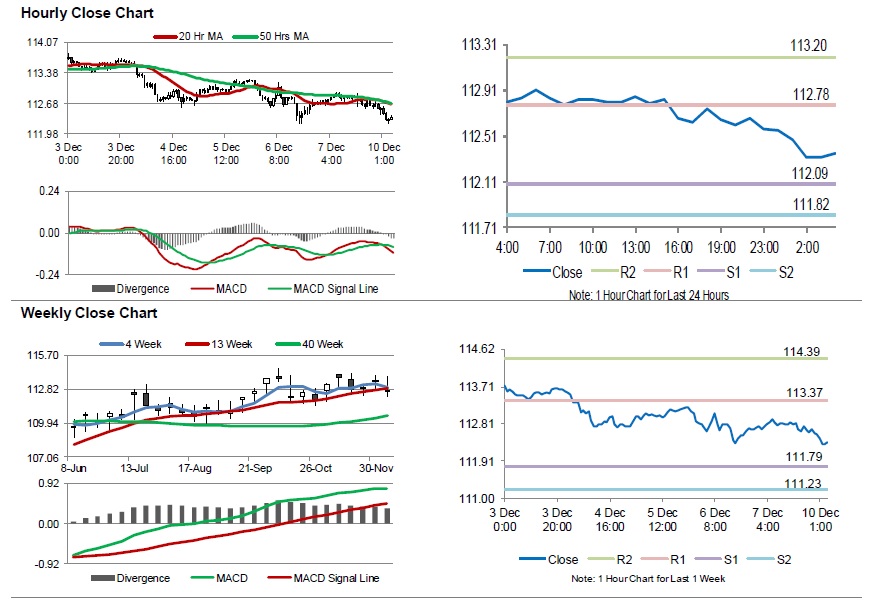
For the 24 hours to 23:00 GMT, the USD declined 0.07% against the JPY and closed at 112.60 on Friday.
In the Asian session, at GMT0400, the pair is trading at 112.36, with the USD trading 0.21% lower against the JPY from Friday's close.
Data indicated that Japan's final gross domestic product (GDP) fell at its fastest pace in four years by 0.6% on a quarterly basis in 3Q 2018, less than market expectations for a fall of 0.5%. The preliminary figures had recorded a drop of 0.3%, while GDP had registered a rise of 0.7% in the prior month. Furthermore, the nation posted a trade deficit of ¥321.7 billion in October, following a surplus of ¥323.3 billion in the previous month. Additionally, adjusted current account surplus narrowed to ¥1211.3 billion in October, compared to a surplus of ¥1334.0 billion in the preceding month.
The pair is expected to find support at 112.09, and a fall through could take it to the next support level of 111.82. The pair is expected to find its first resistance at 112.78, and a rise through could take it to the next resistance level of 113.20.
The currency pair is trading below its 20 Hr and 50 Hr moving averages.
AUD/USD Daily Outlook
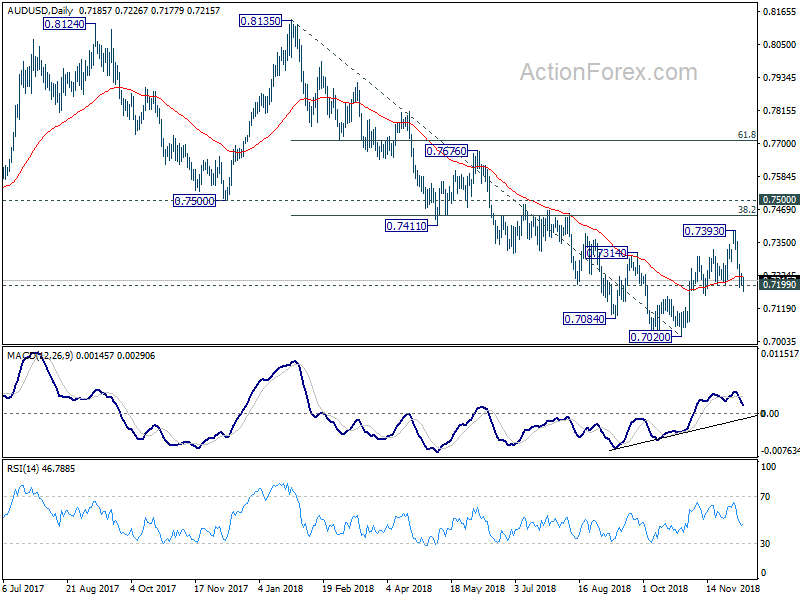
Daily Pivots: (S1) 0.7184; (P) 0.7213; (R1) 0.7228; More...
Focus remains on 0.7199 support for AUD/USD. Decisive break there will suggest that the corrective rebound from 0.7020 has completed earlier than expected. Deeper fall should then be seen back to retest 0.7020 low. On the upside, above 0.7300 minor resistance will turn bias back to the upside. In that case, corrective rise from 0.7020 would extend to 38.2% retracement of 0.8135 to 0.7020 at 0.7446 before completion.
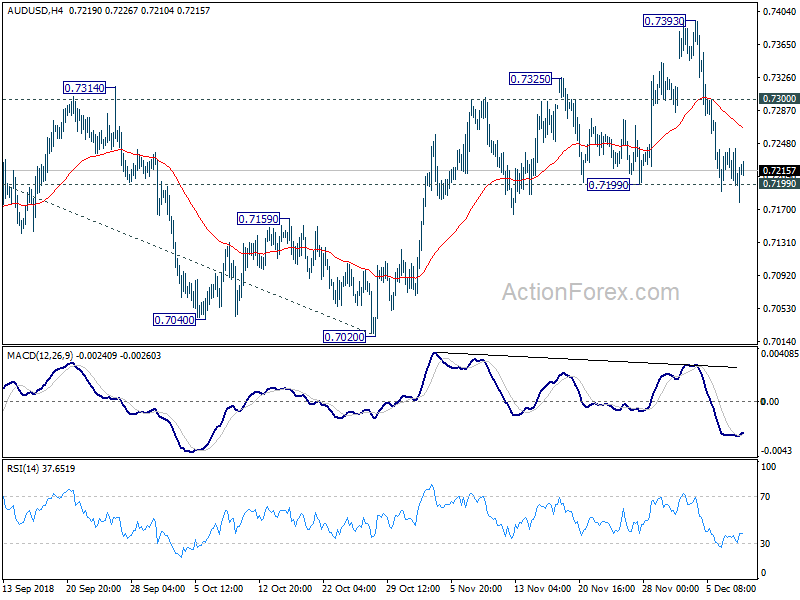
In the bigger picture, a medium term bottom is in place at 0.7020 ahead of 0.6826 key support (2016 low). Stronger rebound might be seen to correct the whole fall from 0.8135 high. But we'd expect strong resistance from 0.7500 support turned resistance to limit upside. Medium term fall from 0.8135 should resume and extend to take on 0.6826 low at a later stage, after the correction from 0.7020 completes.
Swiss Franc Trading Higher In The Asian Session
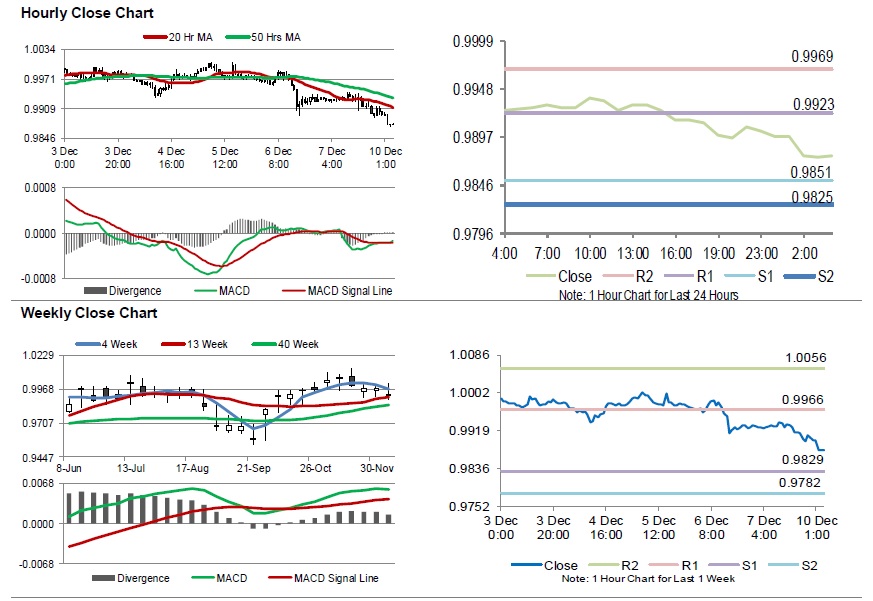
For the 24 hours to 23:00 GMT, the USD declined 0.31% against the CHF and closed at 0.9896 on Friday.
In the Asian session, at GMT0400, the pair is trading at 0.9877, with the USD trading 0.19% lower against the CHF from Friday’s close.
The pair is expected to find support at 0.9851, and a fall through could take it to the next support level of 0.9825. The pair is expected to find its first resistance at 0.9923, and a rise through could take it to the next resistance level of 0.9969.
Moving forward, traders would await Switzerland’s unemployment rate for November scheduled to release in a few hours.
The currency pair is trading below its 20 Hr and 50 Hr moving averages.