

Sample Category Title
GBPUSD Intraday Analysis
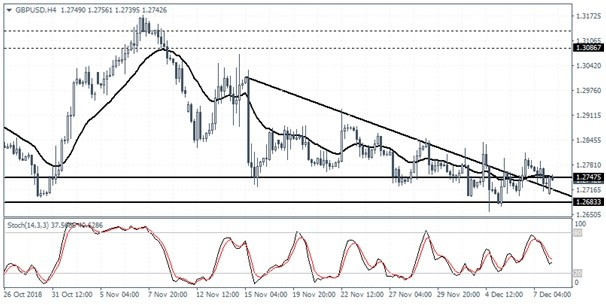
GBPUSD (1.2742): The GBPUSD currency pair was seen continuing to consolidate near the support level of 1.2745. Price action was seen falling back to this level despite breaking above the falling trend line. The consolidation is likely to continue, but the support holding the declines could indicate some upside momentum building up. A break down below the support could no doubt push the GBPUSD to fresh lows.
EURUSD Intraday Analysis
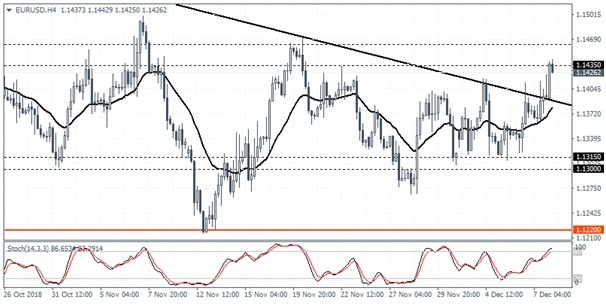
EURUSD (1.1426): The EURUSD currency pair managed to break past the falling trend line on Friday. However, price action closed with a doji with some sharp volatility. This could potentially keep prices choppy as the Euro currency could be either seen extending the momentum to the upside at 1.1435 or the gains could be erased pushing the currency pair lower back to close below the trendline. This would keep price action trading flat for the most part. As long as the lower support at 1.1315 - 1.1300 holds, the EURUSD currency pair will be seen holding a flat price range.
China Annual Inflation
Germany's industrial production sector was seen falling by 0.5% on the month which missed estimates of a 0.3% increase. The declines follow a 0.1% increase previously.
The Eurozone's final employment change figures showed a 0.2% increase in matching estimates while the final revised GDP was unchanged at 0.2% for the third quarter.
The U.S. unemployment rate was steady at 3.7% as the economy added 155k jobs during the month. Previous month's data was revised down to 237k. Average earnings grew by 0.2% pushing the annualized wage growth rate to 3.0%.
Canada's jobs data, also released on Friday showed that the economy added a net gain of 94.1k jobs for November. The unemployment rate fell to 5.6% marking a historically new low amid forecasts of an unchanged print at 5.8%.
Over the weekend, China's inflation figures showed that headline CPI rose 2.2% on the year in November. The median estimates forecast a 2.4% increase. Producer prices increased 2.7% amid forecasts of a 2.8% increase. Looking ahead, Japan's final GDP data showed a 0.6% decline. This was a slightly revised GDP figure compared to a 0.5% decline as per the second estimates.
The European trading session will kick off with the monthly GDP numbers from the UK. Economists forecast a 0.1% increase on the month after the GDP flatlined previously. Manufacturing production is expected to remain flat while construction output is forecast to fall by 0.4%.
Forex Technical Analysis: EUR/USD, USD/JPY, GBP/USD
EUR/USD
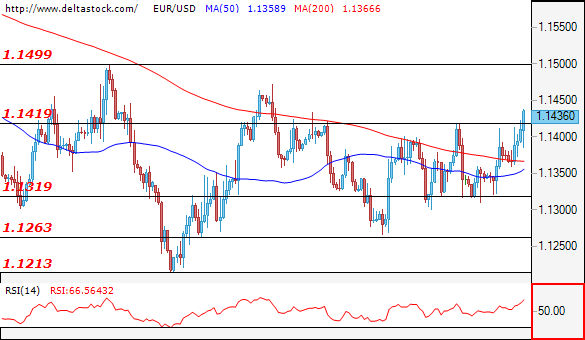
Current level - 1.1436
The pair is trying to break through the 1.1420 level after the negative US jobs report released on Friday.We expect the 1.1470 resistance to stop the current upmove and continuation of the midterm downtrend for a test of 1.1214. A break there will pave the way for a downmove to 1.1035. Break through 1.15 will neutralise the bearish scenario.
| Resistance | Support | ||
| intraday | intraweek | intraday | intraweek |
| 1.1360 | 1.1500 | 1.1320 | 1.1200 |
| 1.1420 | 1.1620 | 1.1260 | 1.0850 |
USD/JPY
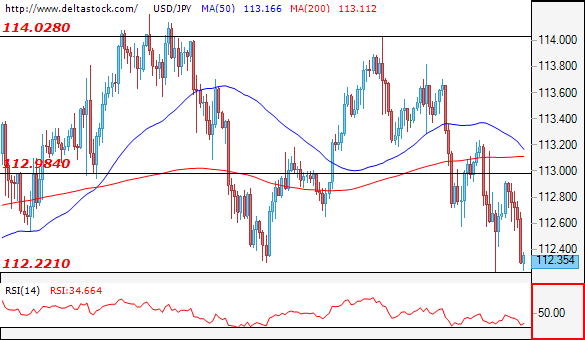
Current level - 112.35
The 112.20 support level is holding so far and we expect a correction to 113.60 resistance level. In case of a break of 112.20 then the next support at 111.77 will come into play.
| Resistance | Support | ||
| intraday | intraweek | intraday | intraweek |
| 114.00 | 114.50 | 113.10 | 112.30 |
| 114.20 | 116.20 | 112.60 | 111.60 |
GBP/USD
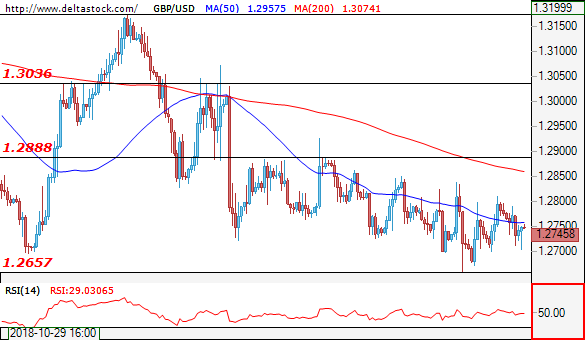
Current level - 1.2745
It seems that the pair can't find it's way after several tests of the 1.2820 zone. I expect a fall from the current levels as the target is the historically strong 1.2660. If the level gets broken the dall could extend to 1.2340.
| Resistance | Support | ||
| intraday | intraweek | intraday | intraweek |
| 1.2860 | 1.3250 | 1.2720 | 1.2660 |
| 1.2920 | 1.3440 | 1.2660 | 1.2340 |
GBP/JPY Daily Outlook
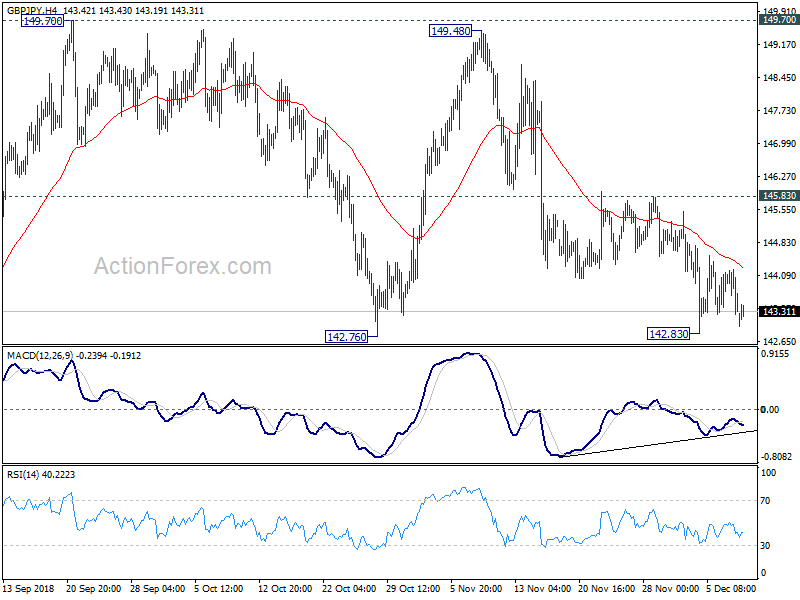
Daily Pivots: (S1) 143.10; (P) 143.65; (R1) 144.08; More...
Intraday bias in GBP/JPY remains neutral for consolidation above 142.83 temporary low. Some consolidation could be seen. But near term outlook remains cautiously bearish as long as 145.83 resistance holds. On the downside, firm break of 142.76 will pave the way to 139.29/47 key support zone.
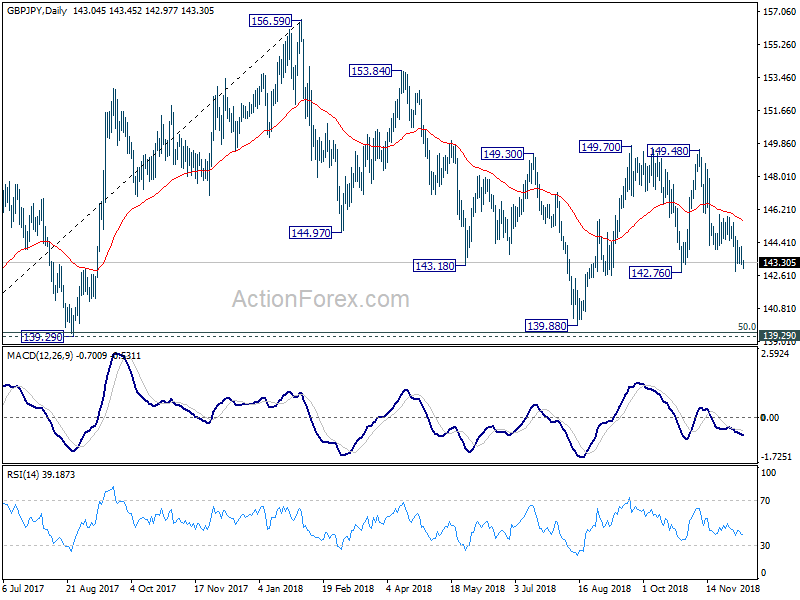
In the bigger picture, as long as 139.29 cluster support (50% retracement of 122.36 to 156.59 at 139.47) holds, up trend from 122.36 (2016 low) could still extend beyond 156.69 high. However, decisive break of 139.29/47 will suggest that such up trend is completed and turn outlook bearish. In that case, next target is 61.8% retracement at 135.43.
EUR/JPY Daily Outlook
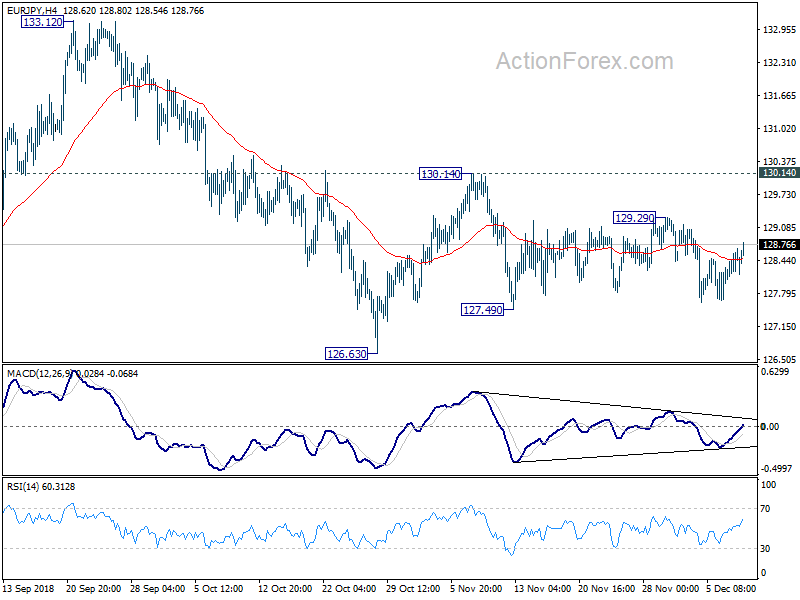
Daily Pivots: (S1) 128.08; (P) 128.38; (R1) 128.71; More....
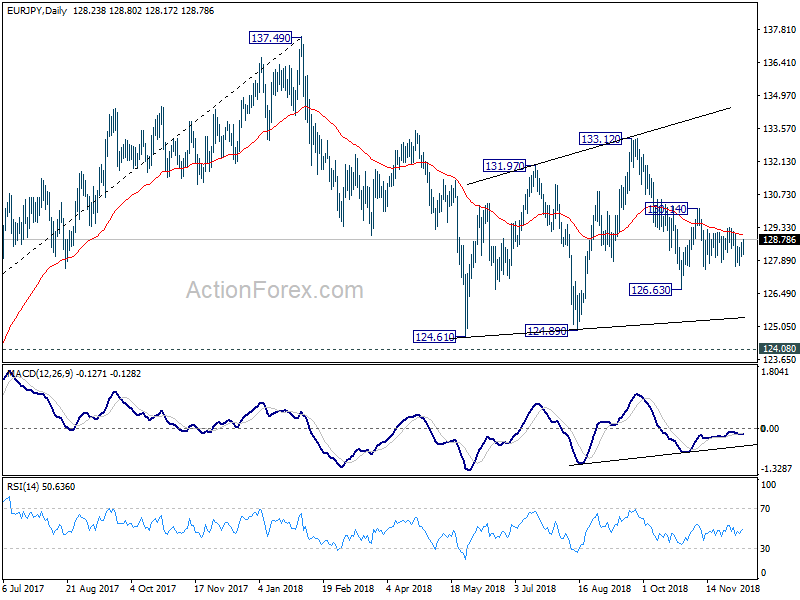
EUR/JPY's consolidation from 127.49 is still in progress and intraday bias remains neutral. On the downside, break of 127.49 will target 126.63 support first. Break there will then resume the whole decline from 133.12 to 124.08/89 support zone. And, even in case of recovery, outlook will stay bearish as long as 130.14 resistance holds.
In the bigger picture, as long as 124.08 key resistance turn supported holds, larger up trend from 109.03 (2016 low) could still resume. Firm break of 137.49 structural resistance will target 141.04/149.76 resistance zone next. However, decisive break of 124.08 will argue that such rise from 109.03 has completed and turn outlook bearish. In that case, deeper fall would be seen to 61.8% retracement of 109.03 to 137.49 at 119.90.
EUR/GBP Daily Outlook
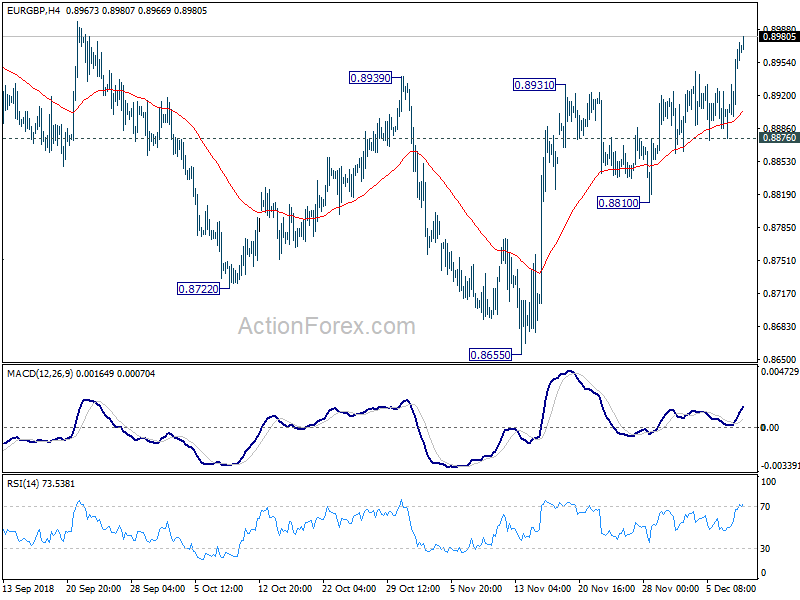
Daily Pivots: (S1) 0.8898; (P) 0.8935; (R1) 0.8980; More...
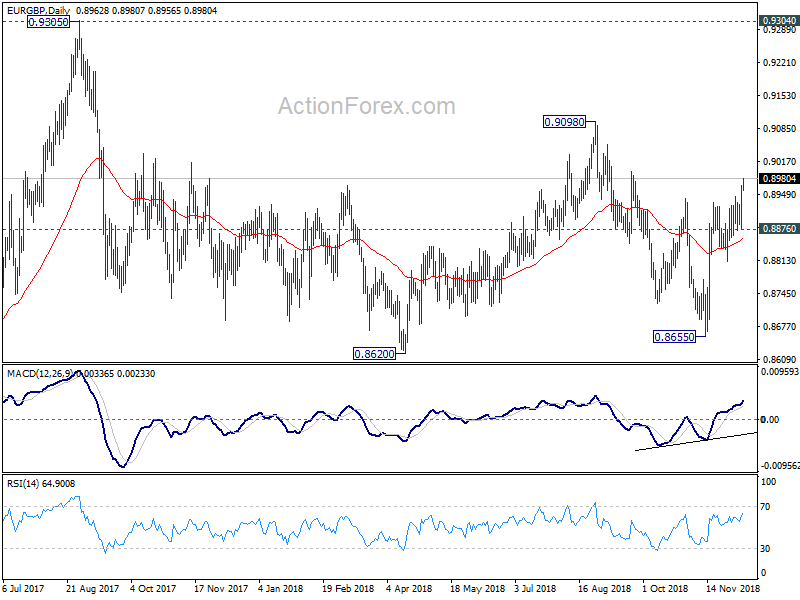
EUR/GBP's rally from 0.8655 is in progress and intraday bias remains on the upside. Fall from 0.9098 should have completed at 0.8655 and further rise should be seen to this resistance first. Sustained break will target 0.9304 key resistance next. On the downside, break of 0.8876 minor support will mix up near term outlook and turn intraday bias neutral first.
In the bigger picture, EUR/GBP is seen as staying in long term range pattern started at 0.9304 (2016 high). Sustained break of 0.8939 resistance will confirm that it's in a medium term rising leg for 0.9098 and above. And for now, in case of another fall, downside will likely be contained by 0.8620/55 support zone to bring rebound.
EUR/AUD Daily Outlook
Daily Pivots: (S1) 1.5740; (P) 1.5794; (R1) 1.5880; More....
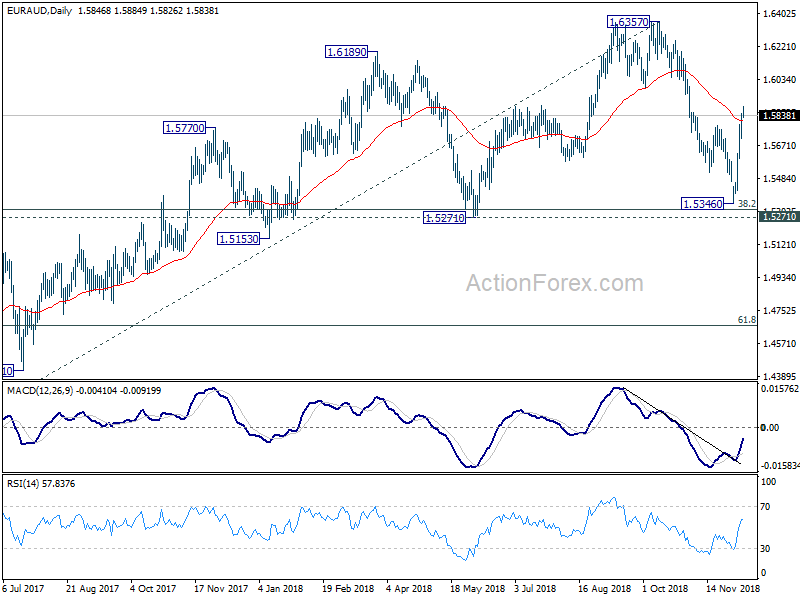
Intraday bias in EUR/AUD remains on the upside at this point. Fall from 1.6357 should have completed earlier than expected at 1.5346. Further rise should be seen to 1.5984 support turned resistance first. Break will bring retest of 1.6357 high. On the downside, break of 1.5706 minor support will turn intraday bias neutral and bring consolidation first, before staging another rally.
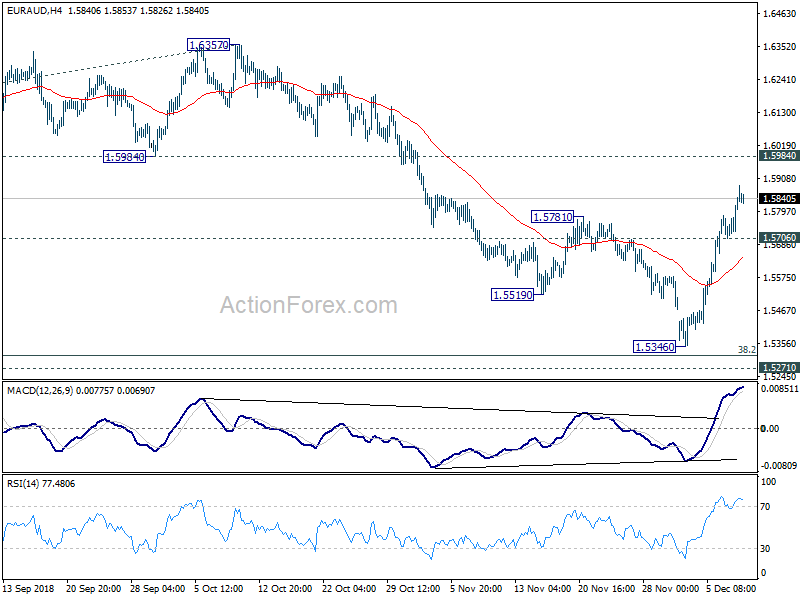
In the bigger picture, no change in the view that 1.6357 is a medium term top. But the strong rebound ahead of 1.5271 cluster support (38.2% retracement of 1.3624 to 1.6357 at 1.5313) suggests price actions from 1.6357 are developing into sideway consolidation, rather than a deep correction. The range of 1.5271/6357 is likely set for the consolidation. And we don't expect a break of the range any time soon. But decisive break of 1.6357 will resume the larger up trend from 1.3624 (2017 low) to 1.6587 (2015 high).
EUR/CHF Daily Outlook
Daily Pivots: (S1) 1.1270; (P) 1.1290; (R1) 1.1303; More...
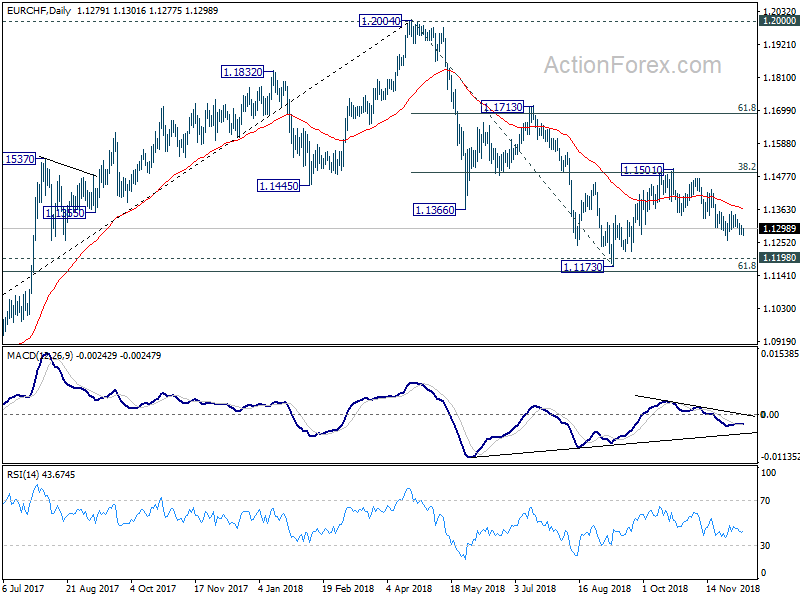
Intraday bias in EUR/CHF remains mildly on the downside for 1.1260 support first. Break will resume the whole decline from 1.1501 and target 1.1173 low. On the upside, break of 1.1356 resistance is needed to indicate short term bottoming. Otherwise, near term outlook will be mildly bearish even in case of recovery.

In the bigger picture, price actions from 1.2004 medium term top is seen as a correction only. Downside should be contained by support zone of 1.1198 (2016 high) and 61.8% retracement of 1.0629 to 1.2004 at 1.1154 to complete it and bring rebound. A break of 1.2 key resistance is still expected in the medium term long term. However, sustained break of the mentioned support zone will mark reversal of the long term trend. In that case, 1.0629 key support will be back into focus.
GBP/USD And USD/CAD Facing Key Resistances
GBP/USD is facing many hurdles near the 1.2700 and 1.2800 resistance levels. Similarly, USD/CAD is trading below the key 1.3350-60 resistance zone.
Important Takeaways for GBP/USD and USD/CAD
- The British Pound is following a steady bearish path below the 1.2800 resistance.
- There is a major bearish trend line in place with resistance near the 1.2780 level on the hourly chart of GBP/USD.
- USD/CAD is currently trading below the 1.3350 and 1.3360 resistance levels.
- The pair is facing an important bearish trend line with resistance near 1.3350 on the hourly chart.
GBP/USD Technical Analysis
Recently, the British Pound made many attempts to settle above the 1.2800 and 1.2810 resistance levels against the US Dollar. However, the GBP/USD pair failed to gain momentum above 1.2815 and later declined.
The last swing high was formed at 1.2808 on FXOpen and later the pair started a downside move. It declined below the 1.2750 support and the 50 hourly simple moving average.
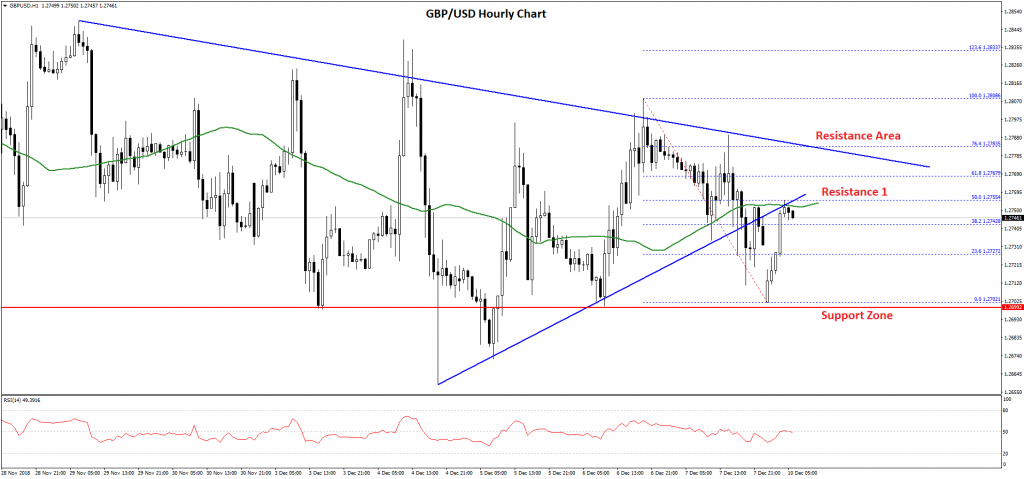
The decline was such that the pair traded close to the 1.2700 level and a low was formed at 1.2702. Later, the pair corrected higher and traded above the 1.2740 level. It also moved above the 38.2% Fib retracement level of the recent decline from the 1.2808 high to 1.2702 low.
However, the pair failed to clear the 1.2755 level and the 50 hourly SMA. More importantly, the 50% Fib retracement level of the recent decline from the 1.2808 high to 1.2702 low acted as a solid barrier for buyers.
Above 1.2755, there is a major bearish trend line in place with resistance near the 1.2780 level on the hourly chart. Therefore, if the pair corrects above the 1.2755-60 zone, it could face a lot of selling interest near the 1.2780 level.
Overall, GBP/USD remains in a downtrend unless buyers push the pair above 1.2780 and 1.2800. On the downside, an initial support is at 1.2720, below which the pair could retest the 1.2700 area in the near term.
USD/CAD Technical Analysis
The US Dollar gained bullish momentum this past week and traded above the 1.3250 and 1.3300 resistance levels against the Canadian Dollar. The USD/CAD pair even climbed above the 1.3400 barrier before sellers appeared near the 1.3440 level.
A high was formed near the 1.3444 level and later the pair corrected lower sharply. It declined below the 1.3350 and 1.3300 support levels. It tested the 1.3250 support and settled below the 50 hourly simple moving average.
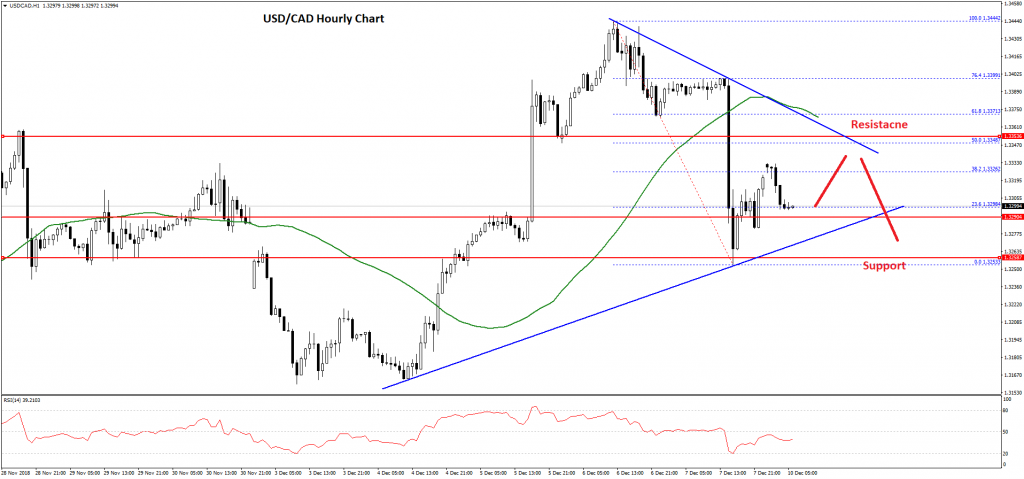
At the moment, the pair is correcting above the 1.3300 level and the 23.6% Fib retracement level of the recent decline from the 1.3444 high to 1.3253 low. However, there are many hurdles on the upside near the 1.3330 and 1.3350 levels.
There is also an important bearish trend line formed with resistance near 1.3350 on the hourly chart. Above the trend line, the 50 hourly SMA is positioned at 1.3370. Below the trend line, the 50% Fib retracement level of the recent decline from the 1.3444 high to 1.3253 low is at 1.3348.
Therefore, if the pair corrects further higher, it could face a strong resistance near 1.3345-50. On the downside, an initial support is near 1.3290 and a bullish trend line on the same chart. However, the key support is at 1.3250, below which USD/CAD might retest 1.3200.