Sample Category Title
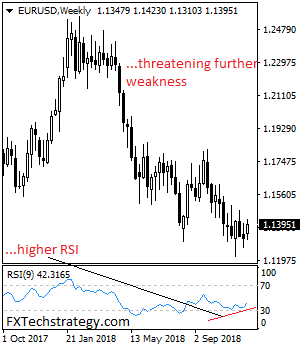
EURUSD Eyes Further Upside Pressure Nearer Term
EURUSD continues to face further recovery higher. Support lies at the 1.1350 where a violation will aim at the 1.1300 level. A break below here will aim at the 1.1250 level. Further down, support lies at the 1.1200. On the upside, resistance resides at 1.1450 level with a break through there opening the door for further upside towards the 1.1500 level. Further up, resistance comes in at the 1.1550 level where a violation will expose the 1.1600 level. Its daily RSI is bullish and pointing higher suggesting further upside. All in all, EURUSD continues to face downside pressure.
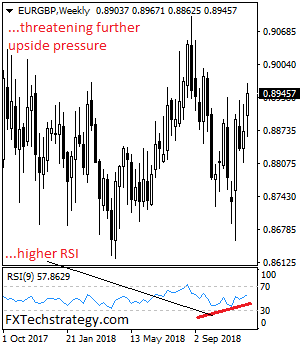
EURGBP Continues To Target Higher Prices
EURGBP continues to target higher prices following its higher close the past week. On the downside, support stands at the 0.8900 level where a violation will turn focus to the 0.8850 level. A break below here will aim at the 0.8800 level. Resistance lies at the 0.8950 level. A violation if seen will turn risk towards the 0.9000 level. Further up, resistance comes in at 0.9050 level followed by the 0.9100 level. Its weekly RSI is bullish and pointing higher suggesting more strength. All in all, EURGBP remains biased to the upside on further bull pressure.
Eco Data 12/10/18
[php_everywhere instance="1"]
Some Considerations For Moving Stop-Losses
We previously talked about the differences between fixed and moving stop-losses, and if the latter seems like something that could help you with your trading, here are some things you might want to consider.
To reiterate, a moving stop-loss implies setting the stop according to a predetermined indicator, and then following that determination regardless of market moves. It does NOT mean adjusting the stop according to the spot conditions of the market, attempting to keep the trade from stopping out.
Where to start
The primary purpose for using a dynamic stop-loss is to take advantage of improving trends in the market, so it’s best suited for a trader that is present during most of the trading time to keep the stop adjusted accordingly.
The most popular form of moving stop-loss is to set it according to a long-term moving average, such as a 200 SMA. This allows the trader to feel out the long-term trend in the market, and keep the stop around where the market is showing a reverse in trend (and therefore, necessary to reevaluate the trading strategy).
Another form of moving stop-loss is to use Bollinger Bands and use either the edge of the band or the edge plus a fixed number of pips to set where the stop should be. This allows the stop to account for an increase in market volatility while preventing the trade from running away.
Stick to what works
The undergirding consideration, regardless of the indicator chosen, is that it has to be determined before entering the trade and based on money management criteria and applicable across multiple trades. Consistency and replicability typically is the key to long-term trading success, so if you are improvising the stop loss on every trade, it’s not helping to keep you consistently from losing on your trading.
Similar to a fixed stop-loss, if your stop is too shallow – that is, it’s too close to the market – you can be stopped out before your trade has a chance to work. And if it’s too far from the market, you can be taking unnecessary losses. Consequently, when selecting the criteria for your moving loss, you have to take into account the relative market position. (Though one advantage of a moving stop here is that if you see it’s too close to the market, it might be an indication that the trade you are thinking about is not as safe as you thought.)
Fitting with the strategy: security or technique
With money management, an integral part of your plan, the criteria for determining your stop-loss will be an essential aspect of your trading. If you are using stop-losses as a security measure, and enter and leave the market using the indicators, your stop will likely be farther away. A dynamic stop probably will be easier to apply, because you already have the practice and discipline to stop trades, even if they aren’t going the way you want. On the other hand, your trades likely rarely stop out, and only in extreme circumstances, so you won’t get as much benefit from adjusting the stop constantly.
If you are using stops because otherwise, you won’t ever let a trade close in the red, then you shouldn’t be considering a moving stop. Stick to using a fixed stop to protect your account.
If you use stop-losses as part of your strategy, and not just for security in case the market goes widely unexpected, you have a better chance of shaving off some of the pips you would have otherwise lost, by bringing your stop closer in line with the broader market trend. Some trading strategies explicitly rely on using a moving stop in conjunction with a moving take profit – but they tend to be more sophisticated and require following the market regularly.
The final consideration for moving stops is that they are best used in trending markets – if the market is trading sideways, then there is little adjustment to be made according to the trend. So, if your strategy is designed with trending markets in mind, a moving stop might be more useful.
Fixed Or Moving Stop Losses
Understanding the importance of stop losses, whether you are using them just for security or as an integral part of your strategy, there is still a debate among traders about whether fixed or moving stop losses are better – or, a combination of both.
The easy way out is to say, “it depends on your trading style,” but that doesn’t help answer the question of which one is better for you. The reality is, like most things that depend on circumstances, there are pros and cons to both. Some of those advantages and disadvantages are specific to a trading style, and some are generalized.
Some traders can get locked in the idea that because they’ve found the optimal trading mechanic for themselves, this is the optimal trading strategy, and can be a little overly defensive of it, or too strident in advocating for it. Let’s forget that for a moment.
What’s the difference between moving and fixed stop losses?
A fixed stop loss is the easiest to explain: you set your stop loss when you open your trade and keep it there (or, sometimes move it up to break even when the market goes in your favor). The basic idea is that the stop loss does not respond to the market, and you’ll let it run until the trade is closed.
A moving stop loss (also sometimes a “dynamic stop loss”) responds to market conditions; that is, as the market changes, so does the stop loss in response. Now, it’s important to point out that this isn’t just moving the stop loss after the trade has been opened; it implies that the stop loss runs according to some predetermined criteria in line with a trading strategy.
For example, before opening the trade, determining an indicator of a security level, such as the 200 SMA. Thus, the stop loss is set at the 200 SMA and is adjusted according to the indicator movement. The trade will be stopped out when the market crosses the 200 SMA, regardless of what the market is doing.
The rule
The temptation that traders always have to overcome when a trade is not going their way and approaching their stop loss is to move the SL away from the market and give their trade some “breathing room.” This defeats the purpose of a stop loss. A stop-loss only works if it has defined criteria that are followed through, irrespective of the market short-term moves.
Sometimes people confuse a moving stop loss with succumbing to the temptation of “correcting” to the change in the market. It does not work that way, and a dynamic stop loss only works for traders with the discipline to keep to the rule or criteria that determines the stop-loss location.
Which one is better?
A fixed stop-loss has the advantage of a “fire and forget” feature; if you aren’t tracking the market during the whole time your trade is open, then having a fixed stop loss helps to keep your trades closing within your strategy. Primarily if you are focusing on setting your stop losses in resistance levels, which tend to remain static on account of the accumulation of orders at a certain point. Additionally, fixed stops don’t require maintenance; you just set them up once, and that’s it.
The disadvantage is that your stops don’t adjust to favorable conditions in the market; which means your cumulative pip loss could end up being higher – although, more predictable.
Moving stops have to be monitored to keep up with the change in the indicator being used to determine the stop level. Thus, they are more suited for day traders, or people who can check up on their trades frequently. As mentioned previously, they also require more discipline, since you have to move the stop every time the indicator changes, making it easy to find an excuse for yourself not to set it according to the rule.
In the end, you have to weigh the pros and cons of each to see which suits your strategy best.
A Look at the US Employment Situation Report
Why do I need to know this? I’m a technical trader!
Have you ever had one of those trading setups that boasted a staggering amount of confluence fail in dramatic fashion?
You know the kind of setup that wouldn’t look out of place as wallpaper on your mobile phone. Of course you have. We all have! One reason the area may have fell flat could have been due to a scheduled news event. Experienced traders are generally conscious of what’s ahead on the economic calendar. Newer traders, on the other hand, often unwittingly expose their positions to potentially damaging volatility around news time.
So with that being said, although you may trade using only technical analysis, knowing what news lies ahead is crucial. And in terms of economic indicators, there’s little that comes close to the mighty US employment report!
Key elements of the report
The Bureau of Labour Statistics (BLS) presents its findings at 08.30am EST, generally on the first Friday of the month using two major surveys: the household survey and establishment survey.
Both surveys are required for a complete picture of the labour market.
- The payroll survey (CES) is designed to measure employment, hours, and earnings in the non-farm sector, with industry and geographic detail. The survey is best known for providing a highly reliable gauge of monthly change in non-farm payroll employment. A representative sample of businesses in the US provides the data for the payroll survey.
- The household survey (CPS) is designed to measure the labour force status of the civilian non-institutional population with demographic detail. The national unemployment rate is the best-known statistic produced from the household survey. The survey also provides a measure of employed people, one that includes agricultural workers and the self employed. A representative sample of US households provides the information for the household survey.
Source: Bureau of Labor Statistics
The household survey gathers its data by contacting 60,000 homes concerning employment. The response is usually high. The payroll survey, however, collects its information on the job market from approximately 400,000 businesses. Only 60-70% of the responses make it back in time for the first scheduled release. As more replies filter through, this forms the basis for subsequent revisions.
Over the long run, both surveys tend to move in tandem.
The economic statistic that generates the most excitement within this report is the monthly change in non-farm employment. Other figures that warrant close attention are the unemployment rate, average hourly earnings and participation rate (commonly known as labour-force participation rate).
- Non-farm Payrolls measures the change in the number of people employed during the previous month, excluding the farming industry.
- The unemployment rate gauges the total percentage of workers that are unemployed and actively seeking employment during the previous month.
- Average hourly earnings is the percentage change businesses pay for labour (this excludes the farming sector).
- The participation rate informs investors what proportion of the work force are employed or ready and able to work.
Typically, you’ll see the USD jolt higher on better-than-expected numbers, and trade lower on the back of a less-than-stellar read. Other times, limited movement is experienced as the numbers come in as forecasted.
However, traders’ reactions to the report can, and often do, diverge. For example, there are times when the focus is on wage growth as this is the earliest monthly data released in relation to labour inflation. When businesses pay more for labour (a firms biggest expenditure), the higher costs are usually passed on to the consumer.
Trading the release
There’s no ‘right way’ to trade the US employment report as the move is dependent on several themes: market expectations, sentiment and the current focus of the central back, to name but a few.
Here are a few aspects to keep an eye on should you engage with the release:
- The US ADP non-farm employment change. This data provides an early look at employment growth, and is considered to be a precursor to Friday’s BLS (Bureau of Labour Statistics) non-farm employment change as it’s released two days before.
- Leading up to the release is when the market’s uncertainty is at its highest. Traders have no credible data to work with, other than forecasts. As such, executing trades during this time carries additional risk.
- Another point worth mentioning is that should the release show a higher reading vs. its previous value, but comes in lower than forecasted, the USD can still make a move to the upside, due to the indicator improving in actual numbers.
- Also, do remember that the non-farm payrolls report and its associated readings are considered short-term market movers. The USD often reacts immediately and generally tends to fade once the excitement diminishes.
There are a several technical trading strategies littered across the internet educating those wishing to trade the report on release. As long as you remain cognizant of the potential risk of loss, it could be a profitable endeavour. Conservative technicians, however, often wait for the dust to settle before engaging. What we mean by this is they simply take advantage of any follow-through momentum 5-10 minutes after the release.
Final words
The US employment situation report is extremely rich in detail, and would be beyond the scope of this article to demonstrate its vast expanse. But what we’ve hopefully achieved here in this short piece is highlighting some important factors to be aware of on release day!
Trading Decisions: What’s the “Best” Price to Apply?
Traders who base their trading decisions on technical analysis tools will ultimately face a few dilemmas when it comes to choosing the “best” price to apply in their technical tools calculations. Since nowadays most traders use Japanese candlesticks to understand price on their price charts, it’s important to note that there are four obvious available prices: open, high, low and close. Of course, this is the bare minimum number of choices that a trader has on the candlestick chart. There are also many different possible combinations, making the selection of the “price” a potentially difficult task – especially for beginners.
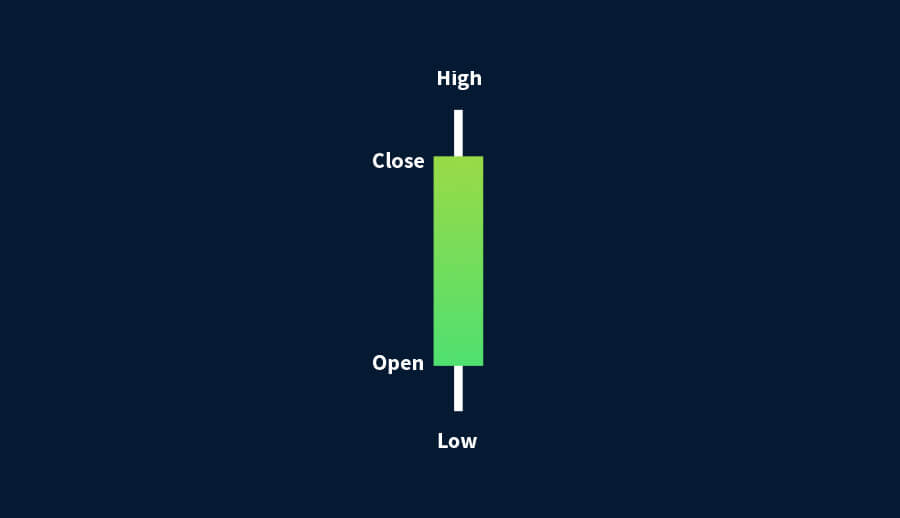
Closing price
It is no secret that a lot of traders, beginners and professionals alike, consider the closing price to be the most useful. This perception is mostly driven by stock market traders who believe that the last price of the day captures everything needed to make informed trading decisions. This includes the day’s sentiment (based on economic releases, monetary developments, political stance and, inevitably, crowd psychology), and also reflects what is anticipated to happen before the next session of the market opens.
Even Charles Dow, often considered one of the “forefathers” of technical analysis, considered the closing price to be the most important price of the day. But how should those trading foreign exchange approach the closing price? Unlike the stock market, which is not open 24 hours and instead opens at a certain time in the morning and closes at a certain time in the afternoon, the foreign exchange market is open 24/5. It is a continuous market without any set opening and closing times!
What the foreign exchange markets offers instead of set opening and closing times are different timeframes. Each candlestick represents the price activity over an adjustable amount of time: namely, 1 minute, 5 minutes, 15 minutes, 30 minutes, 1 hour, 4 hours, 1 day, 1 week and 1 month. Forex traders can treat the close price at the completion of a candlestick in much the same way as stock traders do in the stock market.
Other price options
So, irrespective of the market that one trades, the question persists: what is the “best” price to use? For that reason, trading platforms offer a few choices:
- Open
- High
- Low
- Close
- Median
- Typical
- Weighted Close
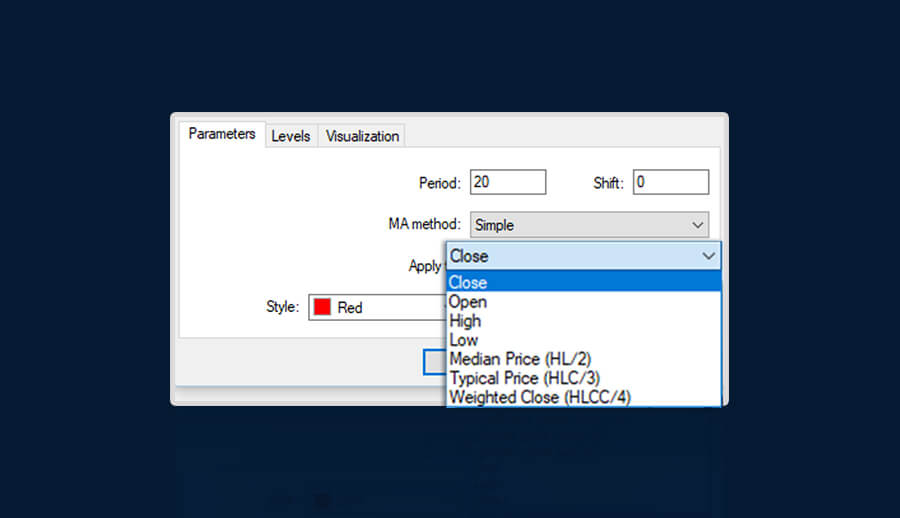
One could argue that the choice is subjective, but I believe that there are cases where one price is better than another.
One way to choose the “best” price is by market convention. For example, in the stock market the majority of the traders observe the daily closing price, so it can often make sense to use it when calculating technical tools as well.
Open price
On the other hand, the open price represents the reaction of traders to any developments since the last close. The Market Profile methodology makes use of the open price to provide clues for market reactions.
Median price
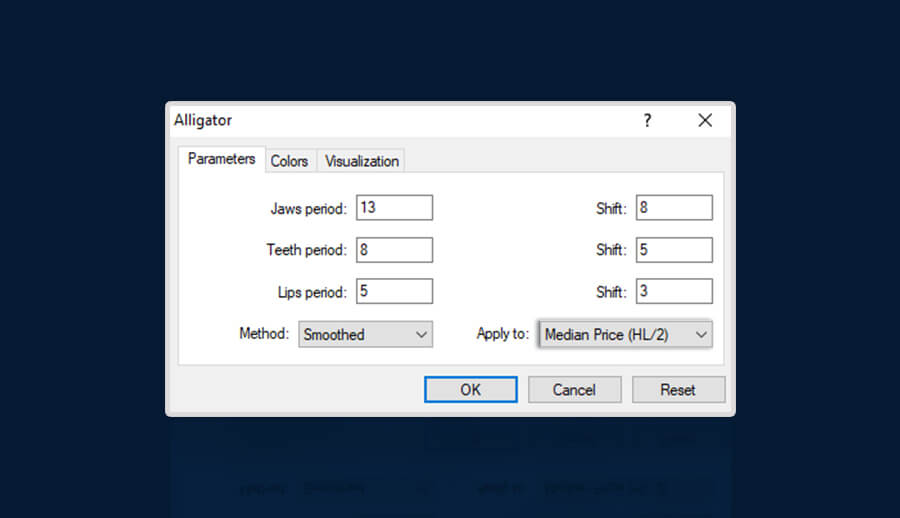
Traders can also choose the midpoint of a candlestick – that is, (high + low) / 2 – instead of relying on just one price; this is the median price. The Alligator indicator makes use of the median price to calculate the lips, teeth and jaws.
Typical price
Another way to account for the two extremes of prices during a session (high and low), as well as the closing price, is to use the typical price. The formula for the typical price is (high + low + close) / 3.
Weighted close price
Furthermore, since the closing price is considered by a respectable number of traders to be the most important, it is not surprising that the weighted close price is another popular choice when it comes to making trading decisions. For this, the formula is (high + low + close + close) / 4. It’s simple to see that there is more emphasis on the close price, compared to the rest of the prices. Moreover, support and resistance lines are drawn including the high or low price of a candlestick. Likewise, price confirmation of candlestick patterns observes the high and low price.
Therefore, when it comes to making trading decisions, there is no one “best” price to apply when calculating a technical tool or drawing a technical line or object. The choice may be indeed purely subjective. In other cases, it can be decided on market convention or based on just mathematics. The choice is yours!
Forex Forecast and Cryptocurrencies Forecast
First, a review of last week’s events:
EUR/USD. Our forecast for relatively weak labor market data turned out to be 100% correct. ADP and ISM in the service sector were not pleasing either, and one of the key indicators, NonFarm Payrolls, fell from 237K to 155K, that is, by as much as 35%.
The forecast regarding consolidation of the pair in the area of 1.1350 turned out to be correct as well: last week it switched to lateral movement in channel 1.1310-1.1415 with Pivot Point in the area 1.1350-1.1360.
The difference between the weekly high and low barely exceeded 100 points, although it seemed that there were quite a lot of important events during these days. These are the above-mentioned statistics on the US labor market, supplemented by a decrease in the country's GDP, and the OPEC meeting and Iran’s petroleum statement, and the arrest by the US law enforcement agencies of the financial director of Huawei Meng Wanzhou... But the pair reacted quite calmly to all this. The reason for this seems to be only one: the approach of Christmas, the time when the sharks of the market sum up their annual results and no longer want to make any sudden movements;
GBP/USD. This pair also behaved quite calmly, although with a slightly higher volatility: the swing of oscillations was about 180 points. The expected fall to 1.2600-1.2620 did not take place, and the pair, barely reaching 1.2655, turned around and left for Pivot Point of the week, ending the five-day period at 1.2725;
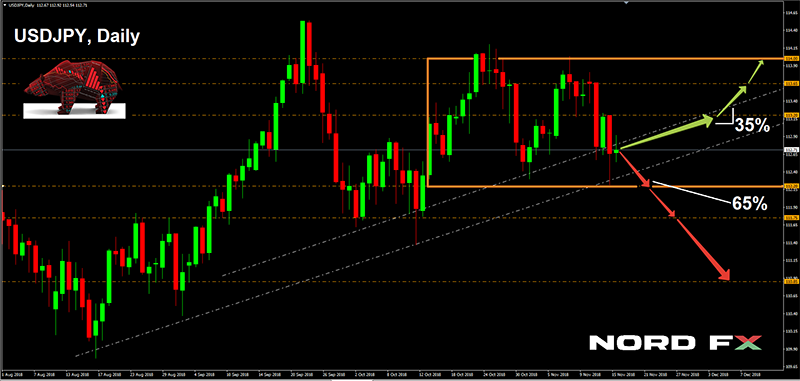
USD/JPY. Last week, expert opinions were equally divided: one half voted for the pair’s growth, the second one was for its fall. In this situation, we advised to move from weekly to longer-term forecast, and we were right. Here, the picture was already different: most analysts (65%), supported by graphical analysis, expected the yen to strengthen and the pair to decline to the 112.00 zone. This was what happened: having won back the losses of the previous two weeks, it reached the level of 112.20. The pair met the end of the trading session at the level of 112. 70, that is, in the same place where it was already trading in the middle of November;
Cryptocurrencies. There’s really nothing to say: the graphs vividly confirm that the worst predictions are coming true. 60% of experts predicted a further drop in Bitcoin, and on Friday evening, it recorded another annual low at around $3,275, having lost another 16% in seven days. Following the “reference” (now in quotes) cryptocurrency, the altcoins fell further down. Ethereum (ETH/USD) fell by 24% during the week, Litecoin (LTC/USD) - by 26%, and Ripple (XRP / USD) - by 18%.
According to Ernst & Young, 86% of all coins are now trading significantly lower than the originally declared value, and the crypto market capitalization fell to $113 billion, having lost exactly 700 billion in 11 months (86%).
As for the forecast for the coming week, summarizing the opinions of a number of analysts, as well as forecasts made on the basis of a variety of methods of technical and graphical analysis, we can say the following:
EUR/USD. As has already been mentioned, it is time for the market to record annual profits. Or losses (it depends). However, the coming week is expected to see a number of macroeconomic data, which may still affect the change in quotations.
Thus, on Wednesday, December 12, there will be data on inflation in the United States, and the higher it turns out, the higher the likelihood of interest rate increases, the better the dollar will feel. In the meantime, judging by the futures, players and investors do not particularly expect that the Fed will raise rates in March next year.
On Thursday, December 13, a decision is expected on the interest rate in the Eurozone. Most likely, nothing will change, and the rate will remain at zero, so more attention should be paid to the subsequent press conference of the ECB President Mario Draghi.
On Friday, we expect statistics on retail sales in the United States. And, of course, the market will closely watch the reports from the theater of operations of the American-Chinese trade war throughout the whole week. Another aggravation in this conflict was caused by the arrest of Huawei's CFO, and everyone is waiting to see what President Trump does in this situation.
In the meantime, the overwhelming majority of experts and indicators have taken a neutral position. The bulls have a very small advantage, calling the area 1.1500-1.1550 as their target. Supports are at levels 1.1265 and 1.1215. The basic forecast almost repeats the scenario of the past week: the movement in channel 1.1310-1.1415;
GBP/USD. Here, analysts' forecast is similar to what has been given for EUR/USD: the advantage of the bulls is only 5%. But almost 90% of trend indicators and 70% of oscillators are colored red. The formation of trends may be affected by the data on the UK GDP, which will be released on Monday December 10, and the data on average wages on Tuesday December 11. But of interest is the vote on Brexit in the British Parliament, which will take place at the same time, on Tuesday. Recall that, according to forecasts, the parliamentarians may not approve the Agreement on the terms for leaving the EU, and then a second vote will be scheduled for February 2019, which will play against the pound. The support levels are 1.2660, 1.2540 and 1.2500, the resistance levels are 1.2810, 1.2850, 1.29250;
USD/JPY. On Monday, December 10, statistics on Japan’s GDP will be published and, strictly speaking, these are the only data from the country of the Rising Sun that may affect the pair’s quotes. Investors pay much more attention to the trade war between China and the United States and the use of the yen as a safe haven currency. That is why most experts (65%), with the support of trend indicators, vote for the strengthening of the Japanese currency and the reduction of the pair to at least 112.20 support. The next support is on horizon 111.75, then 110.85. As for the resistances, they are in the zones 113.20, 113.65 and 114.00.
Graphical analysis also indicates a fall of the pair. However, on H4 it assumes that at first it will rise to the height of 113.10, only then it will turn to the south.
Cryptocurrencies. The states increasingly clamp the market which had initially been decentralized, in the grip of regulation, which creates an additional negative news background. This is what the crypto community is expecting soon:
In South Korea, a tax on income from operations with cryptocurrency is planned to be introduced; in Japan, in addition to the state registration of all ICOs, crypto exchanges will be obliged, upon request of the tax authorities, to disclose information on customer incomes; in Singapore, all ICO market participants must now obtain a license and take measures to combat money laundering; Switzerland is also planning a number of legislative amendments. And so on.
It is highly likely that, recognizing the benefits and possibilities of blockchain, many states intend to put an end to the current crypto freedom and begin to issue their own digital money (which Honduras and Iran have already taken up). But this is not a one-day deal.
In the meantime, analysts' opinions are distributed as follows: 65% expect a further fall to $2,500-3,000, 25% have voted for the side trend along the $3,000 horizon and 10%, as before, remain optimistic, expecting Bitcoin to return to the levels of $4,000-5,000 in the medium term.
EUR/USD Weekly Outlook
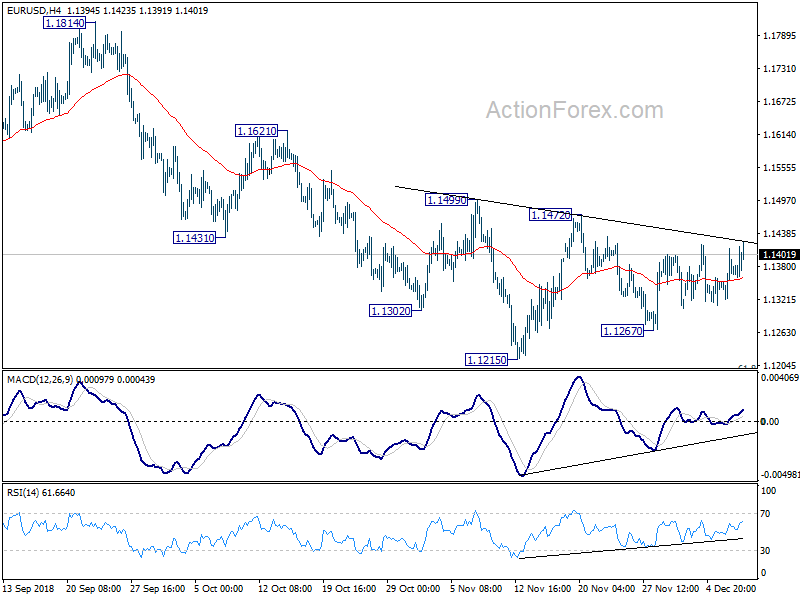
EUR/USD was bounded in range of 1.1267/1472 last week and outlook is unchanged. Initial bias stays neutral this week first. As long as 1.1472 resistance holds, deeper decline is expected in the pair. On the downside, break of 1.1267 will target 1.1215 low first. Firm break there will resume larger down trend from 1.2555 for 1.1186 fibonacci level next. However, considering bullish convergence condition in daily MACD, firm break of 1.1472 will be suggest medium term bottoming and turn outlook bullish for 1.1814 resistance instead.
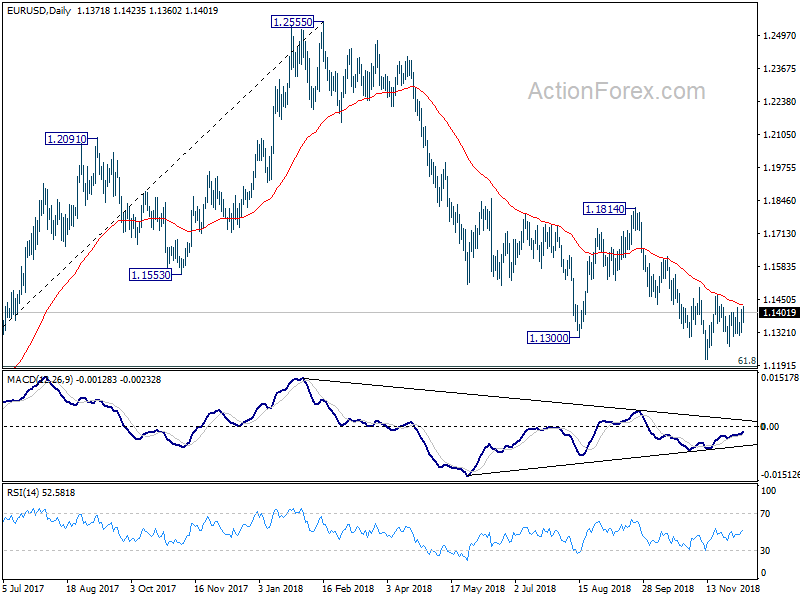
In the bigger picture, as long as 1.1814 resistance holds, down trend down trend from 1.2555 medium term top is still in progress and should target 61.8% retracement of 1.0339 (2017 low) to 1.2555 at 1.1186 next. Sustained break there will pave the way to retest 1.0339. However, break of 1.1814 will confirm completion of such down trend and turn medium term outlook bullish.
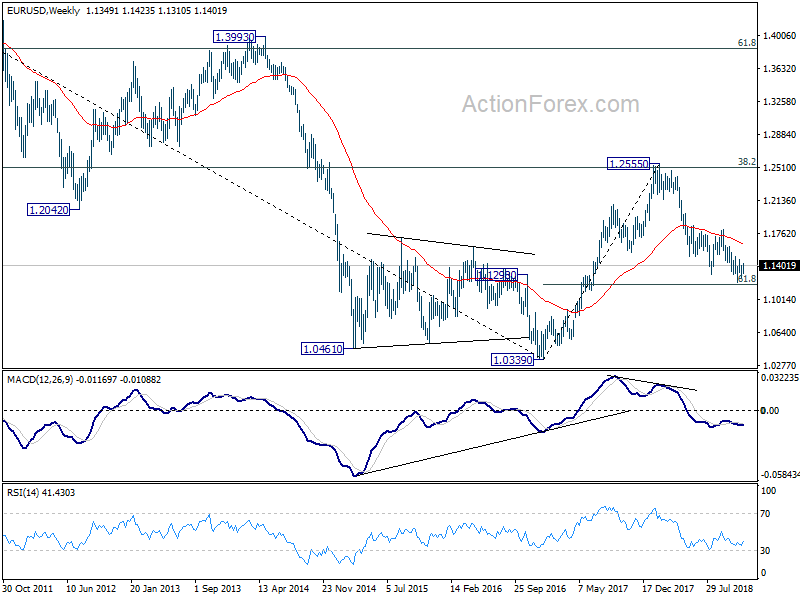
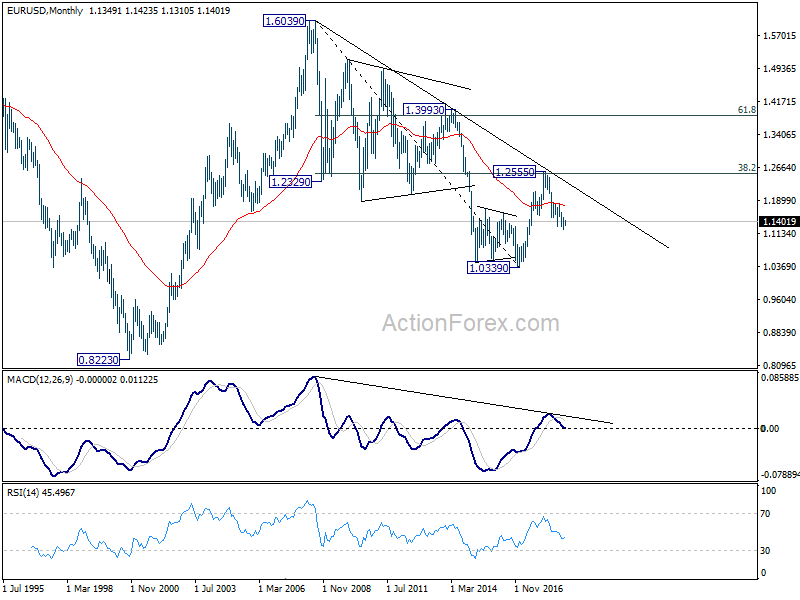
In the long term picture, the rejection from 38.2% retracement of 1.6039 to 1.0339 at 1.2516 argues that long term down trend from 1.6039 (2008 high) might not be over yet. EUR/USD is also held below decade long trend line resistance. Firm break of 61.8% retracement of 1.0339 to 1.2555 at 1.1186 should at least bring a retest on 1.0339 low. This will remain the favored case as long as 1.1814 resistance holds.
USD/JPY Weekly Outlook
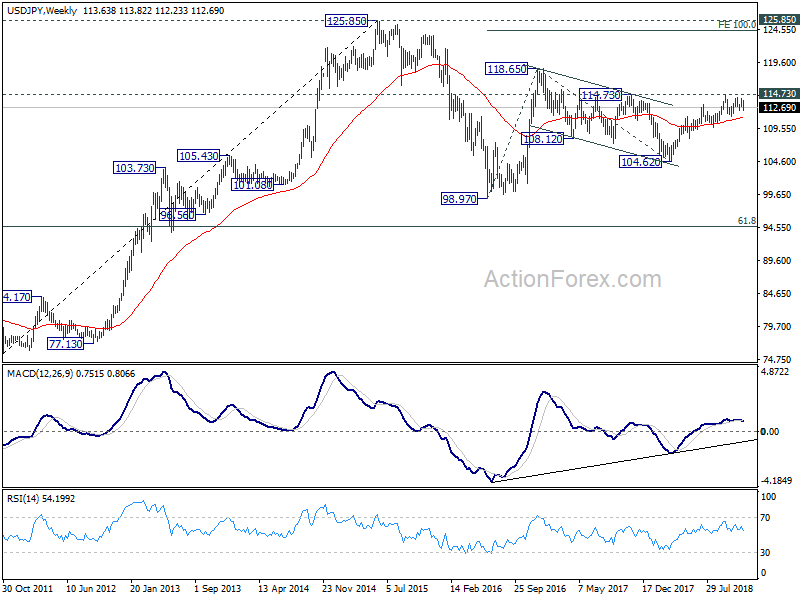
USD/JPY dropped to 112.23 last week but recovered since then. Initial bias is neutral this week first. As long as 113.24 minor resistance holds, another fall is mildly in favor. On the downside, break of 112.23 will target 111.37 and possibly below. But still, price actions from 114.54 are seen as a consolidation pattern. Hence, even in case of deep decline, downside should be contained by 38.2% retracement of 104.62 to 114.54 at 110.75 to bring rebound. Larger rise from 104.62 is expected to resume later. On the upside, above 113.24 minor resistance will turn bias back to the upside for 114.03 resistance.
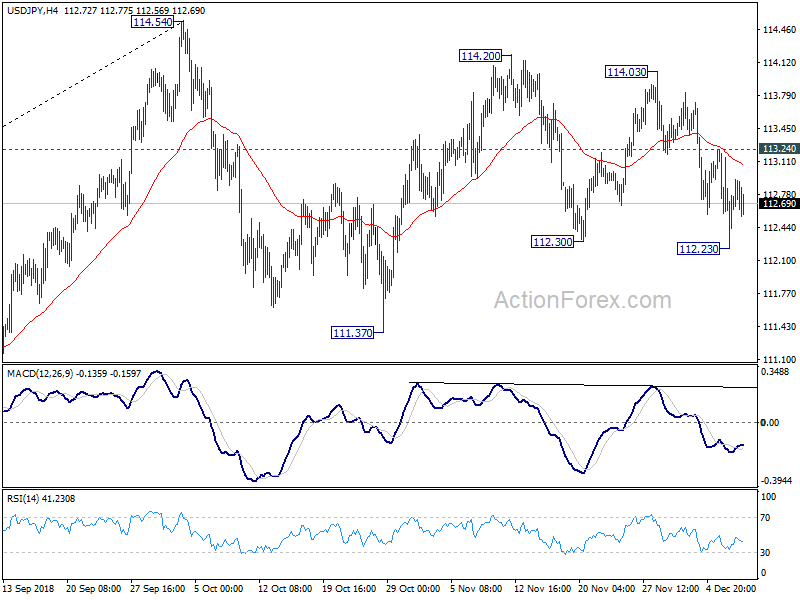
In the bigger picture, corrective fall from 118.65 (2016 high) should have completed with three waves down to 104.62. Decisive break of 114.73 resistance will likely resume whole rally from 98.97 (2016 low) to 100% projection of 98.97 to 118.65 from 104.62 at 124.30, which is reasonably close to 125.85 (2015 high). This will stay as the preferred case as long as 109.76 support holds. However, decisive break of 109.76 will dampen this bullish view and turns outlook mixed again.
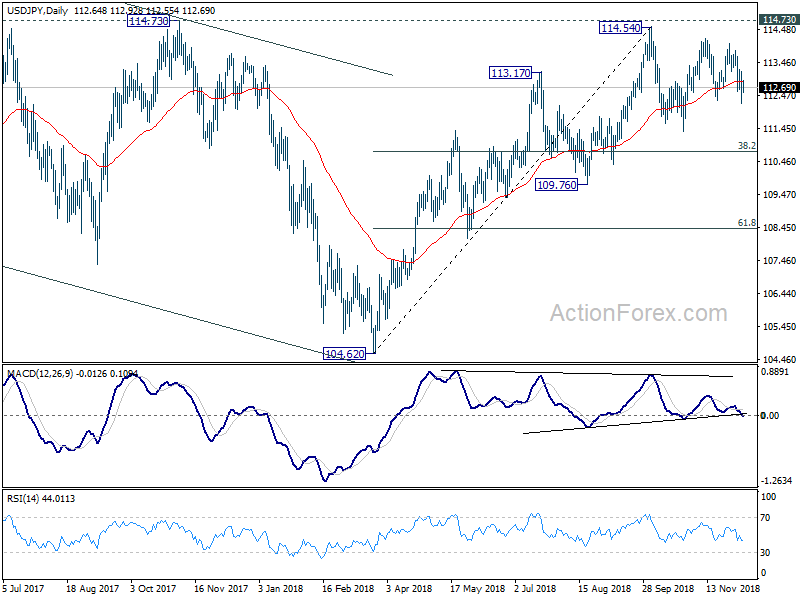
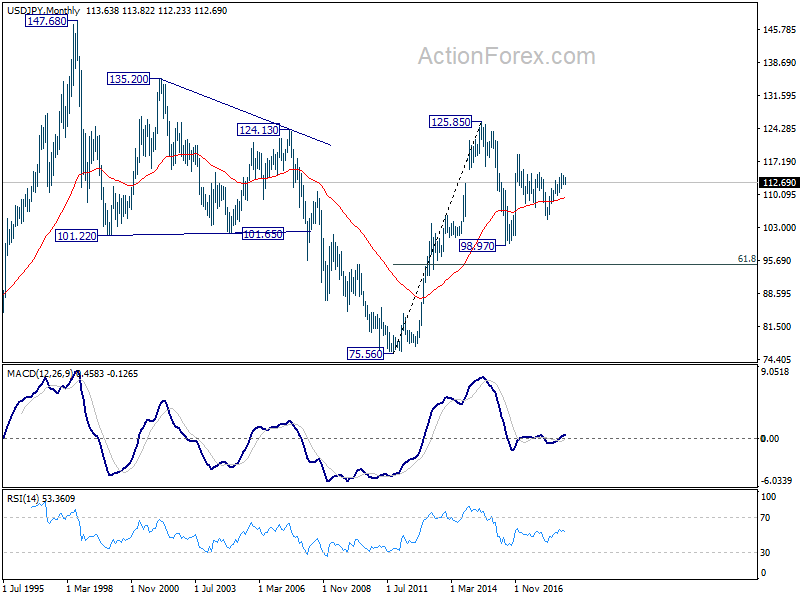
In the long term picture, the rise from 75.56 (2011 low) long term bottom to 125.85 top is viewed as an impulsive move, no change in this view. Price actions from 125.85 are seen as a corrective move which could still extend. In case of deeper fall, downside should be contained by 61.8% retracement of 75.56 to 125.85 at 94.77. Up trend from 75.56 is expected to resume at a later stage for above 135.20/147.68 resistance zone.