

Sample Category Title
Week Ahead – Pound to Take Centre Stage as Brexit Vote Looms; ECB Meets Amid Worsening Eurozone Outlook
The pound looks set for even choppier times as British MPs will next week get to vote on Theresa May’s much criticized Brexit deal, while there will also be a flurry of UK data for traders to keep up with. The euro will also be in focus as the European Central Bank is due to hold a scheduled policy meeting. The Swiss National Bank will be another central bank deciding on rates next week. In the US, inflation and retail sales figures will be the main releases.
Japanese Q3 GDP likely to be revised down
Japan’s economy is predicted to have contracted more than expected in the third quarter, with consensus forecasts for GDP growth of -1.9% annualized rate versus initial estimates of -1.2%. While growth is forecast to bounce back in the final quarter, many analysts are now anticipating a weaker rebound as the outlook for the world economy deteriorates. The GDP revisions are due on Monday and will be followed by November corporate goods prices and October machinery orders on Wednesday.
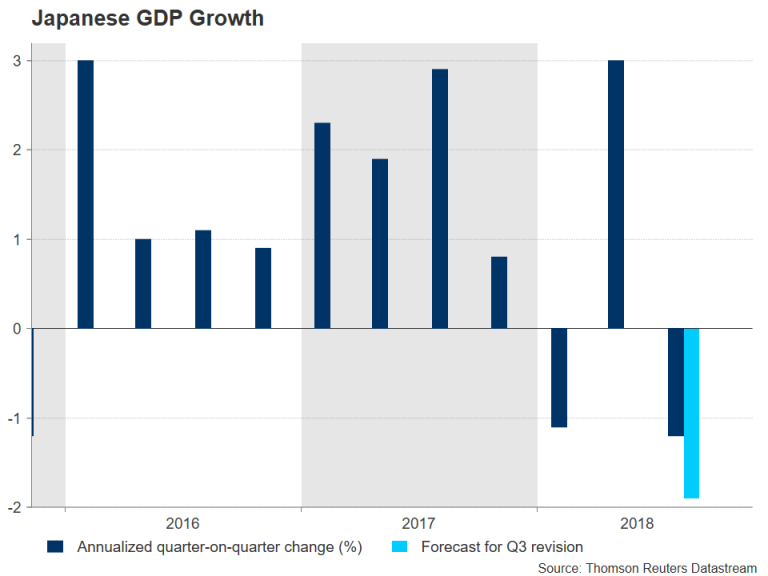
Also on investors’ watchlist will be the Bank of Japan’s quarterly Tankan survey for the fourth quarter on Friday. The outlook survey is seen as a good indicator for business sentiment in Japan across different sectors of the economy, as well as on future spending plans by both small- and large-sized firms. Other data on Friday will include the flash manufacturing PMI for December and revised industrial output estimate for October.
A poor set of figures could help alleviate some of the upside pressure on the yen stemming from safe-haven flows generated by this week’s widespread risk averse mood. However, even a positive surprise in the numbers is unlikely to change much the picture for the Bank of Japan, which this week once again pledged to maintain its ultra-loose monetary policy until inflation has reached its 2% target.
Chinese data to point to steady growth
As investors grow increasingly wary of the shaky trade truce between the US and China, economic indicators out of China next week are not expected to produce anything out of the ordinary. The possible upset though could come from Sunday’s price gauges. Producer prices are forecast to rise by 2.7% year-on-year in November, easing from the prior 3.3%. Softer producer prices are seen as a sign of weakening factory demand for raw materials and a bigger fall could further raise concerns about the strength of the Chinese economy. Consumer prices are also expected to moderate, from 2.5% to 2.4% in November.
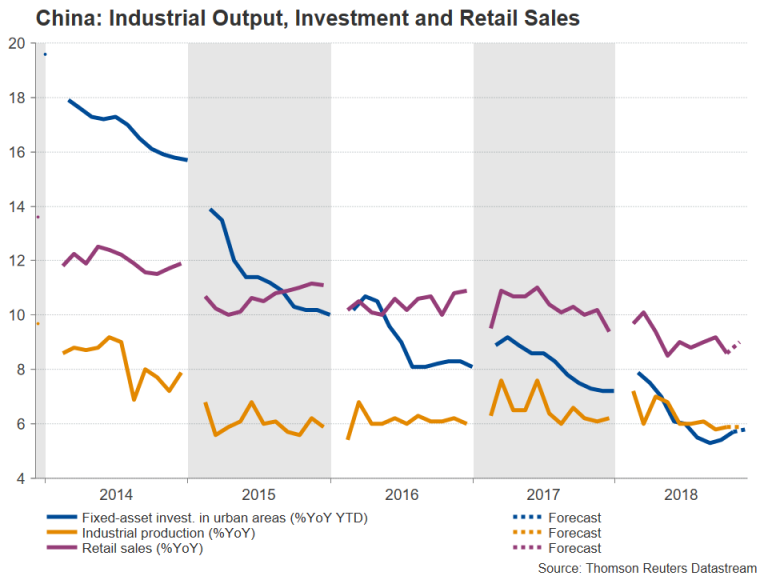
The remaining data are due on Friday and will consist of fixed-asset investment, industrial output and retail sales. Fixed-asset investment in urban areas is forecast to recover further from August’s record low of 5.3% to 5.8% y/y in the year-to-date to November. Industrial output, meanwhile, is projected to hold steady at 5.9% and for retail sales growth to improve to 9%.
ECB meets as growth outlook complicates stimulus exit plan
The highlight on the Eurozone calendar will the ECB’s policy meeting on Thursday, but before then, traders will be able to sift through some economic data out of the bloc. German trade figures are due on Monday and investors will be watching to see if exports posted an increase in October after shrinking in September. The Eurozone sentix index is also out on Monday, and on Tuesday, attention will fall on Germany’s ZEW economic sentiment gauge for December. Euro area industrial production numbers for October will follow on Wednesday and finally on Friday, all eyes will be on the IHS Markit flash PMIs for December. The Eurozone’s composite PMI is expected to edge up for the first time in four months in December, to 52.8.
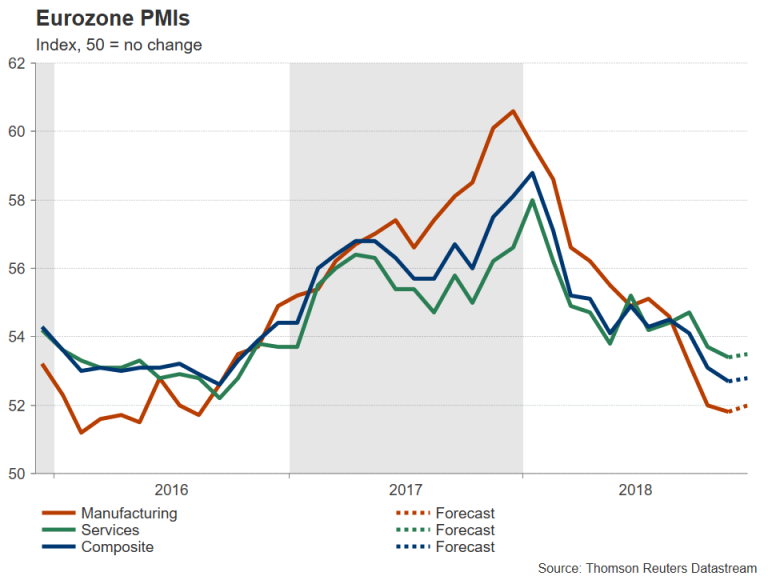
However, this would probably not be enough to allay ECB policymakers’ concerns of a prolonged slowdown in the Eurozone. And although Mario Draghi could strike a more cautious tone at his post-meeting press conference on Thursday, he is unlikely to signal any change of path in the ECB’s policy normalization plans just yet. Still, even if the ECB keeps policy and its forward guidance unchanged, the euro is at risk of coming under selling pressure from any dovish remarks by the ECB chief, as well as from downward revisions to the ECB’s quarterly staff projections.
SNB and Norges Bank also gather to set rates
Both the Swiss National Bank and the Norges Bank are expected to hold their benchmark rates steady on Thursday. But like the ECB, Switzerland’s and Norway’s central banks could point to increased downside risks and this could weigh on the Swiss franc and the Norwegian krone.
For the SNB, the Swissie’s appreciation against the euro during 2018 will be an ongoing concern, while a shock contraction in Swiss GDP in Q3 makes an earlier-than-expected rate increase even less probable. In Norway, the exchange rate is not as much of a problem as the Norwegian krone has depreciated significantly versus the euro over the past month due to the slide in oil prices. But the prospect of weaker oil prices could weigh on the economy, making it harder for the Norges Bank to stay on its current projected rate hike path.
Brexit chaos and string of UK data to keep pound under spotlight
UK prime minister, Theresa May, faces a make or break week as all indications are that she is set to lose the vote in Parliament on the Brexit deal she negotiated with the EU. The vote, scheduled for December 11, is now at risk of being delayed and May could use the EU summit on December 13-14 to ask her fellow leaders for more concessions on the Northern Irish backstop issue. British MPs across different parties are united in their opposition to signing up to the backstop arrangement, which could legally tie the UK to the EU’s customs union indefinitely if a solution on maintaining no hard border cannot be agreed on.
With the range of scenarios that could play out from next week’s events, including a second referendum and May stepping down, being so wide and numerous, some investors could decide to sit on the sidelines until some of the uncertainty has dissipated. That could partially explain why the pound has been range-bound this week despite the deepening political turmoil in Britain.
It could also mean UK data next week struggling to see much market reaction. The UK calendar will get off to a busy start on Monday with monthly GDP and trade numbers, as well as industrial and manufacturing output figures. The UK’s GDP is forecast to have expanded by 0.1% month-on-month in October, pointing to a muted start to the fourth quarter. The other important release to watch on Monday will be the industrial production report. The industrial sector probably eked out growth of 0.1% in October, but output in the manufacturing sub-sector is expected to have been flat.
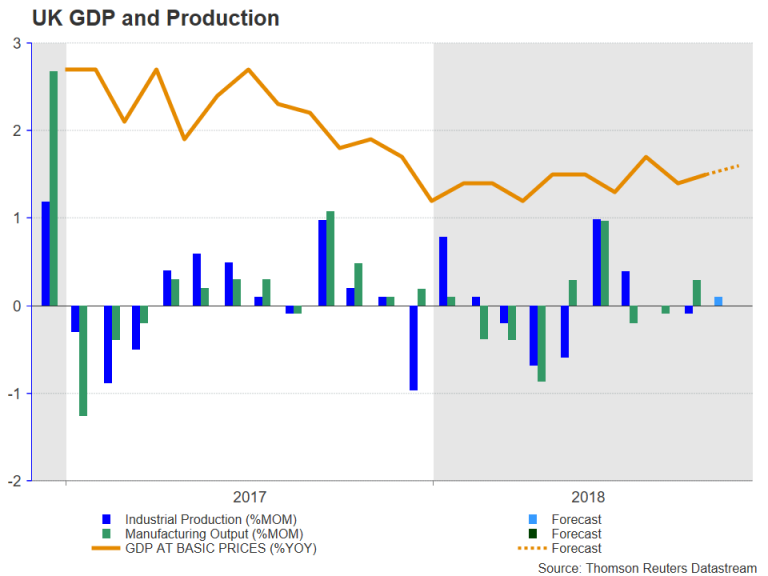
Then on Tuesday, UK jobs stats will be looked at to see if the labour market is continuing to tighten or if the Brexit uncertainty has started to hurt firms’ hiring plans. The unemployment rate is expected to hold at 4.1% for the three months to October, while average weekly earnings are forecast to stay at the three-year high of 3% y/y for the same period.
US inflation and retail sales in focus
As speculation grows that the Federal Reserve could soon be pressing the pause button on its rate hike cycle, inflation and retail sales numbers out of the United States next week will be monitored closely for clues on the robustness of the US economy.
Ahead of those numbers though, are the JOLTS job openings on Monday and producer prices on Tuesday. The CPI report will follow on Wednesday where the headline rate is forecast to ease to 2.2% y/y in November from 2.5% previously, possibly on falling gasoline prices. The core rate, however, is anticipated to inch up to 2.2% y/y from 2.1%. Although underlying inflation is not typically affected by fluctuations in oil prices, at least not in the short term, a prolonged or large drag on consumer prices from lower energy prices could worry the Fed and that in turn would weigh on the US dollar.
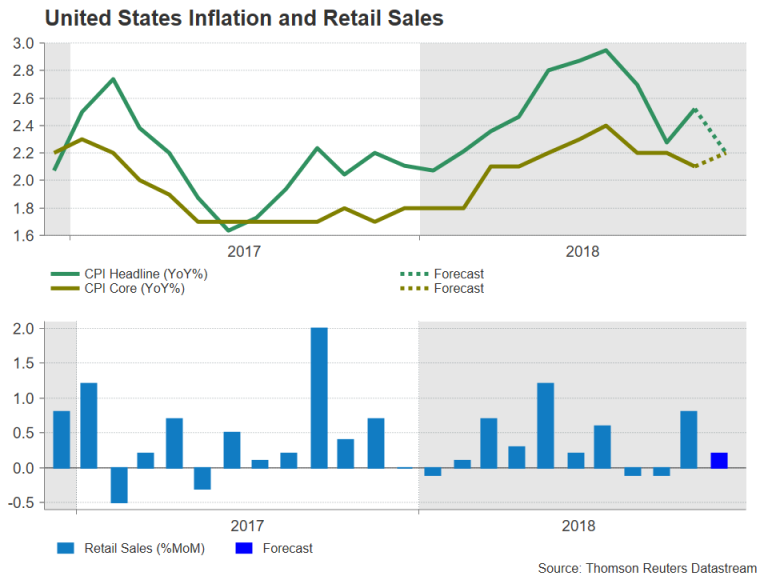
On Thursday, retail sales figures are expected to show sales rising by 0.2% m/m in November, moderating from the prior 0.8%. Other data to keep an eye on are the November industrial output and IHS Markit’s flash December PMIs on Friday.
Australia & New Zealand Weekly: Key Market and Economic Views for 2019 and 2020
Week beginning 10 December 2018
- Key market and economic views for 2019 and 2020.
- Australia: Westpac-MI consumer sentiment, AusChamber-Westpac survey, housing finance, RBA Assistant Governor Kent speaks, NAB business survey.
- NZ: Half-Year Fiscal and Economic Update, RBNZ Governor Orr testimony before Parliament, retail card spending, house prices and sales.
- China: retail sales, industrial production, fixed asset investment, CPI.
- Europe: ECB policy decision, flash PMI.
- UK: Parliamentary vote on Brexit.
- US: CPI, retail sales, flash PMI.
- Key economic & financial forecasts.
Information contained in this report current as at 7 December 2018.
Key Market and Economic Views for 2019 and 2020
Prospects for the RBA Cash Rate
Developments in this last week have significantly changed the "atmosphere" around the outlook for the RBA's cash rate.
The RBA has been consistently signalling that growth in the Australian economy will remain comfortably above potential in both 2018 and 2019. It has also repeatedly speculated that while there is no immediate urgency to move rates, the next move was more likely to be up rather than down.
Westpac has been sceptical about both assertions maintaining its call that growth in 2019 was likely to be "around potential", and that through both 2019 and 2020, the cash rate was expected to remain on hold.
To our knowledge, we have been the only forecaster consistently promoting that view with others, including markets, expecting higher rates through 2019 and beyond. As recently as last month, markets were positioned with a 75% probability for an RBA rate hike by end 2019.
As discussed below, the GDP report, which printed on December 5, is most likely to prompt a major review of the RBA's growth forecasts with 2018 growth expected to be revised to 3% (only 0.25% above potential) and 2019 growth back at around potential.
With the Xmas break looming, these revisions are unlikely to be formalised before the next Statement on Monetary Policy on February 8.
Related to this likely change in forecasts is a more balanced approach to the outlook for rates. In a speech on December 6 (and during the Q&A session) Deputy Governor Debelle noted that "There is still scope for further reductions in the policy rate. It is the level of interest rates that matters and they can still move lower." This sentiment is likely to see the Bank indicate a different approach to rates with the risks being evenly balanced.
Critically, the Bank will be assessing the impact of falling house prices and tighter credit on the real economy.
The Bank is not convinced about a significant wealth effect; is unsure about the "right" level of household debt in the economy; is unclear about the current scenario where the unemployment rate is falling while house prices are falling; and is uncertain about how the current house price cycle will evolve given that previous cycles have seen affordability restored through multiple rate cuts rather than specifically through price adjustments.
Given these uncertainties it would be reasonable to back away from the expectation that the next move in the cash rate will be up.
In addition, in 2019 the Australian economy will be challenged by the political uncertainty of an election campaign and the ongoing threats from a global economic slowdown.
On the other hand there continues to be optimism about jobs growth; consumer and business confidence; booming government infrastructure investment; strong services exports; and a likely substantial fiscal stimulus from the upcoming Commonwealth Budget on April 2.
A Surprise Domestic Growth Slowdown
Growth in the Australian economy slowed to 2.8% in the September quarter. There were a number of significant developments in the GDP report.
Firstly we saw the first "negative" on new dwelling construction in the quarter following a particularly strong first half. Westpac expects this will be the start of a long run of falls in residential construction reflecting the downturn in dwelling approvals and the expected further contraction in dwelling approvals as tight funding conditions and falling house price expectations deter new construction.
Secondly, we saw a particularly weak print on consumer spending reflecting weak income growth (real household disposable income was flat over the year to date) and a decade low savings rate.
Wages growth is lifting only very slowly while strong employment growth is expected to slow in 2019 as political uncertainty weighs on the confidence of business. There is also likely to be some wealth effect on consumption through 2018 H2 and 2019 as the impact of falling house prices on households' balance sheets plays out.
Non-residential construction is also falling – down from the surge in activity we saw in 2017, although we expect this to stabilise through 2019.
Overall, we expect growth in 2018 will print around 3% with the 4% annualised momentum in the first half slowing to 2% in the second half. We expect growth to slow in 2019 to 2.6% following ongoing contraction from new dwelling construction; continuing below trend growth in consumer spending; and uncertainties around the Federal election and the global economy.
House prices will be important in 2019. Even though prices have fallen by 9.6% from their peak in Sydney and 5.8% in Melbourne, these adjustments follow cumulative increases in Sydney (40%) and Melbourne (32%) over the previous four years. Affordability is still stretched in both cities.
Unlike previous cycles where affordability was boosted by sharp reductions in interest rates and strong (4% wages growth) income growth, the necessary restoration of affordability in this cycle will need to come from prices.
The additional complication is that even if affordability has been restored and buyers are attracted back into the market, credit is being tightened by the banks. As we have recently seen in Perth, affordability can be restored but prices can still fall further if credit is tightened.
On the positive side there are other construction cycles which are likely to continue to boost growth. Government infrastructure spending, in particular, continues to lift; we are at the bottom of the mining investment cycle and positive prospects particularly around iron ore and lithium are boosting investment plans.
The September quarter GDP print will come as a disappointment to the Reserve Bank. Recall that in the Governor's Statement on Tuesday, he noted that "one continuing source of uncertainty is the outlook for household consumption".
Note that the Bank's forecast for GDP growth in 2018 which appeared in the November Statement on Monetary Policy was 3.5%. With the first three quarters of the year totalling 2.2%, the December quarter would have to print growth of 1.3% (a 5.2% annualised growth pace) – a highly unlikely event. We can expect the Bank to lower its forecast for GDP growth in 2018 from 3.5% to 3.0% when it next releases its forecasts on February 8, 2019.
That forecast will then challenge the 2019 forecast of 3.25% which appeared in the November Statement. It was reasonable for the Bank to assume some slowing between 2018 and 2019 (Westpac's growth forecast for 2019 has been 2.7%) particularly with a more clouded outlook for global growth and a likely accelerated contraction in residential investment. That would immediately push the likely 2019 forecast back to around Westpac's forecast of 2.7%.
So, although we did not get a growth assessment from the Deputy Governor in his speech on Thursday, the GDP print is likely to change the Bank's growth rhetoric of strongly above trend to slightly above trend drifting back to trend in 2019.
Westpac has consistently forecast that the cash rate would remain on hold through 2019 and 2020. If we are right that the Bank will revise down its growth forecasts on the basis of this result, then lower expected growth momentum going into 2020 may also temper the Bank's attitude to rates in 2020 as well.
From our perspective, a central bank forecasting growth around trend rather than well above trend is much less likely to feel the "responsibility" to normalise rate settings.
The Market is Too Cautious on the Federal Funds Rate
With this domestic growth profile as a backdrop, we confirm our long held views that the Reserve Bank will keep the cash rate on hold through 2019 and 2020.
The RBA's on hold decision will also be backed up by slowing global growth, particularly in 2020 when the US economy will slow back to trend growth of around 1.75% from an above trend 2.5% in 2019 and near 3% in 2018.
Furthermore, the first half of 2019 will see markedly faster growth than the second half when, in particular, the interest rate sensitive parts of the economy (housing and durables) will be weak and employment growth will slow. Despite the fading of the tax cuts, we believe rising wages and strong employment growth will boost household incomes in 2019, supporting solid consumer spending, particularly in services.
Although fiscal policy is currently scheduled to be tightening in late 2019, with a range of spending programs scheduled to expire, we expect that the authorities will find ways to extend them into the Presidential Election year (2020) taking some pressure off the economy and, in part, ensuring a soft landing for the US economy in 2020.
Unlike current market assessments of a potential inverse yield curve, we expect that the Federal Reserve will be able to pause earlier than has been experienced in previous cycles ensuring that soft landing.
With this growth profile in mind, we expect that the last hike from the FOMC will be in September 2019. By that time, employment growth will have slowed from 2% in the second half of 2018 to 1%, providing the FOMC with the opportunity to go on hold around a neutral setting – full employment; trend growth; and 2% inflation.
That timing implies four more hikes, beginning in December 2018. Markets are currently pricing one hike in December 2018 and only one more through 2019, indicating that we expect a sharp market surprise around the policy approach from the Fed.
In turn, this "surprise" is likely to see higher US bond rates and a stronger US dollar. We confirm our expectation that the US 10 year bond rate will lift to around 3.5% by the second half of 2019 and the USD Index will appreciate a further 3-4% by the September quarter.
The time for a sustainable fall in bond rates and the USD will be around the time of the FOMC pause, rather than the current circumstances when the US economy is growing near 3% and wage inflation risks are apparent.
Trade Policy and China are major risks
The biggest risk to this fairly benign outlook for the US economy is trade policy.
It seems unlikely that the Chinese authorities will be prepared to make the specific changes to their industry and trade policy that would specifically satisfy the US needs. These would include changes to forced technology transfer, intellectual property protection, non-tariff barriers, forced joint venture investment, cyber intrusions and government industry subsidies.
Consequently, trade disruptions are a certain theme through 2019 although President Trump and China are likely to find ways to avoid the US imposing tariffs on the remaining goods imported to the US from China that are not affected by tariff decisions to date. However, we believe a lift of the most recent 10% tariff on $200bn of trade could be increased to 25%.
We have seen that trade concerns have also weighed on the Chinese economy. Other more significant drags on Chinese growth have been winding back the shadow banking system and pollution policy. Credit policies to direct more growth into the regulated banking system; a more liberal approach to pollution policy; and direct fiscal stimulus will all be used to maintain a managed slowdown in China. We are targeting a 6.1% growth rate in 2019 from 6.4% in 2018.
Other regions are less important to the overall global view. Emerging markets will suffer under the weight of rising US interest rates and a higher USD. Japan will be preparing for the introduction of a new consumption tax and Europe will be impacted by the China/emerging markets slowdown; supplemented by Brexit; Italian instability; political unrest in France and Germany; and a gradual tightening of monetary policy as the ECB halts its balance sheet expansion from the beginning of 2019.
Australian Dollar and Commodities
Our RBA cash rate forecasts are lower than the market (which is still priced for a rate hike in 2020) whereas our federal funds rate forecasts are much higher.
That has implications for our views on the AUD with interest rate differentials continuing to favour the USD. We expect the AUD to fall to around USD 0.68 by September next year before recovering as the FOMC goes on hold.
Commodity prices will be the other key driver of the AUD.
On the supply side, an easing in China's pollution policies will weigh on commodities, while we expect some loosening in the strict production guidelines at the majors to also support a lift in supply. With demand softer, we expect some modest weakness in commodity prices through 2019 and 2020.
The week that was
The lead-in to Australian GDP each quarter creates considerable expectation. In this instance, the outcome was a thorough disappointment, owing to weak consumer spending and incomes.
Following a 0.9% gain in the June quarter, GDP growth came in at just 0.3% in the three months to September. As a result, annual growth slowed from 3.1% (revised from 3.4%) to 2.8% – a rate best characterised as around trend.
The primary catalyst for this deceleration is the consumer, with consumption growth down from 0.9% in the June quarter to 0.3%. On both a six-month annualised and annual basis, consumer spending is decidedly below trend. Troublesome for the outlook, household incomes were weaker still, with real disposable income up just 1.0% over the past year. Ergo, even the sub-par spending of the three months to September required a decline in the savings rate to a new historic low of 2.4%. As an aside, the October retail sales print (also released this week) met modest expectations at 0.3%, but the detail was decidedly mixed. Clothing was strong and household goods solid, but spending at cafes and restaurants fell. Pointing to a potential impact from declining house prices on spending, in NSW where house price declines have been most severe, a 0.4% decline in October followed a 0.7% fall in September. Victoria and Queensland in contrast saw solid gains in the month.
Coming back to GDP, housing investment's fall in the September quarter, in our mind, is the beginning of a trend decline in residential construction. Dwelling approvals are clearly off their highs, and supply and lending conditions are set to persist as significant headwinds for some time to come.
Though business investment also declined in the quarter, we see this as more noise than signal. This is, in part, because the weakness was concentrated in the notoriously volatile, mininglinked infrastructure category. Outside of mining, the pipeline of investment activity to come is significant and necessary. Like the current and expected strength in public sector investment, non-mining business investment is being aided by population growth – particularly in the south-eastern states.
From the RBA this week came two communications. As discussed by Chief Economist Bill Evans on the previous page, their comments and the disappointing Q3 GDP report are likely to see the RBA growth forecasts revised down towards trend in the February Statement on Monetary Policy.
Stepping offshore, US markets and the US economy appear to be taking diverging paths. While data on the economy remains unquestionably strong (outside of business investment), concern over the potential ill effects of trade and financial conditions are clearly mounting.
Having rallied on the weekend's preliminary agreement between President Trump and President Xi, the S&P500 subsequently fell over 4% from Monday's close to now on concerns over the detail of the agreement and subsequently, the potential for the arrest of Huawei's CFO in Canada to scupper progress altogether.
Concern was also clearly evident in debt markets, the US 10-year yield falling from 2.97% at Monday's close to a low of 2.82% during Thursday trade before it recovered back to near 2.90%. Note, just a month ago, the US 10-year reached a high of 3.23%. We remain of the view that the FOMC will continue to focus on the real economy and raise the federal funds rate to a peak of 3.125% at September 2019. But, as they have emphasised themselves, the risks bear careful assessment.
Into the weekend, the US will remain the centre of attention as the November employment report is received. Thereafter, the market's focus will shift to the UK, with Parliament's Brexit vote set for Tuesday 11 December.
As highlighted by Sterling's jolt down to 1.2659 mid-week (now near 1.28), uncertainty over the matter is very, very high and may not be resolved next week.
Chart of the week: Q3 national accounts - household income
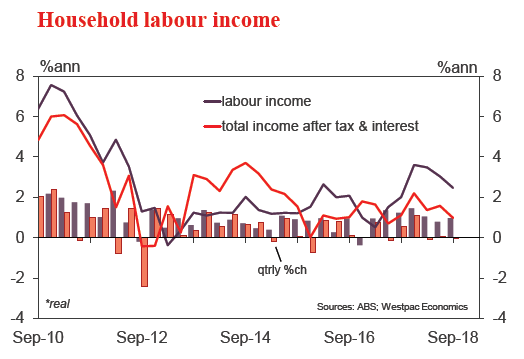
The September quarter was a difficult one for the Australian consumer, spending undershooting expectations, real disposable income essentially flat and a further decline in new savings.
On incomes, total nominal household disposable income rose by only 0.3%qtr with annual growth slowing to 2.8%yr. Adjusting for price changes (the consumer deflator rose 0.4%qtr), real household disposable income dipped 0.1%qtr with annual growth slowing to just 1.0%yr, having shown no net gain over the last three quarters.
Labour incomes made a decent 1% gain in the quarter, maintaining a 4.3% annual pace, but the flow through to disposable incomes was heavily offset by weakness in other components. The labour income gain breakdown relates to rising employment (+0.6%qtr) and average non-farm compensation per employee (+0.2%qtr). The state breakdown continues to show more evenly balanced growth across mining and non-mining states.
New Zealand: week ahead & data wrap
A changing leaderboard
Our latest Regional Roundup was released this week. It details why we think activity in Auckland has lagged many other parts of the country in recent times and equally importantly, why we expect this gap to start closing over the year ahead. In other developments, households across the country have benefitted from falling prices at the pump. This should mean a little more left in consumers' wallets for other spending, and it's also led to us to chip a bit off our nearterm inflation forecasts.
Our view remains that in aggregate the New Zealand economy will see a pickup in growth over the year ahead, underpinned by both a strong lift in government spending as well as a temporary improvement in the housing market on the back of recent falls in mortgage rates and a loosening in LVR lending restrictions.
One reason the Government has been able to plan such a significant lift in spending has been the healthy state of the fiscal accounts. This is likely to be a continuing theme when the Government releases its Half-Year Economic and Fiscal Update (HYEFU) on Thursday. It's rare that the HYEFU is used to introduce new policies. However, there will be some announcements around the priorities for next year's Budget, which will be the first produced under a 'wellbeing' framework.
We don't expect to see significant changes to the forecasts compared to the May Budget. While we still regard the Treasury's growth forecasts as too optimistic, the recent economic data has been solid, so is unlikely to persuade them to change their view at this time. The fiscal position is also coming from a strong starting point: the accounts for the year ended June 2018 revealed a much larger surplus and lower net debt than forecast, putting the Government well within its self-imposed fiscal responsibility rules.
However, those surprises won't necessarily be carried forward into the projections for the next few years. Much of the 'improvement' was due to an unintentional shortfall in operational and capital spending. The fiscal accounts for the four months to October suggest that there has been some catch-up on last year's underspend. If that continues, we could see a lower surplus forecast for this year, and little or no net change in the Government's borrowing requirement. While this might mean we don't see surplus projections press further into the black, it will still allow the Government to plough ahead with the significant spending plans it has already budgeted for.
While this lift in government spending will be felt across all regions (and in Wellington especially), the improvement in the housing market is likely to be felt particularly acutely in Auckland. The Auckland housing market has been treading water since mid-2016, so even a modest lift in prices could generate a bit of momentum in consumer spending in the region.
The other recent development that should give a bit of a boost to consumer spending in the near term are sharply lower petrol prices. Oil prices peaked in early October with Brent crude rising above $US 86/barrel. Since then prices have receded substantially, currently sitting at around $60/ barrel. Over the same period the NZ/USD has appreciated. For New Zealand consumers that means they've seen a noticeable drop in prices at the pump, from a peak of around $2.48/litre in early October to around $2.08/litre currently. With petrol costs gobbling up a smaller share of household budgets, there should be a little extra left to spend in other areas.
Lower petrol prices have also put downward pressure on our CPI forecasts for the December and March quarters. We've shaved 0.1 percentage points off our inflation forecast in each quarter. This would see annual inflation rise to 2.1% in the December quarter before falling back to 1.9% in March 2019. And while the Reserve Bank has always been adamant that it would look through a spike in oil prices when setting monetary policy, the lower near term inflation certainly does nothing to dent our view that the RBNZ will be content to sit on its hands until late 2020.
In rural regions, which have largely been outperforming their urban counterparts in recent times, growth is likely to remain firm, but is not expected to improve as noticeably over the coming year. One reason for this is the downward pressure on farm gate milk prices we've seen in recent months. Both Westpac and Fonterra have revised down their milk price forecast for this season. Our own forecast has been lowered to $6.10/KgMs, and Fonterra is now forecasting a range of $6-6.30 (previously $6.25-$6.50).
Slowing population growth is likely to become an increasing headwind for the New Zealand economy. Importantly for regional New Zealand, one driver of this slowdown is expected to be an increase in the number of New Zealanders moving across the Tasman. We think more Kiwis staying put has been an important factor behind regional population growth. As this starts to wane, it will weigh particularly heavily on activity in places such as the lower North Island and Otago where unusually strong population growth has been an important contributor to the outperformance of these regions in recent times.
In Auckland, slowing population growth and ongoing strength in residential building activity (this week saw a 1.2% lift in residential building in the September quarter) mean that Auckland will soon be building enough homes to keep up with population growth. Look a little further down the track and Auckland will be on the path to reducing its housing shortage.
Data Previews
Aus Oct housing finance (no.)
- Dec 10, Last: –1.0%, WBC f/c: 1.0%
- Mkt f/c: -0.4%, Range: -1.5% to 1.5%
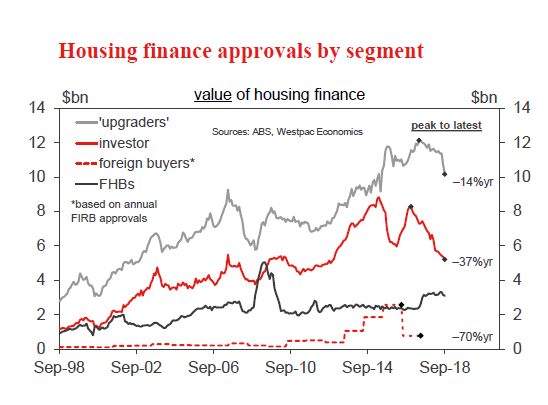
Housing finance approvals continued to soften in September, the headline number of owner occupier loans down 1% but the value of loans notably weaker, owner occupier loans down –4.2% (–8% in the space of two months) and the value of investor loans down 2.8% (–18.1%yr). The combined total value of housing finance approvals including investors but excluding owner occupier refi, fell 3.7% to be down 14.2%yr.
Despite the weak lead in and a continued weakening in housing markets, the October update is expected to show a small 1% lift with Industry data pointing to a modest gain. That suggests some of the sharp decline through Aug- Sep relates to slower processing times as applications now involve more rigorous assessments of minimum expenses.
Aus Dec Westpac-MI Consumer Sentiment
- Dec 12 Last: 104.3
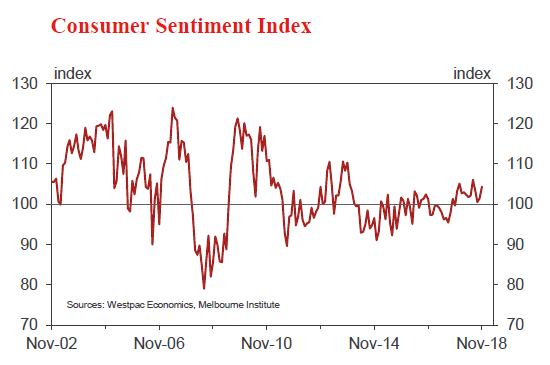
The Westpac Melbourne Institute Index of Consumer Sentiment rose 2.8% to 104.3 in November from 101.5 in October, extending a lift from softer reads in the previous three months. Sentiment has held up surprisingly well, particularly given the weakness in housing markets.
The December survey is in the field from December 3-8. This may be a sterner test for the consumer mood with a disappointing September quarter national accounts update and further declines in house prices in Sydney and Melbourne. Sentiment may also be influenced by a sharp sell-off in equities (ASX down 4.5% since the last survey and over 10% from August's high), but more positively, a sharp fall in fuel prices (average pump prices down nearly 20% since the last survey).
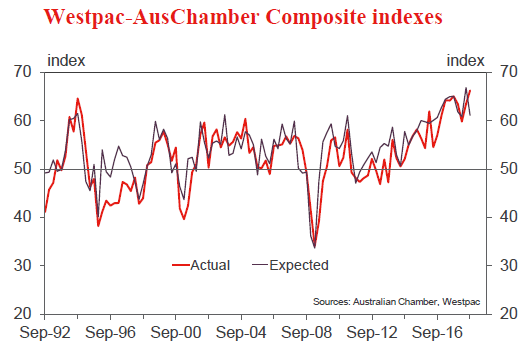
Aus Q4 AusChamber-Westpac business survey
- Dec 13, Last: 66.5
The Australian Chamber-Westpac survey of the manufacturing sector provides a timely update on conditions in the sector and insights into economy-wide trends. The Actual Composite tracks a range of demand related measures including investment and employment. The Q4 survey was conducted from end October into December.
In Q3, the Actual Composite rose to 66.5 from 64.1 in June. Strength is centred on a lift in new orders, output employment and order backlog.
Manufacturing is benefitting from a rise in public infrastructure, non-mining business investment, and above par world growth with a relatively low AUD. However, there are likely to be spill-over effects from the drought in NSW and Queensland.
NZ Nov retail card spending
- Dec 11, Last: +0.1%, WBC f/c: -0.2%
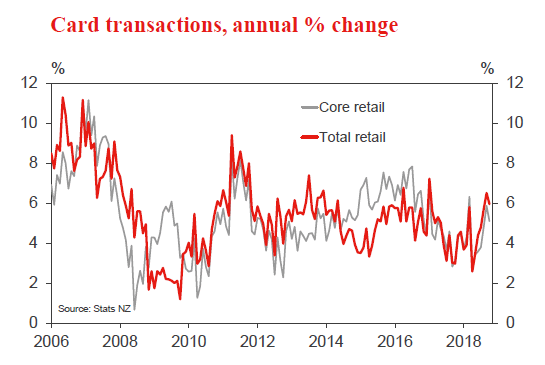
Retail spending rose by only 0.1% In October. Underlying that muted gain, spending on fuel rose by 1.4% as petrol prices rose to high levels. For many households, this is likely to have constrained spending on other goods. In fact, spending in core (ex-fuel) categories was essentially flat.
We're expecting to see a 0.2% drop in overall spending levels in November. That's mainly due to the 10% drop in fuel prices over the month, which is pulling down nominal spending. However, that's putting more money back in households' wallets, which should support spending in other categories. Consequently, we're forecasting a 0.4% rise in core (ex-fuel) spending.
The growing prevalence of 'Black Friday' sales may add to spending. However, the extent of this boost isn't clear, with increased volumes balanced against big price discounts.
NZ Half-Year Fiscal and Economic Update
- Dec 13
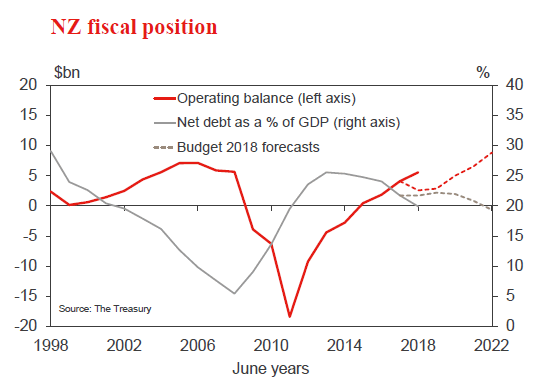
The HYEFU provides an update of the Government's economic and fiscal projections for the next five years. It will also provide some guidance on the priorities for next year's "Wellbeing Budget".
The June 2018 fiscal year saw a significantly larger surplus and lower net debt than forecast, putting the Government well within its Fiscal Responsibility Rules. Some of the surprise was due to a stronger than expected tax take, but much of it was due to an unintentional shortfall in spending. Since June we have seen some catch-up in spending, which could mean a lower surplus forecast for this year and a similar net borrowing requirement.
US Nov CPI and retail sales
- Dec 12, CPI, last 0.3%, WBC 0.0%
- Dec 14, retail sales, last 0.8%, WBC 0.4%
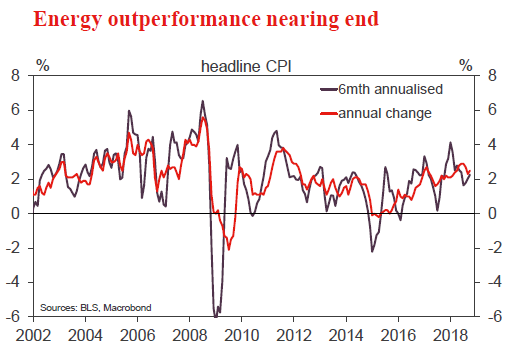
For headline inflation, energy prices have been a key support over the past year, supporting an acceleration from around 2.0%yr a year ago to a peak of 2.9%yr at Jun. However, with the price of oil having fallen sharply in recent months, headline inflation is reversing course. A flat outcome in Nov is likely to see the annual rate pull back to 2.2%yr. For core prices however, price growth is set to persist near 0.2% per month. In Nov, that should see core inflation also at 2.2%yr.
Retail sales growth was robust in Oct following two near-flat outcomes. As for inflation, the price of oil will be a negative in Nov. Abstracting from this effect, core retail should continue to grow at a solid pace, circa 0.7%. To this view, replacement purchases of cars post the 2018 hurricane season is an upside risk.
Eur Dec ECB policy decision (deposit rate)
- Dec 13, Last: -0.4%, WBC f/c: -0.4%
As we head into the December ECB meeting, all eyes will be on whether they confirm the end of net asset purchases and repeat their forward guidance that key policy rates will remain on hold "at least through the summer of 2019, and in any case for as long as necessary".
The December meeting will include revised macroeconomic projections. President Draghi recently noted to European Parliament that "the data that have become available since my last visit in September have been somewhat weaker than expected". However, he reiterated their belief that momentum will stabilise, citing normalising net exports and one-off factors driving the recent slowdown. As such we expect minor downward revisions to their near-term outlook.
Also of significance will be their characterisation of risks to their outlook. To date, the ECB have continued to note that risks are "broadly balanced". The mentioned downside risks are global in nature and are described as prominent.
Weekly Focus – Rejection of Brexit Deal and ECB Ends QE Programme
Market Movers ahead
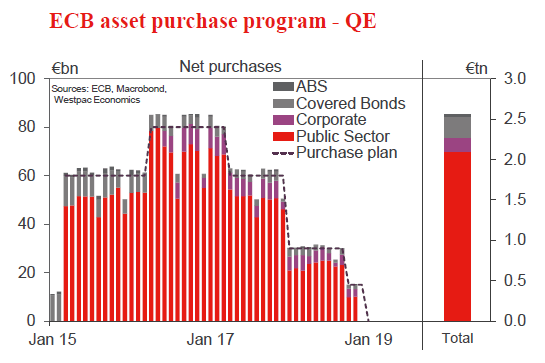
- We expect the ECB to officially end the QE programme when it meets next week.
- Flash PMIs for the US, Japan and euro area are due for release next week. In particular, the euro area PMIs are interesting given the negative momentum in Europe right now.
- In the US , CPI inflation and retail sales data for November are due. Fed's blackout period starts ahead of the FOMC meeting in the week after next.
- In the UK , the vote in the House of Commons on Theresa May's Brexit deal takes place on Tuesday. More than 400 MPs have said they will vote against the deal.
- In Denmark and Sweden , inflation data for November are due out next week.
- In Norway , we expect Norges Bank to stay on hold on Thursday but we expect the bank to confirm its plans to tighten monetary policy further in March.
Weekly wrap-up
- Global economic key figures were slightly stronger than expected this week.
- The US and China agreed on a 90-day ceasefire in the trade war.
- Italy negotiations with the EU are ongoing on the size of the budget deficit.
- Stock markets had a volatile week as the rally following the trade war ceasefire fizzled out on renewed uncertainty.
- US 10Y Treasury yields fell sharply on growth fears and uncertainty over the trade agreement. In euro periphery markets we saw spread tightening on softer signals from the Italian government.
- USD/CNY saw the biggest two-day decline since 2005.
Dollar Punished by Disappointing Jobs Report; Oil Jumps on OPEC Deal
Appetite for the Dollar diminished on Friday after November’s disappointing US jobs report reinforced expectations over the Fed taking a pause on rate hikes next year.
The United States added another 155,000 jobs last month which was below the 189,00 forecast, while October figures were revised lower to 237,000 from the first estimate of 250,000. With wage growth also falling short of market expectations - rising only 0.2% m/m vs the 0,3% forecast - the Dollar has found itself back in the crosshairs of bearish investors. Today’s uninspiring report certainly addresses recent concerns over the US economy potentially decelerating, given the inversion of the US Treasury yield curve earlier this week. Although the unemployment rate remained unchanged at 3.7%, the overall US jobs report remains Dollar negative and is likely to create some uncertainty over the Fed’s hiking path beyond December.
In regards to the technical picture, Dollar bulls are in trouble on the daily charts. Sustained weakness below the 97.00 level is likely to send the Dollar Index towards 96.40 in the near term.
OPEC + agree to cut oil production
A collective sigh of relief was felt across Oil markets after OPEC+ delegates successfully reached an agreement to cut production by 1.2 million barrels per day. OPEC nations have agreed to trim production by 800,000 barrels while non-OPEC members will handle the remainder.
This breakthrough in talks is a welcome development for financial markets and is seen supporting risk sentiment during the upcoming trading week. With OPEC agreeing to cut Oil production larger than initially expected, Oil prices are poised to extend gains in the short term. However, the medium- to longer-term outlook remains open to question. It must be kept in mind that US Shale production remains as robust as ever while concerns over slowing global growth are fuelling fears of falling demand for Oil. If escalating US-China trade tensions evolve into an all-out trade war, Oil markets will certainly be one of the many casualties.
Although WTI Crude staged a solid rebound following the OPEC production cut, bulls have a long way to go before reclaiming back any sort of control. A weekly close above $54.00 is seen opening a path towards $56.00 and $57.40 in the short to medium term.
Sunset Market Commentary
Markets
Core bonds lost ground today. Global markets calmed down after yesterday’s equity sell-off. Asian markets continued yesterday’s intraday risk rebound on US markets. The German Bund opened higher but edged gradually lower throughout the day. US Treasuries opened in a sideway manner. The EU only printed secondary eco data, leaving the investor focus on the OPEC+ negotiations in Vienna and on the US payrolls. Both came around the same time. OPEC+ agreed to cut oil production by 1.2 million barrels p/day. The price for one barrel cude (Brent) jumped more than 5%. US labour report printed under expectations, but remains solid nonetheless. The data allows the Fed to strike a softer tone on interest rate hikes, while the economy and labour market remains strong. Both UST’s and German Bunds first spiked higher, but paired those gains almost immediately to gradually edge lower. In the end, German Bunds underperformed US Treasuries. Both the German and the US yield curve move north. German yield changes stretch from +2.7 bps (2-yr) to +3.2 bps (10-yr) while the US yield curve changes range from +0.1 bp (5-yr) to +1.7 bps (30-yr). Italy and the European Commission again repeated that both parties expect a budget agreement. Italian 10-yr yield spread over Germany tightened 10 bps to 285 bps. Spreads in other peripheral countries tightened as well.
Today, three factors were earmarked as potential movers for global (FX/USD) trading: risk sentiment(equities), the OPEC decision on production cuts and the US payrolls. The sell-off of risky assets slowed today. In line with recent price action, risk-sentiment wasn’t an unequivocal driver for USD trading. Despite a more constructive risk sentiment, EUR/USD held an extremely tight sideways range in the 1.1360/85 area. US job growth was slightly below consensus. Wage growth and the unemployment rate were little changed as expected. The dollar lost temporary a few ticks upon the release of the payrolls report, but markets soon concluded that the report won’t change the Fed assessment going into the December policy meeting. EUR/USD briefly touched offers north of 1.14 but soon returned to familiar territory just below the 1.14 mark. More or less at the time of the payrolls publication, OPEC announced to have reached a deal on production cuts. LT yields rose marginally, but the oil deal nor the payrolls were able to provide any clear direction for USD trading. EUR/USD is currently changing hands near 1.14. USD/JPY hovers in the upper part of the 112 big figure and also shows little of a directional bias.
In the UK the political debate preceding next week’s Brexit vote continued today. As was often the case of late, several potential ‘solutions’ to unlock the political stalemate were aired, including some May allies proposing a delay of the vote. However, for now, none of the proposals are seen as contributing to a clear workable outcome of the Brexit procedure. In technical trade, sterling drifted cautiously higher off the 0.89 mark. Investors stay cautions on sterling long exposure going into the weekend.
News Headlines
The US payrolls fell somewhat below expectations as 155 000 new jobs were created in Nov. vs. 198 000 expected. Unemployment and the participation rate remained stable at 3.7% and 62.9%. Wages grew 0.2% MoM (vs. 0.3% exp.) while Oct. wage growth was revised downwardly to 0.1%. Earnings remained stable on a yearly basis at 3.1% YoY.
The Canadian job report came in stronger than expected as 94 100 new jobs were created (a mere 10 000 was expected), 89 900 of which full time. The unemployment rate dropped from 5.8% to 5.6% while the participation rate increased from 65.2% to 65.4%. The loonie jumped a big fig, from USD/CAD 1.34 to slightly below 1.33.
Today’s Opec meeting ended with an agreement despite a pessimistic tone upfront. The most important oil producing countries agree a cut of 1.2m barrels per day to support oil prices. Brent crude jumps more than 5% to currently trade around $63/b.
U.S. November Employment Slows
Highlights:
- November payroll employment rose 155k which was down from both the 198k expected going into the report and the 237k increase in October (previously reported as up 250k).
- The unemployment rate remained unchanged at a historically low 3.7%.
- The annual increase in wages remained unchanged at 3.1% though it is up from 2.5% a year ago.
Our Take:
November payroll employment rose a smaller-than-expected 155k. Going into the November release some moderation was expected from the 237k jump that was recorded in October. The falloff in hiring in November was abetted by a disappointing 5k rise in construction employment that was down from an average gain over the previous three months of 23k. The increase was also restrained by government employment dropping 6k after a 14k decline in October. Some offset was provided by a solid 18k gain in the retail sector implying optimism among retailers of above-average sales over the Christmas shopping period. The average gain over the last two months of 196k is indicative of economic growth remaining at an above-potential growth rate. The reported November unemployment rate of 3.7% is in fact indicative of the economy already operating beyond capacity given the Fed’s own estimate of a long-run equilibrium unemployment rate as being within a range of 4.3% to 4.6%. The November wage measure reported an unchanged annual rate of increase of 3.1% though this rate has been steadily rising in earlier months and compares to a year ago rate of 2.5%. Though the November rate of increase in wages does not threaten the Fed’s inflation objective of 2%, assuming 1% productivity growth, such is not the case if the upward trajectory continues. To try to limit the inflationary risk of an economy operating beyond capacity, we assume that the Fed will continue to move interest rates higher. Our forecast assumes a 25-basis point hike in the current fed funds range of 2.00% to 2.25% at the upcoming December 18/19 FOMC meeting. We are assuming further gradual tightening through 2019 with 25 basis point hikes every quarter through that year.
Canadian Jobs Report Provides Brief Reprieve from Negative Headlines
Highlights:
- Employment was up 94k in November, the third consecutive monthly increase. All of the gains were full-time, as has been the case year-to-date.
- Job gains were broadly-based across the country with solid growth in BC, Alberta, Ontario and Quebec.
- The unemployment rate fell 0.2 percentage points to 5.6%, a more than 40-year low. The jobless rate had been range bound at 5.8-6.0% this year.
- Wage growth was once again the fly in the ointment, with hourly wages for permanent employees up just 1.5% from a year earlier. Our latest tracking of the BoC’s wage-common is closer to 2.5%.
Our Take:
November’s employment report was a whopper—a massive jump in full-time employment, sizeable job gains in the largest provinces, and lower unemployment even as labour force participation rose. Wage growth was once again disappointing—we’ve essentially seen no hourly pay growth in the last six months. But today’s data is still a nice little holiday from negative global and Canadian headlines in recent weeks. Enjoy it while it lasts, because we’re likely to see some soft data prints in the coming months. Canada’s economy carried little momentum into Q4, and labour disruptions and lower oil prices are likely to take a toll on quarterly activity. Production cuts in Alberta mean slower growth will continue early next year. The Bank of Canada will likely be trimming their growth forecasts come January, a prospect that has seriously dented the odds of a rate hike early next year. But perhaps today’s data is a reminder that the economy is heading into this soft patch on a fairly solid footing, with low unemployment and on-target inflation. We still think the BoC will be raising rates in 2019.
There was little evidence of deteriorating labour market conditions in Alberta. Employment jumped 24k, the unemployment rate fell a percentage point (with only a modest decline in labour force participation), and natural resources employment was steady. That doesn’t mean the province won’t see some pain in the coming months—the survey week for today’s report (November 4-10) came just before Canadian heavy oil prices bottomed out. And production cuts that will ramp up in January could result in some layoffs (or perhaps fewer hours worked), even if they boost oil prices.
USD/CHF Tumbles on Softer US Jobs and Wage Data
A wrath of US economic data painted the picture that US economy is slowing, propping up expectations that Fed will dial back their rate hike expectations at the December 19th meeting. The headline nonfarm payroll printed 155,000 jobs, a miss from the 200,000 level that analysts’ eyed. The unemployment rate stayed steady at 3.7%, matching the lowest level since 1969. The wage data came in softer than expectations and the back month was revised lower, thus provided a little relief for inflation concerns. The November monthly average hourly earnings miss by one-tenth of percentage point at 0.2%, while the annual reading came in line with expectations at 3.1%
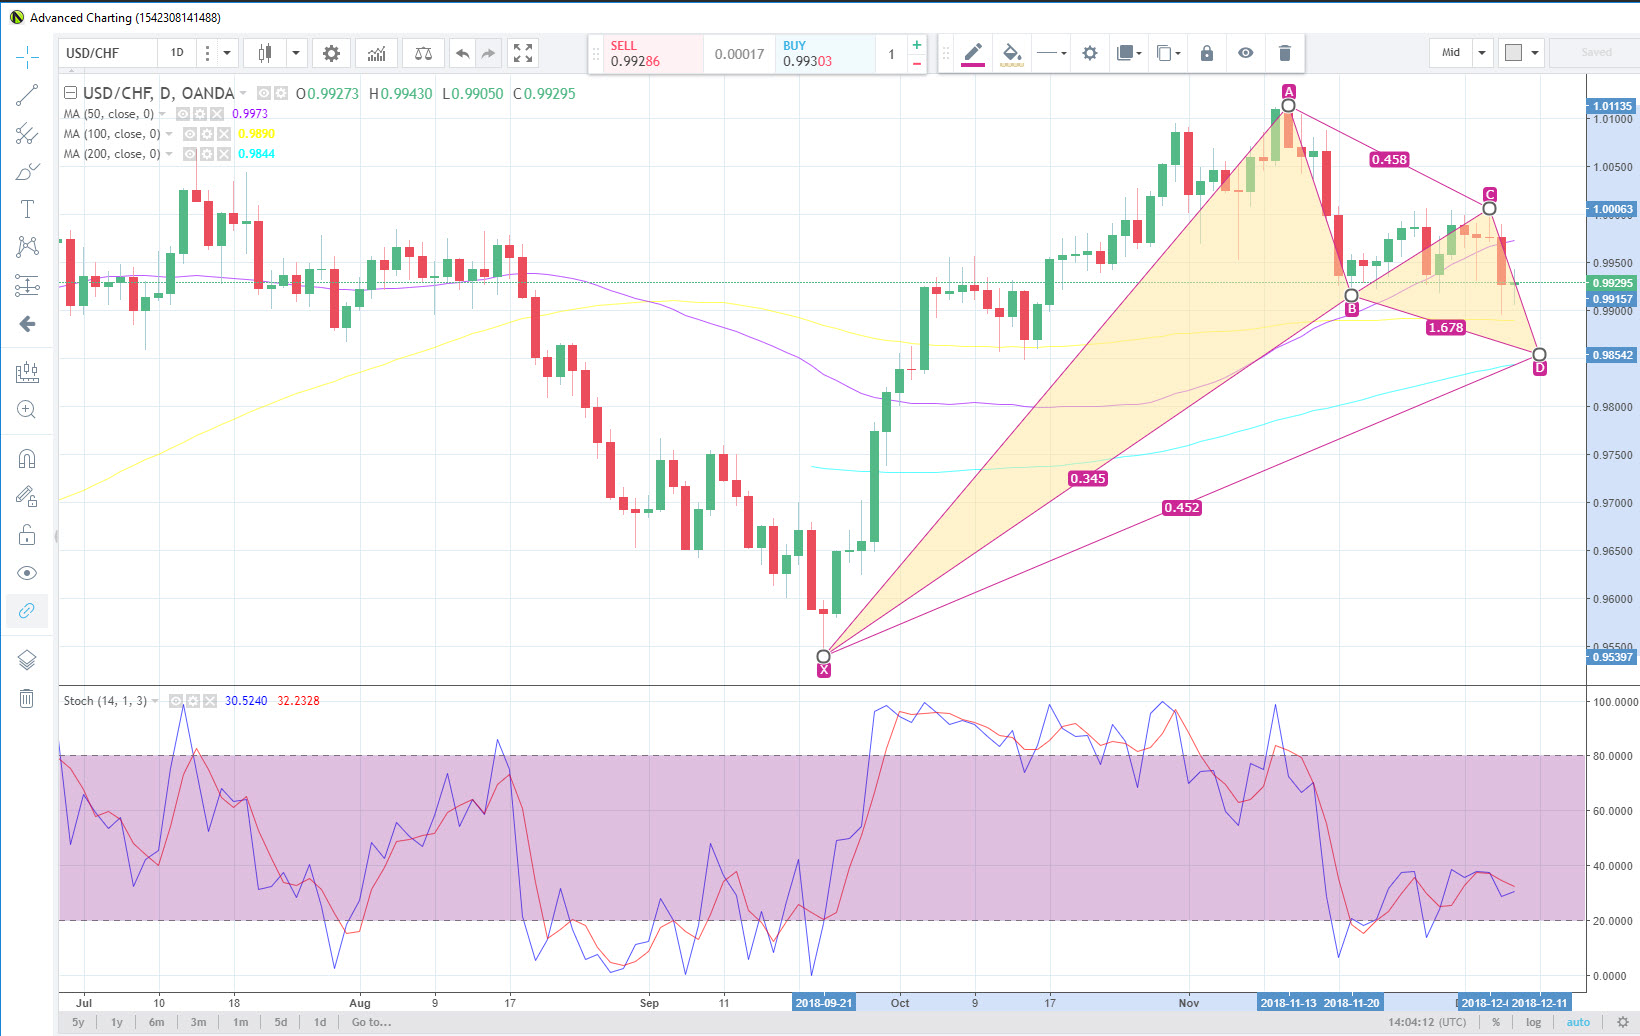
Price action on the USD/CHF was initially lower after the softer than expected US economic data. The initial selloff approached the lows of the week but since has rebounded to little changed on the session. Key resistance remains the 0.9970 to parity region. If we see a resumption of the downward move that has been in place since the middle of November, price could initially target 0.9888. Major resistance would come from 0.9842, which is both where the 200-day SMA trades and where we could see the beginning of a bullish Gartley pattern. If the bullish reversal is valid we could see price a move back towards the parity level.
USDZAR Still Negative, Approaches Downtrend Line
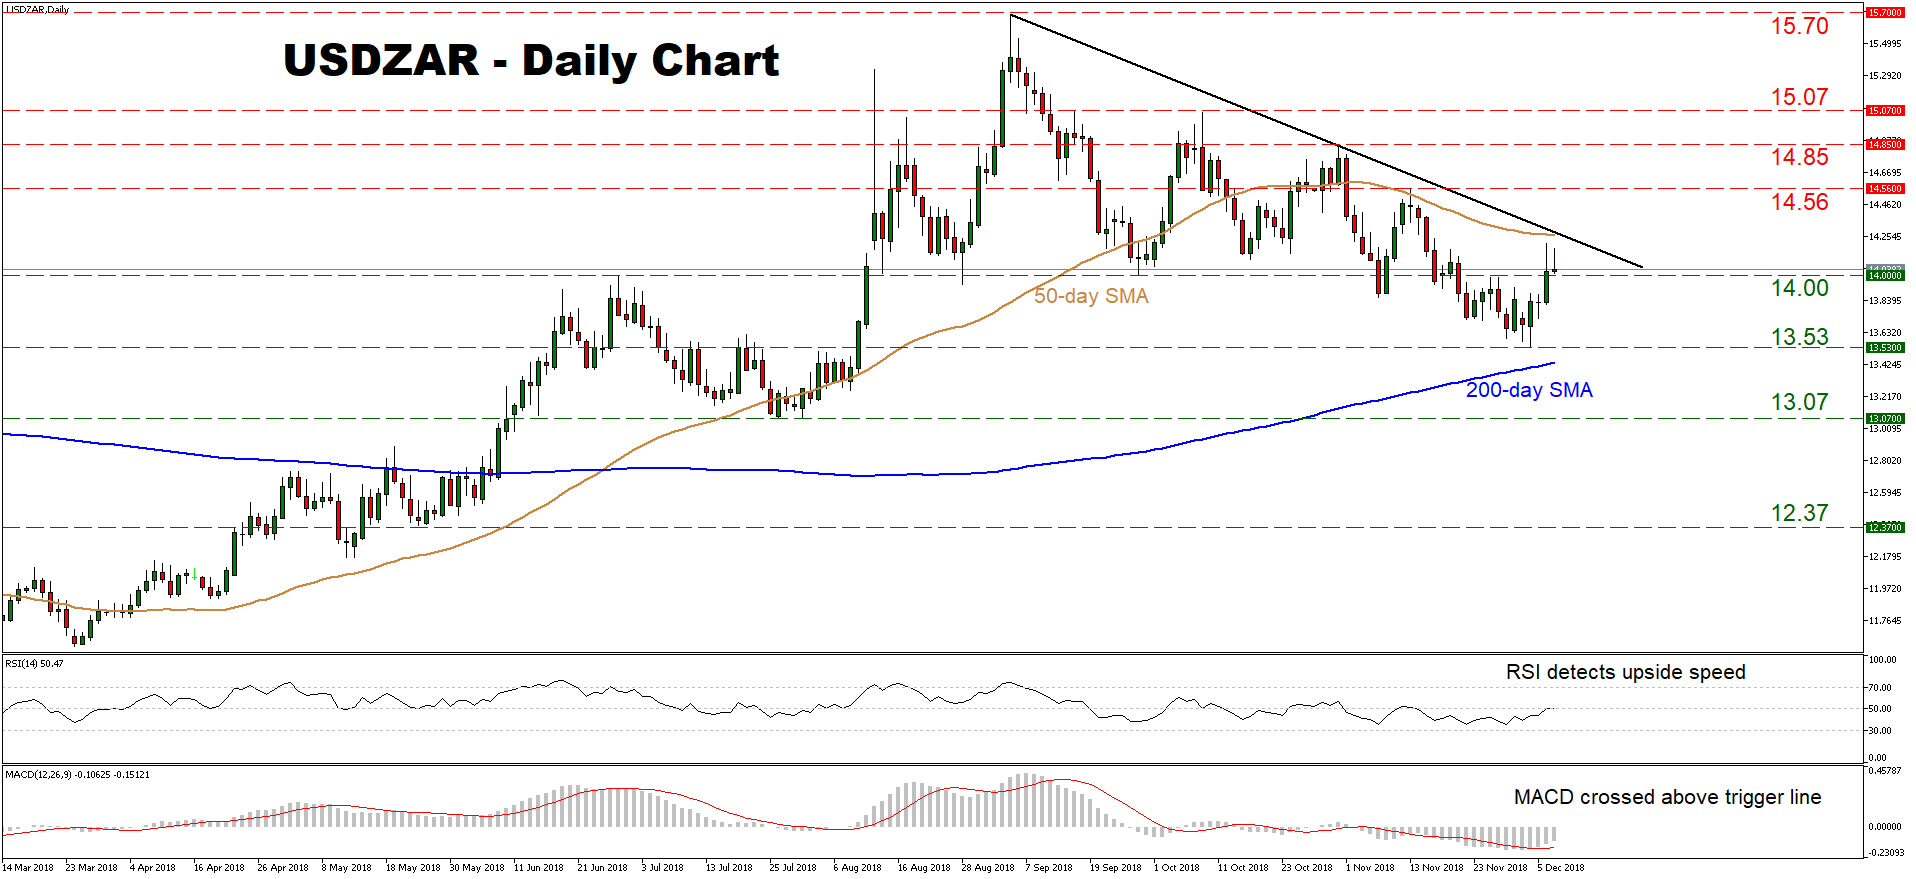
USDZAR continues to print lower lows and lower highs on the daily chart below a downtrend line drawn from the highs of September 6. Hence, the broader picture remains negative for now. For it to turn neutral, it would require a clear close above the crossroads of the downtrend line, the 50-day SMA, and the 14.56 level.
Short-term momentum oscillators, though, suggest the latest bounce may continue for a while. The RSI just pierced above its neutral 50 line, while the MACD crossed above its red trigger line.
Further advances may find immediate resistance near the aforementioned crossroads. A decisive close above it would shift the bias to flat, setting the stage for a test of the October 31 high of 14.85, before the October 9 peak of 15.07 comes into view.
On the downside, a first wave of support to declines may come around the 14.00 handle, marked by the inside swing high on November 28. A bearish break may open the way for 13.53, the December 4 trough. Notice that the 200-day SMA at 13.42 lies not far below. Lower still, buy orders may be found near the July lows of 13.07.
Recapping, the overall picture is still negative; a break above 14.56 is required to turn it neutral.
Canadian Unemployment Rate Hits an All-time Low in November
November saw a net 94.1k more Canadians at work. Even with 77.2k more Canadians in the labour force, the unemployment rate fell to 5.6% - the lowest rate since data collection began in 1976.
Even better, the see-saw pattern of the summer was not seen, with 89.9k net full time jobs added, while part-time work was effectively unchanged (+4.1k). The gains were also by and large in the private sector (+78.6k), and in employment (+89.6k) as the number of self-employed Canadians ticked up just 7.2k in November.
Job gains were mainly seen among older Canadians. Core aged (25 to 54) workers led the way, adding 48.8k net jobs, while the net gain in employment among those aged 55+ was 38.8k. Employment rose 6.4k for those aged 15-24.
Looking at the industry breakdown, it was a pretty decent mix: goods-producing industries added 26.9k on gains in construction, while the services side of the economy added 67.2k on net, helped by professional services and healthcare. Across the provinces, it was generally a positive story. Alberta stands out in today's report, as its unemployment rate fell a full percentage point to 6.3% - the largest single-month decline on record.
Despite strong employment gains, wage growth nevertheless slowed for a sixth straight month. Hourly wages for permanent employees were up just 1.5% year-on-year. Conversely, the aggregate hours worked was up a strong 2.1% year-on-year, reflecting a robust 0.9% monthly gain.
This is a volatile series, and so dialing back the lens a bit helps. The picture is still encouraging: employment growth now stands at 1.2% year-on-year, driven by full time work (up 1.5%) and private sector gains (+1.2%). The six month trend in employment growth now stands at 34k per month – well above the 15k or so that we would expect in an economy at full employment.
Key Implications
The Canadian economy needed a bit of good news, and today's job report qualifies. As always, a grain of salt is needed when interpreting this volatile series, but there really is little to complain about in today's data. Not only did we hit a record-low unemployment rate, we did it on the back of full-time employment and rising labour force participation. Unlike most months, the headlines of today's report were also well above the standard error, meaning we can have some confidence in the monthly moves. The economy may be walking into some near-term headwinds, but at least from a labour market perspective, there seems to be a strong footing.
We may have escaped some of the volatility that characterized the summer months, but we have not yet broken the downtrend in wages. The pace of wage gains has been halved in just four months, and now sit firmly below core inflation. This is certainly not the type of wage growth one would typically associate with unemployment at all-time lows, and this aspect of the report will be certain to generate further debate among economists and policymakers.
As Governor Poloz's speech yesterday made clear, energy sector developments and softer momentum are weighing on the Bank of Canada's minds, and will likely delay the next policy interest rate hike into Spring 2019. Today's labour market report is definitely an encouraging one, but the wage signal reinforces that there is little risk from an inflation control perspective in waiting a bit for their next move.