Sample Category Title
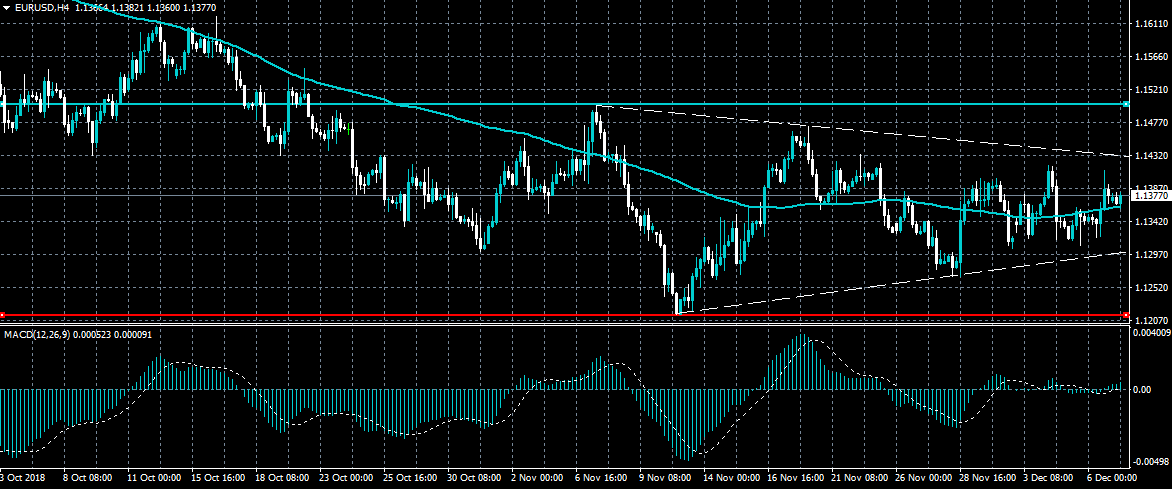
EURUSD Awaiting Technical Confirmation
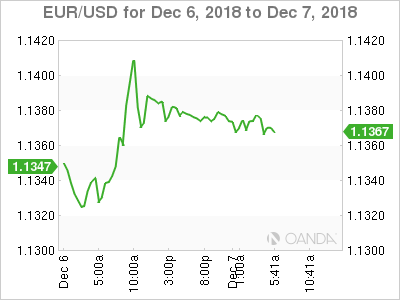
The euro continues to consolidate in the middle of its recent trading range against the US dollar, as traders await the outcome of the US monthly jobs report later today. A clear break below the 1.1300 support level may prompt a technical test of the current EURUSD yearly low, while a move above the 1.1430 level may provide the impetus for a test of the 1.1500 resistance level. The United States economy is forecasted to have created 200,000 new jobs during the month of November.
The EURUSD pair is only bearish while trading below the 1.1300 level, key technical support is found at the 1.1216 and 1.1175 levels.
If the EURUSD pair trades above the 1.1430 level, buyers may test the 1.1470 and 1.1500 levels.
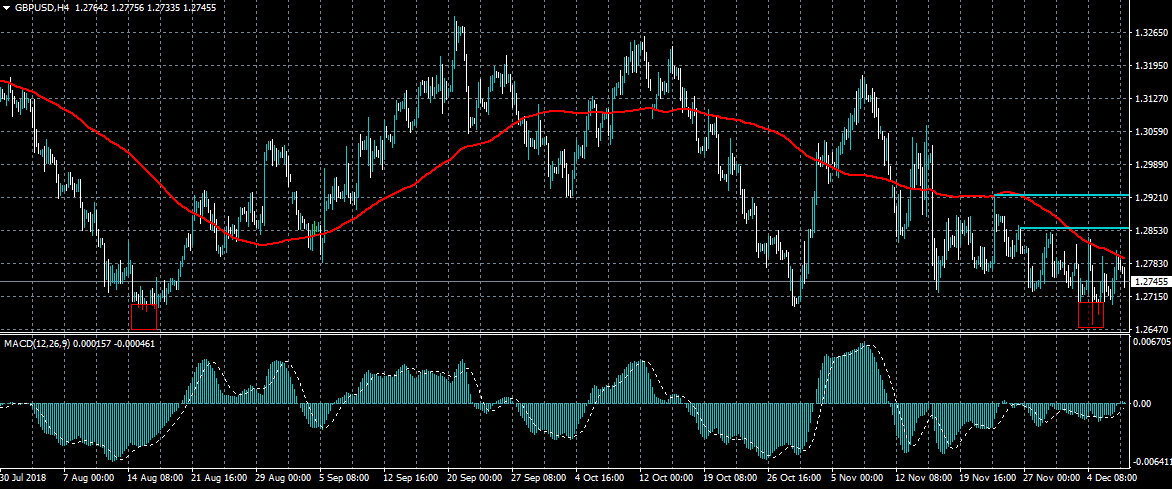
GBPUSD Weakening Ahead Of US Job Report
The British pound is back under pressure against the greenback, with price-action turning bearish ahead of the US Nonfarm payrolls job report. A better than expected jobs figure from the US economy may provoke GBPUSD selling towards the 1.2657 level, while a much worse than expected jobs number will likely see GBPUSD buyers once again testing towards the pairs 100-period moving average on the four-hour time frame.
The GBPUSD pair is strongly bearish while trading below the 1.2700 level, key technical support is found at the 1.2657 and 1.2550 levels.
If the GBPUSD pair trades above the 1.2790 level, key resistance remains at the 1.2855 and 1.2925 levels.
NZD/USD Close Above 0.6900 Is Needed For Stronger Impulse
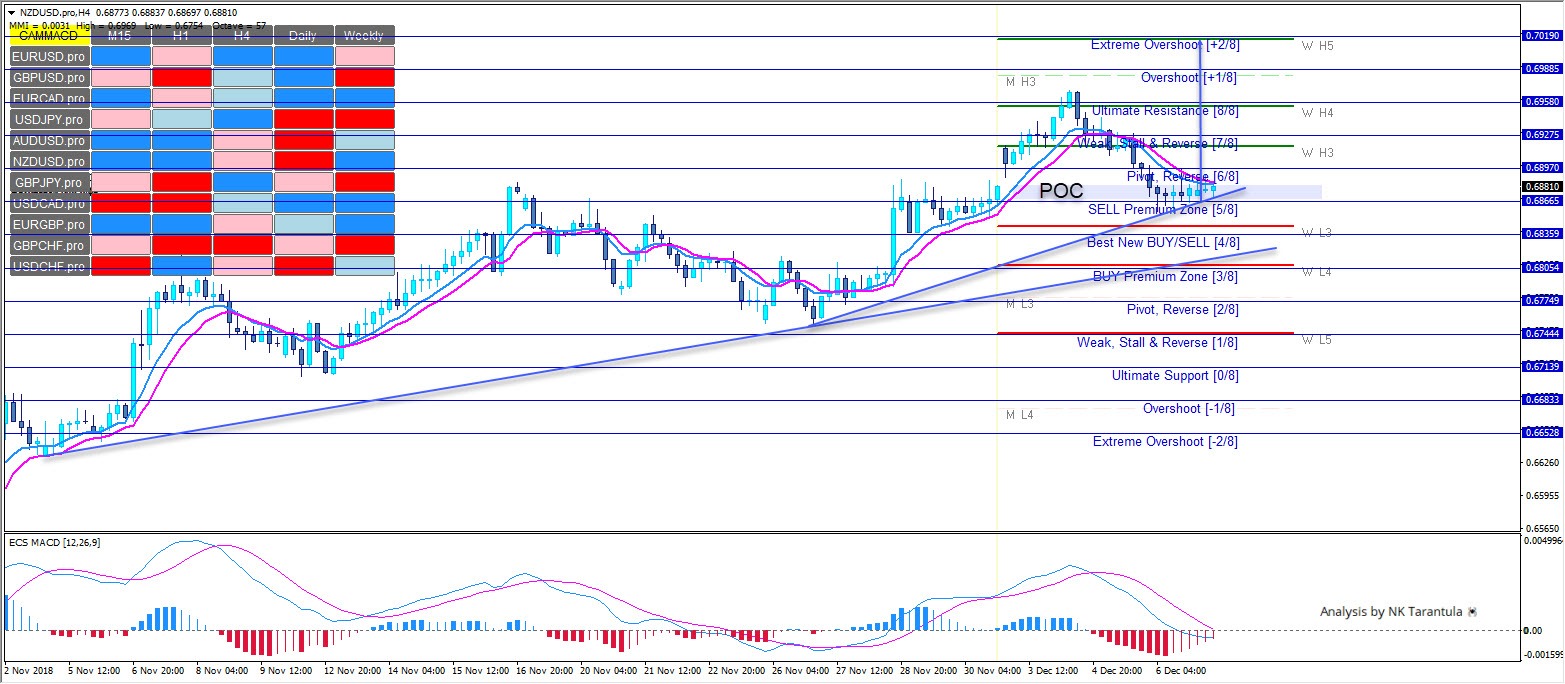
0.6860-70 is the POC zone. A rejection from the POC zone is possible due to strong Weekly trend and H4 alignment. Two trendlines also mark the uptrend and smaller pinbars cue for now moment buyers. Targets are 0.6900, 0.6958 and eventually 0.7019 if the trend persists. Watch for a bounce from the POC zone.
DAX Pauses From Plunge As Eurozone GDP Matches Forecast
The DAX index has posted slight gains in the Friday session. Currently, the index is at 10,896, up 0.20% on the day. On the release front, German industrial production disappointed with a decline of 0.3%, shy of the estimate of 0.5%. In the eurozone, employment change and revised GDP for the third quarter both came in at 0.2%, matching their estimates. The U.S releases nonfarm payrolls, with the markets braced for a sharp drop to 200 thousand.
Global stock markets have dropped sharply this week. The DAX has plunged 5.55%, and dropped below the 11,000 level on Thursday, for the first time since December 2016. Bank and automaker shares were down sharply on Thursday, as investors continue to fret about the U.S-China trade war. There was some optimism early in the week after President Trump agreed to suspend further tariffs against China for 90 days. However, there are concerns that the two sides will not be able to close the gaps in their positions in just a few weeks. There was more bad news for the markets on Thursday, after a senior Chinese executive, Meng Wanzhou, was arrested in Vancouver for allegedly violating trade sanctions against Iran. Wanzhou faces extradition to the U.S., and China’s indignant response to the arrest could torpedo upcoming trade talks between the two countries. Even if the negotiations get off the ground, they promise to be difficult, which could mean more headwinds for the DAX.
After a tremendous run, the U.S labor market could be losing some steam. Employment data was softer than expected on Thursday. The November ADP nonfarm payrolls was forecast to drop, but the plunge was much sharper than expected. The indicator fell to 175 thousand, missing the estimate of 195 thousand. If the official nonfarm payroll report on Friday misses expectations, equity markets could respond with losses, adding more misery to a dismal week.
A 200K Non-Farm Payroll (NFP) A Non Event
Market volatility remains elevated, in part because of confusion over comments by Washington officials re-Sino/U.S trade war this week. The supposed de-escalation of trade tension coming out of the G20 seem to be somewhat misleading and has led to aggressive selling of risk assets and the buying of sovereign bonds.
The VIX has jumped back above 25, and the U.S Dollar has come under modest pressure. The U.S 10-year yield has slumped to +2.8%, level not seen since this summer. The 2-year yield has fallen even faster, resulting in benchmark steepening despite a continued inversion at the belly of the curve (2/10's +13 bps).
Trade tensions between the world's two largest economies – U.S and China – just got trickier with the arrest of the CFO and daughter of the founder of Huawei, in Canada, at the request of the U.S. The U.S has been probing Huawei over possible violation of sanctions against Iran.
Chances of a no-deal Brexit are slim but uncertainty looms for the pound because the U.K parliament looks unlikely to approve PM Theresa May's Brexit deal – voting in the U.K Parliament to begin 14:00 ET on Tuesday, Dec 11.
Expect Sterling to continue to trade very nervously.
Bank of England (BoE) on Brexit Scenarios: GBP currency could fall -15% in disruptive and -25% in disorderly Brexit.
On the commodity front, oil prices continue to remain on the soft side, pressured by a further build in U.S inventories this week. Fearing a glut, OPEC is considering supply cuts at this weeks meeting (Dec 6-7).
Russia remains the key, Moscow could contribute a maximum of -150K bpd cut, but the Middle East-dominated OPEC insists Russia cut by -250K-300K bpd.
Yesterday's +179K increase in the ADP measure of private employment in November supports the theory that the official non-farm payrolls figures due this morning will show a similar 190K+ gain. That would represent a slowdown from October's reading, but should still be enough to convince the Fed to raise interest rates again later this month.
GBPJPY Tumbles Below Falling Trend Line, Neutral In Medium Term
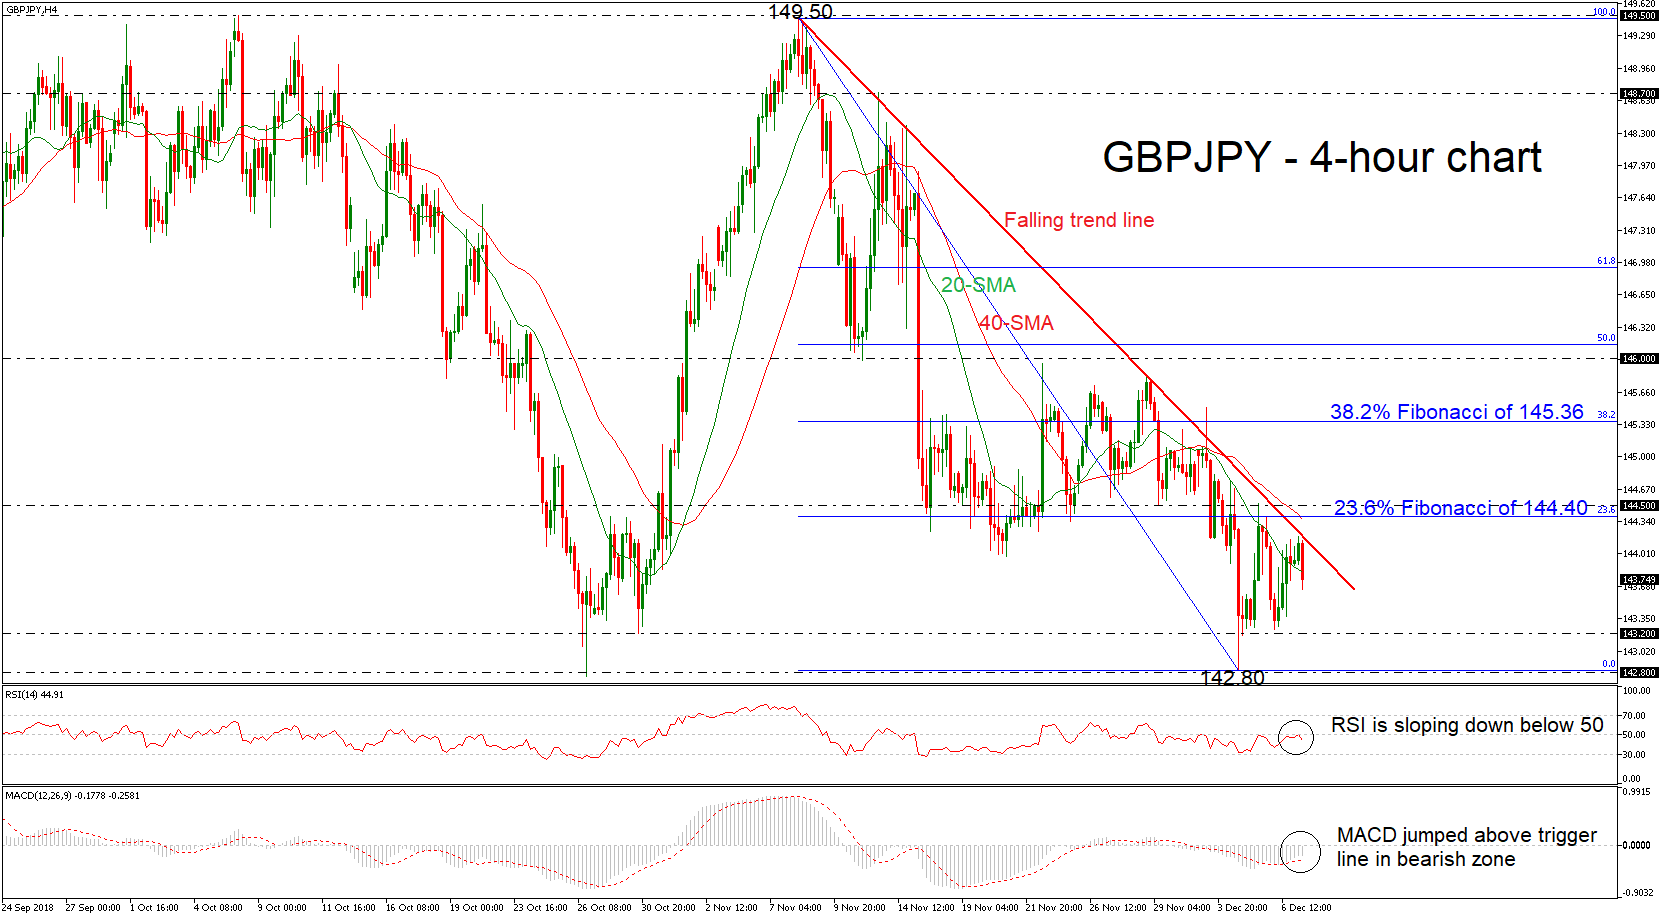
GBPJPY has declined considerably after touching a two-month high of 149.50 at the beginning of November. In the short-term the price seems to be negative, while in the daily chart the pair remains in a sideways channel over the last three months with upper boundary the 149.50 resistance and lower boundary the 142.80 support.
Technically, the RSI indicator is pointing south near the 50 level, while the MACD oscillator is moving above the trigger line and is approaching the zero line.
Immediate support is coming from the 143.20 price level, which it reached on October 30, while even lower the market could challenge the six-week low of 142.80. Marginally below the latter level, the price could open the door for the 142.60 barrier, registered on September 4.
If there is a successful attempt higher and a jump above the short-term falling trend line, GBPJPY could hit the 23.6% Fibonacci retracement level of the downleg from 149.50 to 142.80, around 144.40, and the 145.50 resistance barrier. Also, the price could find resistance around the 40-simple moving average (SMA) which stands near the aforementioned levels. A successful jump above these lines would push the market until the 38.2% Fibonacci of 145.36.
Overall, the neutral picture in the medium term looks to last for a while longer after prices failed to create a rally to exit from the range. In the short-term, the pair has been trading below the descending trend line.
Gold Analysis: Breaks Resistance Of 1,240.00
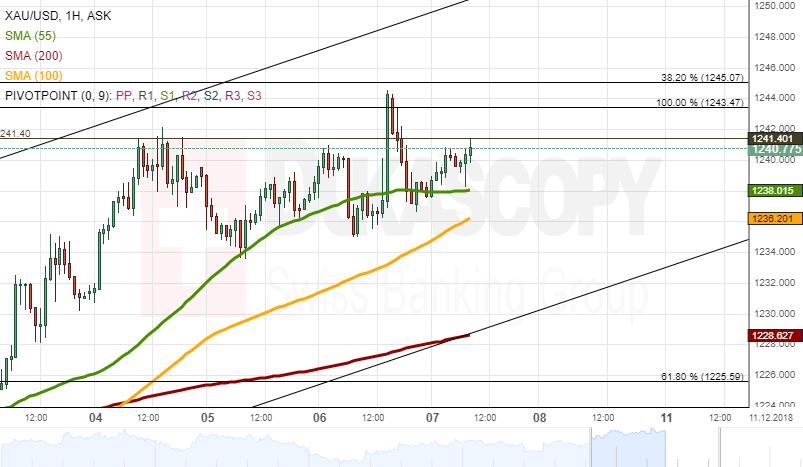
The yellow metal managed to pass in the resistance levels just above the 1,240.00 level and score a new high level during the second half of Thursday's trading session. However, after the surge it retreated back down to look for support in the 55-hour simple moving average.
The SMA provided the needed support and forced the rate into another attempt to surge above the resistance level at 1,241.40, 1,243.47 and 1,245.07. It was expected that eventually the metal's price will pass these levels and reach for new high levels.
On the other hand, the commodity price might trade sideways until the 100-hour simple moving average catches up to the commodity price and pushes the metal higher.
USD/JPY Analysis: Pierces Dominant Pattern
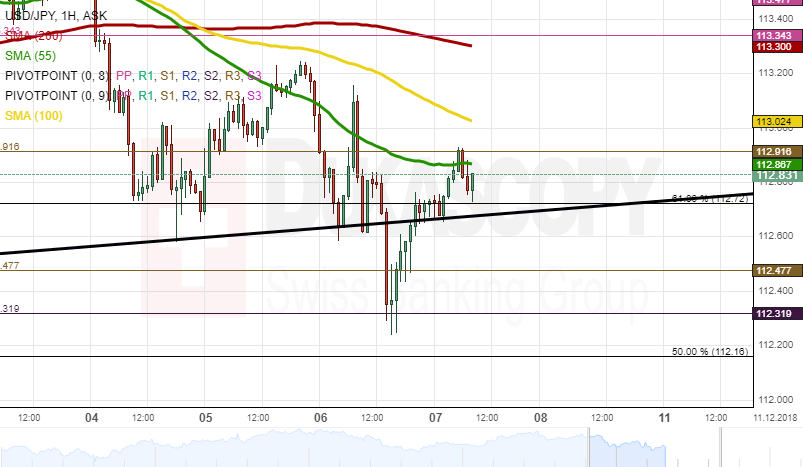
The USD/JPY has pierced the lower trend line of the dominant ascending channel pattern. It is signalling that a head and shoulders pattern exists on the charts. In general, the breaking of the support level indicates that the decline of the USD/JPY should continue.
On Friday morning the currency exchange rate was squeezed in between a Fibonacci retracement level at 112.70 and a pivot point at 112.90. It was most likely expected that the 55 and 100-hour simple moving averages will approach the rate from the upside and push it down through the Fibo retracement.
On the other hand, the Fibo might hold due to the strength of the already pierced trend line. The reason for this assumption is that the rate had been still influenced by the trend line of the pattern after it returned to the borders of the broken pattern.
GBP/USD Analysis: Will Test Support Level At 1.2700
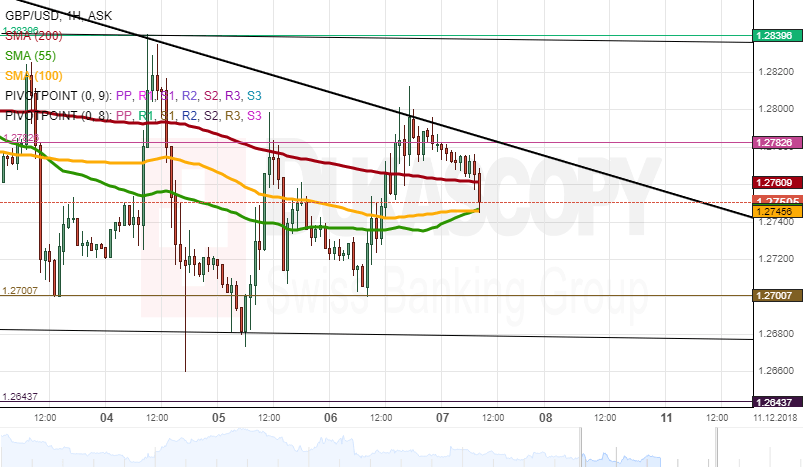
The British currency on Thursday found support in the pivot point at 1.2700 and surged through various simple moving averages to reconfirm the upper trend line of the large scale descending pattern near 1.2800.
By the middle of Friday's trading session the GBP/USD was retreating downwards from one support level to another. The pair was expected to pass the support levels at 1.2750 and decline down to the 1.2700 level. Afterwards, the lower trend line of a medium scale pattern near 1.2680 should be approached.
Meanwhile, note that any of the support levels might stop the decline. Moreover, the Brexit news still highly impact all of the GBP pairs causing sudden swings up and down.
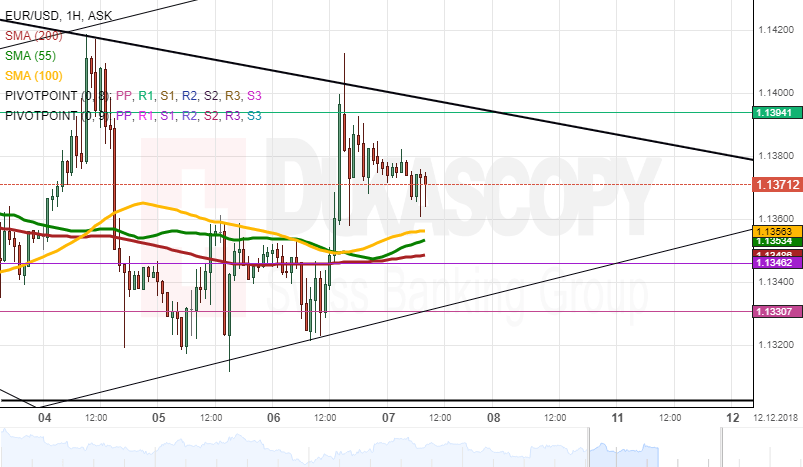
EUR/USD Analysis: Declines After Once More Touching 1.1400
The common European currency managed to pass the strength of three simple moving averages on Thursday against the US Dollar. In the aftermath of the breaking of these resistance levels, the currency pair surged up to the dominant pattern's resistance line and bounced off it to begin a decline.
On Friday, the decline was expected to reach the previously mentioned simple moving averages near the 1.1350 mark. In general, the pair should pass these support levels and a pivot point, which was locate at 1.1346, to continue its decline. The decline eventually should once more test the lower trend line of a junior pattern.
Although, any of the mentioned support levels can slow down the decline of the EUR/USD and force it into a retracement or a short term surge.