Sample Category Title
AUD/CHF 4H Chart: Surge Insight
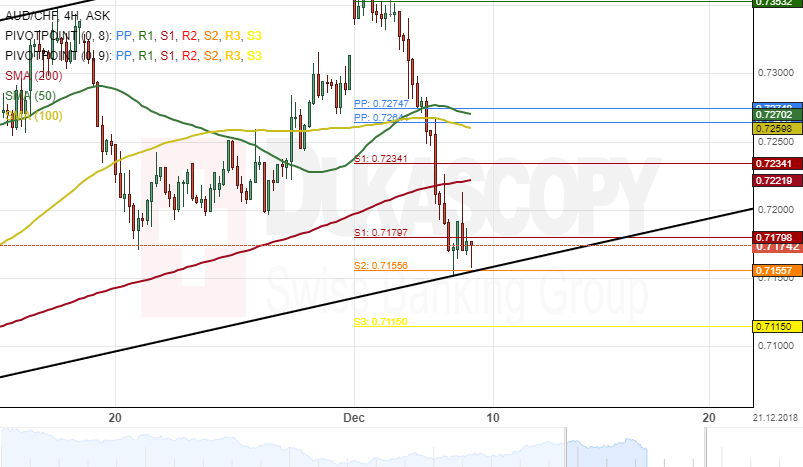
The Australian Dollar has been trading in a three-month ascending channel pattern against the Swiss Franc. The exchange rate bounced off its lower boundary on September 10 and followed by an upside wave.
The currency pair was trading near the bottom border of the channel pattern at 0.7170 during the morning hours of Friday's session.
If the support level set by the lower boundary of the given channel holds, the currency exchange rate will aim at a resistance cluster formed by the weekly, the monthly PPs and the combination of the 50– and 100-hour SMAs at 0.7261.
However, technical indicators suggest that this advances might not happen immediately.
CHF/JPY 4H Chart: Breaches 50-Hour SMA
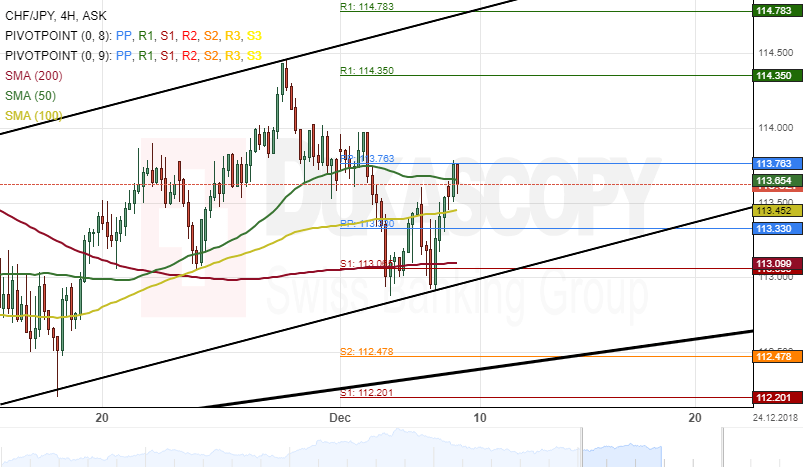
The Swiss Franc has been appreciating against the Japanese Yen in an ascending channel pattern since the end of October when the currency pair reversed from the bottom border of its channel at 112.00.
The CHF/JPY exchange rate breached the 50-hour simple moving average at 113.65 during the Asian session on Friday.
As for the near future, it is likely that bullish traders could push the currency exchange rate towards the upper boundary of the channel pattern at 114.78 during the following trading sessions.
Furthermore, technical indicators are in favour of bullish momentum within this session.
USD/JPY Outlook: Positive Signal On Strong Downside Rejection On Thursday Looks For Confirmation On Strong US Jobs Data
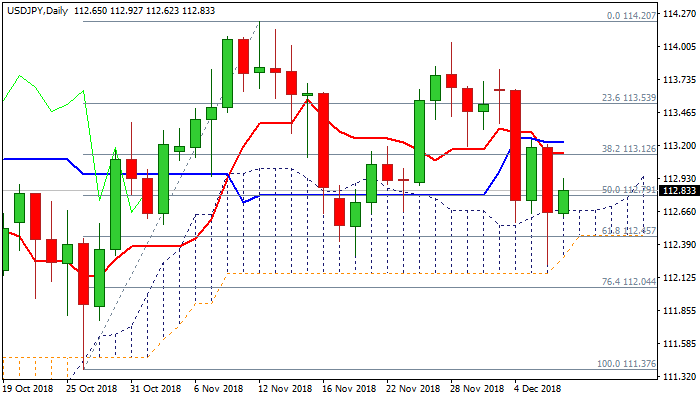
The pair holds above daily cloud in early European trading on Friday and shows scope for further recovery, as cloud top (112.67) remains key near-term support.
Thursday's strong fall penetrated daily cloud and was contained by 100SMA just ahead of cloud base (112.16), with subsequent bounce leaving long-tailed daily candle.
This signaled strong downside rejection and along with repeated close above daily cloud top, suggesting that bears lack strength for sustained break lower and fresh recovery could be likely near-term scenario.
Rising bullish momentum on daily chart supports the notion, with recovery facing a cluster of daily MA's between 113.05 and 113.30, close above which would signal reversal and expose targets at 113.82/114.03 (03 Dec/28 Nov highs).
Strong US jobs data today would add to positive signals. Bearish scenario requires close below daily cloud base/100 SMA to signal further weakness.
Res: 112.92, 113.05, 113.30, 113.65
Sup: 112.67, 112.25, 112.16, 112.04
EUR/USD – Euro Drifting As Investors Await U.S Nonfarm Payrolls
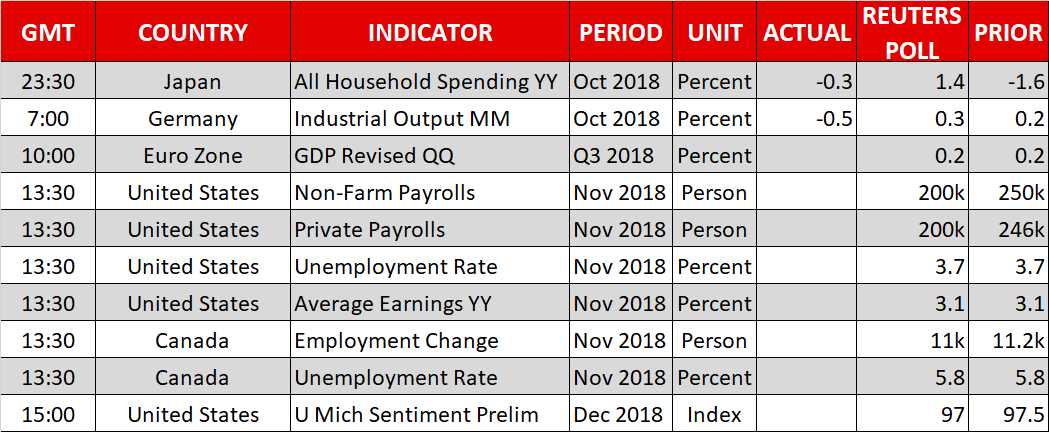
EUR/USD is almost unchanged in the Friday session. Currently, the pair is trading at 1.1375, down 0.01% on the day. It’s a busy day for economic indicators on both sides of the pond. German industrial production disappointed with a decline of 0.3%, shy of the estimate of 0.5%. Later in the day, the eurozone releases employment change and revised GDP for the third quarter. Both indicators are expected to dip to 0.2%. In the U.S, the focus in on employment numbers, highlighted by wage growth and nonfarm payrolls. The week wraps up with UoM consumer confidence.
U.S employment data was soft on Thursday, raising concerns that the red-hot labor market could be slowing down. The November ADP nonfarm payrolls was expected to drop, but the plunge was much sharper than expected. The indicator fell to 175 thousand, missing the estimate of 195 thousand. If this is a precursor of the official nonfarm payrolls report on Friday, the U.S dollar could retreat against its major rivals. Unemployment claims also disappointed, as the reading of 231 thousand was above the forecast of 226 thousand. There was better news from the services sector, as ISM Non-Manufacturing PMI improved to 60.7, easily beating the estimate of 59.1 points.
Nervous investors continue to fret over the U.S-China trade war. There was some optimism early in the week after President Trump agreed to suspend further tariffs against China for 90 days. However, there are concerns that the two sides will not be able to close the gaps in their positions in just a few weeks. The markets soured on Thursday, after a senior Chinese executive, Meng Wanzhou, was arrested in Vancouver for allegedly violating trade sanctions against Iran. Wanzhou faces extradition to the U.S., and China’s indignant response to the arrest could torpedo upcoming trade talks between the two countries.
US NFP & The Dollar Index , Soft Brexit Or No Brexit, OPEC The Critical Number
The US NFP is the most important economic number for traders and they like to dissect this number into smaller pieces in order to have a better understanding of the health of the labour market.
The dollar index is set for a weekly drop ahead of this critical report. The weekly drop in the dollar price is mainly due to some qualms that hiring may have eased off over in the U.S. But, we do think that the downside may be limited for the dollar index from here and the greenback may start to consolidate around its current level (trading range between 95-97). Year-to-date; the dollar index is still up nearly 5.19% which is far stronger performance than any equity market in the developed countries.
The ADP data usually sets the tone for the US NFP number and it confirmed that the private payrolls number jumpted to 179K last month missing the forecast of 195K. The ISM manufacturing PMI released earlier this month painted a more optimistic picture as it came ahead of the forecast (actual 59.3 vs forecast 57.5) and this is despite the fact that trade war has dampened the outlook.
As for Brexit, softer Brexit is still a likely scenario because it is widely expected that Theresa May’s deal will fail in the UK parliament vote on Monday. However, she has another plan; buy more time to avoid the humiliation in the parliament. The Brexit vote may not take place in parliament on Monday as her Tory allies have advised her to postpone the crunch vote. A defeat in the parliament would trigger fresh attempts to topple her government. So, the likely scenario for her is to re-open the negotiations with Brussels and start a conversation around a better deal which may be backed by the parliament.
So far she has denied the possibility of delaying the vote and this has kept the sterling traders on the edge. We are still holding the critical support level of 1.27 against the dollar, however, this support is under threat.
Back in the commodity market, OPEC will pick up things where they left off yesterday. No decision was made yesterday in relation to the production cut as the cartel was still discussing the outcome. For the first time in five years, the cartel has been unable to decide on the oil production cut because Russia has decided to flex it’s muscles. The problem is that not everyone is on board in relation to the production cut and most importantly the quantity of the cut. Then on top of this, Saudis are under pressure from President Trump as well who has made one thing very clear; he doesn’t support any production cut, he wants the taps flowing.
Nonetheless, I think that one million barrels per day is the number which is priced in the market so far. If we see production cut over 1.4 million b/d, this could bring some spike in the oil price. Crude price could jump from it’s current level of $51 to $55. As for the other side of the coin, anything less than a million could support the bear case and the price could drop to $45.
Bitcoin And Ethereum At Critical Junction
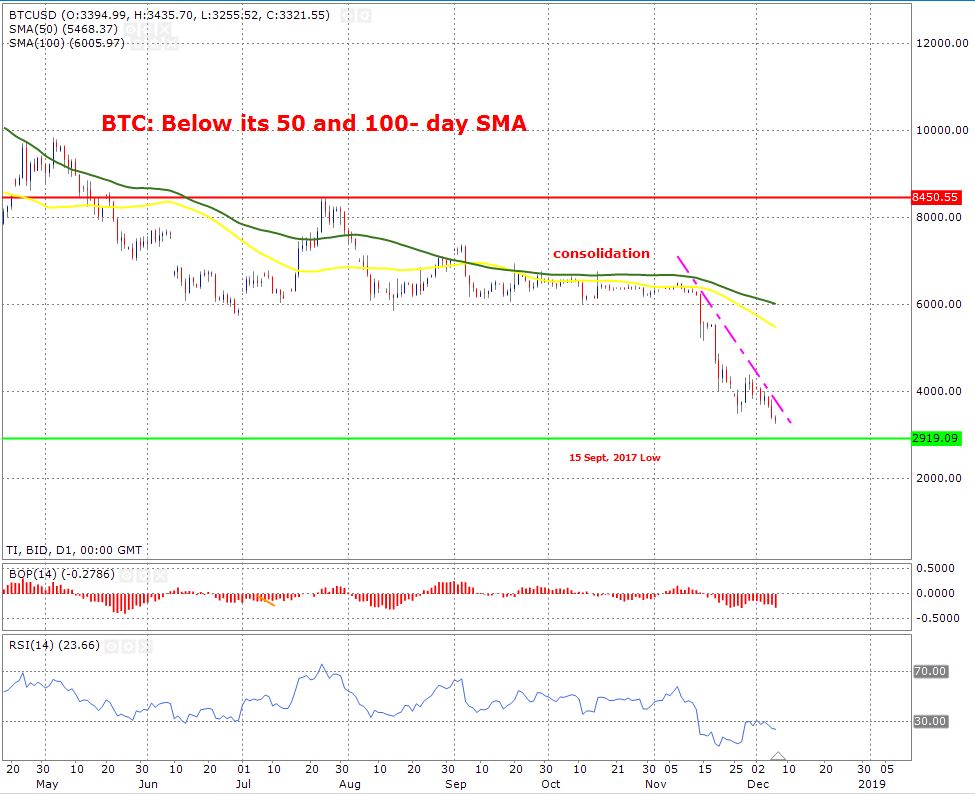
Hopes for Bitcoin Exchange traded fund becoming a reality this year were dashed by the SEC’s decision yesterday. There will be no Bitcoin ETF this year. The price of Bitcoin has crippled on the back of this and I think it is likely that the price may not only drop below the $2K mark, but with this kind of momentum behind it, the price can test the 1500 level.
Simply put, the bad news keeps coming just like cockroaches coming out of a hole.
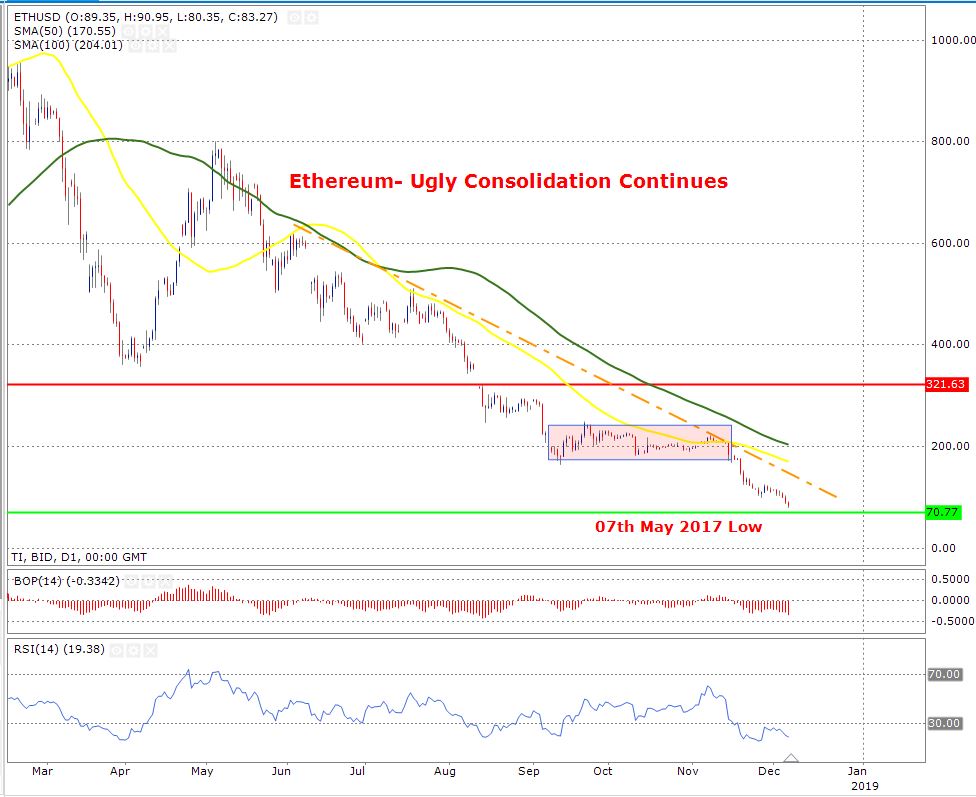
If we look at the Ethereum price, the future God of the crypto market (once it was called this), it is being treated worse than a narcos mafia head. It has lost all the potential and the fact that the price has dropped below the key psychological level of $100, this is the most bearish sign to date.
But again, this is a crypto market which has the ability to blow your mind and the downside is limited and the price at its current level represents an opportunity of a lifetime.
In terms of technical analysis, the price has failed to break above the downward trend line and this confirms that the downtrend is strong. It seems like that the price may test the next support which is shown by the green horizontal line.
Ethereum price is very close to its long term support zone shown by the green horizontal line on a daily time frame. The RSI is showing extreme reading and it is trading below the 30-mark. Any reading below 30 usually brings bulls back into the market.
USD Is Between Trade Wars And A Possible Slowdown
The USD weakened yesterday, as the US Treasury bond yields dropped and the fears of a possible reigniting of the US-Sino trade wars sparked. After the uneasy 90 day truce being agreed at the G20 meeting between US president Trump and Chinese president Xi, Canadian authorities arrested the CFO of Huawei, a large Chinese company, at the request of the US. The arrest spread fear among investors, for a possible escalation of the US-Sino trade frictions but the White House distanced itself from the arrest. On other news, the USD weakened as US bond yields kept falling yesterday and there was renewed speculation of a possible imminent pause in the Fed’s tightening cycle, after a possible December rate hike. We expect today’s US employment report to be under the market’s watchful eye for further indications affecting the Fed’s future intentions.
USD/JPY dropped yesterday breaking the 112.72 (S1) support line, however regained some of the lost ground during the Asian session today. We maintain a bearish bias for the pair’s direction, as a downward trendline could be forming since the 30th of November, however the pair’s direction could be dependent on a number of issues as mentioned in the fundamental analysis. Should the pair’s direction be dictated by the bulls of the market, we could see the pair breaking the 113.25 (R1) resistance line, while if the bears take over, we could see the pair breaking the 112.72 (S1) support line and aim for the 112.15 (S2) support line.
OPEC negotiations to linger on
OPEC concluded its meeting yesterday, without reaching an agreement as Russia is in disagreement about the discussed oil production cuts. According to media reports, Saudi energy minister stated that he isn’t confident of an agreement in the next day of the negotiations. Analysts still expect some kind of production cuts to be announced, however pointed out that Russia remains the sticking point to an agreement, underscoring the Non-OPEC member’s influence. On other news, the US announced that it has turned into a net oil exporter for the first time in over 75 years. Negotiations are expected to continue today in Vienna and the oil market could experience renewed volatility.
WTI’s prices yesterday, dropped breaking the 52.10 (R1) support line (now turned to resistance), regained some ground later on, however proved unable to break above the 52.10 (R1) resistance line. We continue to regard oil prices as sensitive to any decision taken at the OPEC+ meeting (probably today), despite the wait and see position of the oil market over the past few days. Should the market favor the pair’s short position, we could see it breaking the 49.40 (S1) support level and aim for the 47.35 (S2) support barrier. On the other hand should the bulls take over, we could see oil prices breaking the 52.10(R1) resistance line and aim for the 54.15 (R2) resistance hurdle.
In today’s other economic highlights:
In today’s European session, we get Germany’s industrial output growth rate for October. In the American session from the US we get the US employment report with the NFP figure, the unemployment rate and the average earnings growth rate. Furthermore from the US we get the preliminary U. Michigan Sentiment for December and the Baker Hughes oil rig count figure. Staying in the America’s, we get Canada’s unemployment data for November. As for speakers, ECB’s Benoit Coeure (08:30, GMT) and Fed’s Lael Brainard (17:00, GMT) speak.
WTI H4
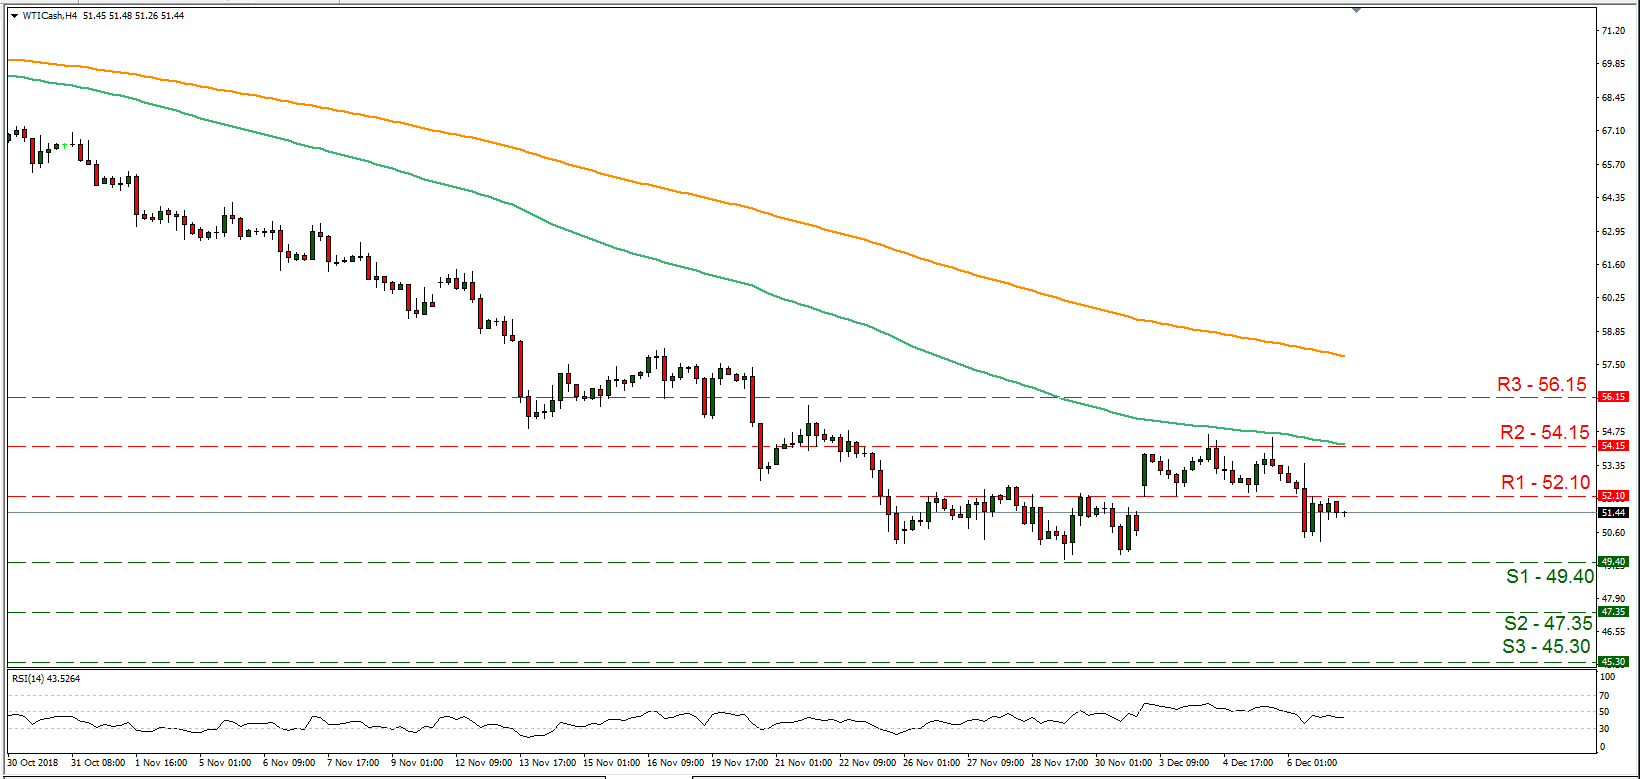
Support: 49.40 (S1), 47.35 (S2), 45.30 (S3)
Resistance: 52.10 (R1), 54.15 (R2), 56.15 (R3)
USD/JPY H4
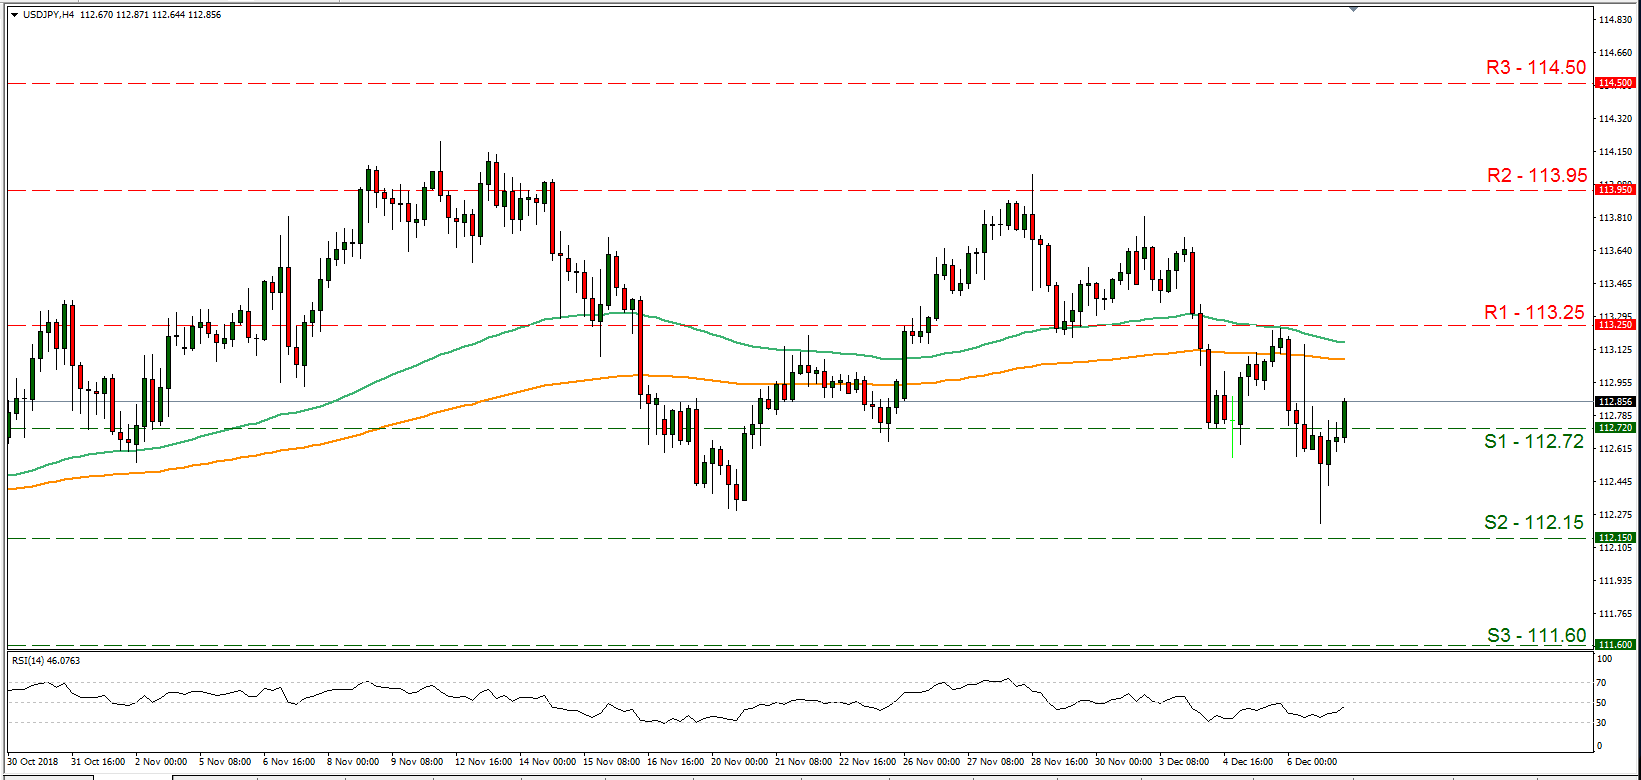
Support: 112.72 (S1), 112.15 (S2), 111.60 (S3)
Resistance: 113.25 (R1), 113.95 (R2), 114.50 (R3)
US Labour Market Report Is In The Spotlight
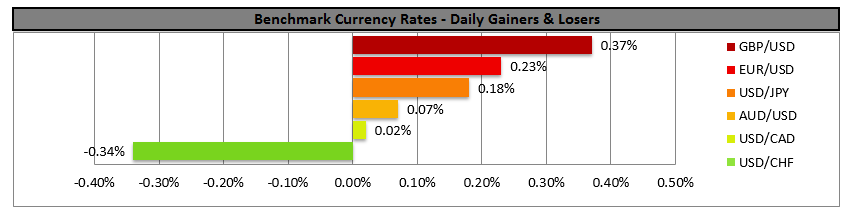
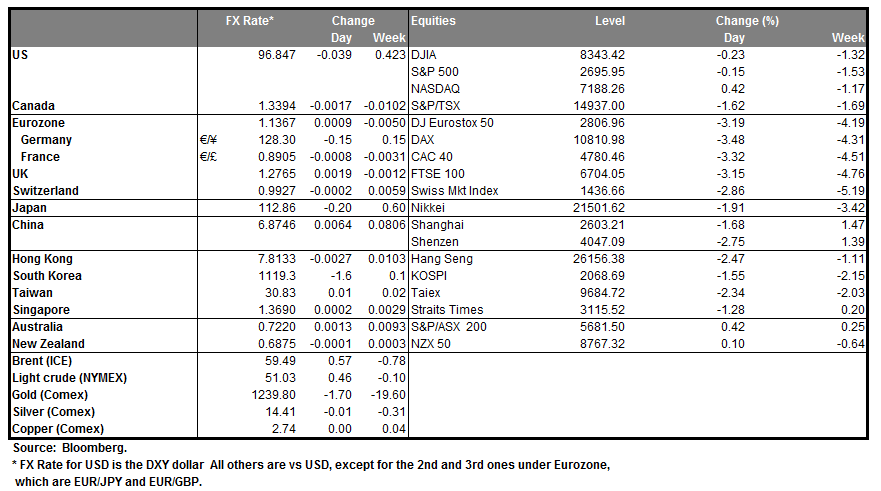
Yesterday USD weakened against the basket of major currencies. The USD index (#DX) closed in the red (-0.25%). The investors are waiting for the release of the US Labour Market reports for November. The preliminary data by ADP are remarkably weak. The number of the new industrial workers lowered to 179K vs. the expected 196K, while the previous data was corrected from 227K to 225K. At the same time, the Non-Industrial PMI by ISM grew to 60.7 instead of 59.2.
CAD keeps losing positions against the USD due to weak economic reports. The trading balance is -1.17B instead of the expected -0.7B. The PMI by Ivey lowered to 57.2 instead of 60.3. Canada will publish its Labour Market reports today.
Prices on oil keep decreasing. The WTI futures are close to 51 USD/barrel. At 20:00 (GMT+2) Baker Hughes will publish the reports on the oil rigs in the US.
Market Indicators
- Yesterday the US stock market showed a variety of trends: #SPY (-0,15%), #DIA (-0,40%), #QQQ (+0,71%).
- The 10-year US government bonds yield keeps lowering. Right now it is at 2.87-2.88%.
The Economic News Feed for 07.12.2018:
- GDP Report (EU) – 12:00 (GMT+2:00);
- Labour Markets Reports (US) – 15:30 (GMT+2:00);
- Labour Markets (Canada) – 15:30 (GMT+2:00).
Dollar Moves Off Lows Ahead Of US Jobs Report But Weighed By Talk Of Fed Pause
- US dollar edges up from lows as risk sentiment improves, but expectations that the Fed could soon pause its rate hike cycle limit gains
- US Treasury yields fall sharply on Wall Street Journal report that Fed is considering “wait-and-see” approach
- Pound steady despite May pondering whether to delay Brexit vote
- Oil under pressure again as OPEC struggles to reach output agreement, awaits for Russia to join talks before making decision
Dollar firmer ahead of nonfarm payrolls report
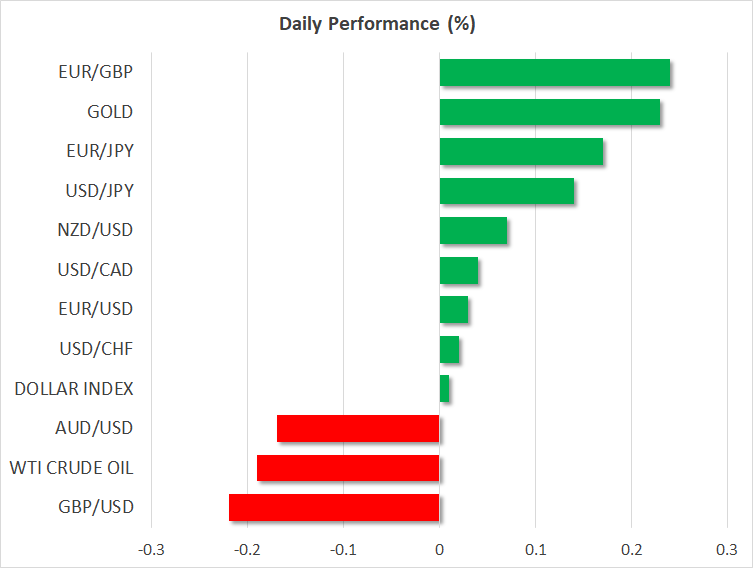
The US dollar managed to bounce off one-month lows versus the yen despite reports from the Wall Street Journal that the Federal Reserve is considering whether it should adopt a “wait-and-see” approach before making further rate hikes. The Fed next meets on December 18-19 and another rate hike is widely priced in by the markets. But emerging expectations that the Fed could pause after December have pulled the yield on US Treasury note sharply lower, leading to a partial inversion in the yield curve.
The yield on 10-year notes touched a 3-month low of 2.826% yesterday, but despite this weighing on the dollar, the US currency’s declines have been relatively modest as trade tensions continue to provide the greenback some safe-haven support. Dollar/yen was last trading at 112.76, while the dollar index was marginally higher at 96.83.
Traders will now be looking to the November jobs report out of the US, due at 1330 GMT, for fresh clues on the health of the US economy. In remarks on Thursday, Fed Chairman Jerome Powell said the US labour market was “very strong”. But any signs of weakness in today’s report could fuel speculation that the Fed is nearing the end of its rate hike cycle.
Stocks make tepid recovery as risk sentiment improves
Asian stocks attempted to recover from the recent sell-off as shares on Wall Street pared earlier sharp losses. Stocks in Europe also opened higher, but markets remain fragile amid doubts about whether the trade truce agreed between the US and China at last weekend’s G20 summit will hold. The arrest of a senior Huawei executive in Canada for extradition to the US risks upsetting relations at a time when the two sides appear to be making some progress in resolving their months-long trade dispute.
Hopes remain though, that the US and China will be able to negotiate some sort of a trade deal after President Trump tweeted overnight that he agreed with Chinese officials’ statement that an agreement can be reached within the next 90 days.
Euro and pound flat, supported by softer dollar
The euro and the pound struggled for direction on Friday as Italy’s coalition government appeared no closer to agreeing how to reduce the country’s deficit for 2019 in a way that would satisfy the European Commission, while in the UK, the prime minister, Theresa May, is reportedly considering postponing the Brexit deal vote on December 11.
May has been warned by her party that she is headed for a landslide defeat if she goes ahead with the vote next Tuesday. Delaying the vote could give her more time to find ways to make the deal more sellable to MPs. But as UK politicians struggle to find common ground, talk of a second referendum has been increasing in recent days.
The euro was last down slightly at $1.1365 and sterling was 0.3% lower at $1.2744.
Oil prices slip as OPEC fails to reach agreement; Russia to join talks
OPEC countries were unable to reach an agreement on cutting output at a meeting in Vienna on Thursday amid opposition from Iran. But OPEC delegates are hoping that a decision can be made once Russia joins the talks later today.
In the meantime, oil prices faced more downside pressure on the lack of progress by major producers to decide on output levels. WTI and Brent both fell by more than 5% at one point yesterday before recouping some of their losses, helped by a much bigger-than-expected drawdown in US crude stocks last week. WTI was last down 0.4% at $51.30 a barrel and is at risk of a further sell-off if OPEC+ countries fail to reach any agreement.
The Canadian dollar also stands to fall steeply if there is no output cut. The loonie has already been on the backfoot this week after the Bank of Canada took a more cautious stance on the pace of future rate hikes at its policy meeting on Wednesday. A deeper slide in oil prices would make it more difficult for the BoC to hike rates again in the near term and the loonie would likely break below yesterday’s 1½-year low of C$1.3443 per US dollar. However, there could be some support for the loonie from today’s Canadian employment numbers, due at 1330 GMT, if they point to a strong jobs market.
In other commodities, the weaker dollar helped propel gold to 20-week highs. The precious metal last stood around $1240.50 an ounce.
USDCAD Increasingly Bullish At 1 ½-Year Highs, Could Be Overbought
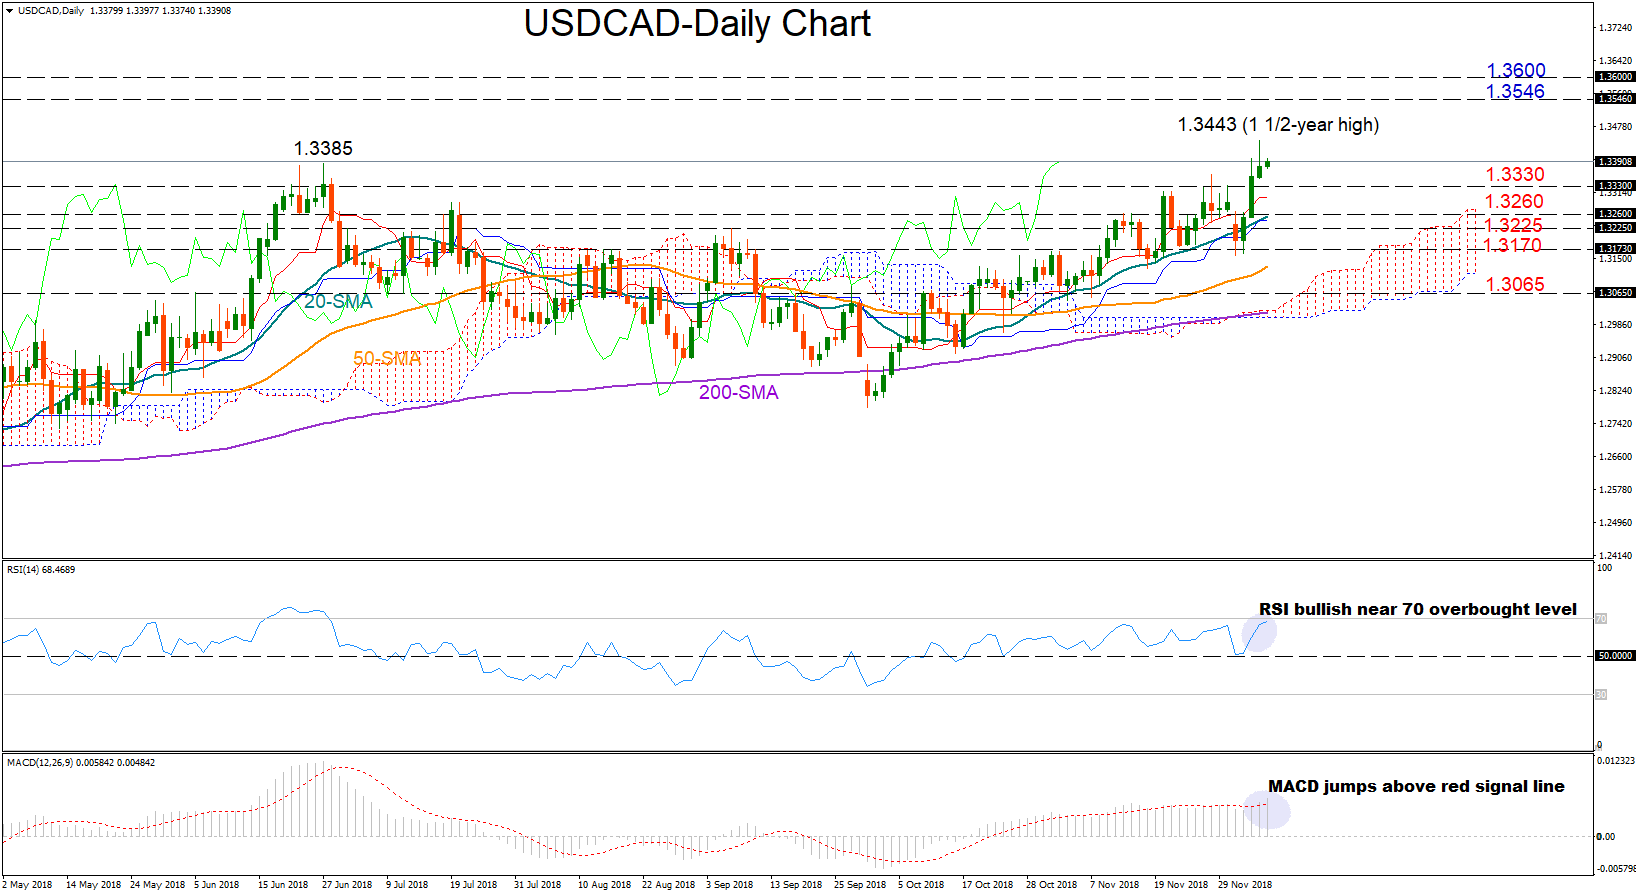
USDCAD pierced a key resistance around 1.3385 on Thursday and spiked to a 1 ½-year high of 1.3443, deviating further above its moving averages which are positively sloped, a sign that the uptrend could continue.
Momentum indicators are also in bullish territory, with the MACD crossing above its red signal line and the RSI fluctuating well above its 50 neutral mark. Yet downside corrections cannot be ruled out in the short term as the latter is just about to touch the 70 overbought limit.
An extension to the upside would likely retest yesterday’s peak of 1.3443. Higher than that, positive momentum could speed up towards the 1.3546-1.3600 area, where bullish action paused in previous years, whilst a break of that region could send the price up to 1.3792, the top on April 2017.
A reversal to the downside could rest around 1.3330, while lower, the pair could pause between the familiar key levels of 1.3260 and 1.3225. Below that, the 1.3170 barrier could offer support as well, though if that fails to hold, the next stop could be near 1.3065.
Looking at the bigger picture, the recent rally indicates that the pair is preparing to exit neutrality and start a bullish phase, with the 50-day simple moving average supporting this view; the line is gaining strength again above the 200-day SMA.
Summarizing, USDCAD is bullish in short term, while in the medium term the outlook is neutral to positive.