Sample Category Title
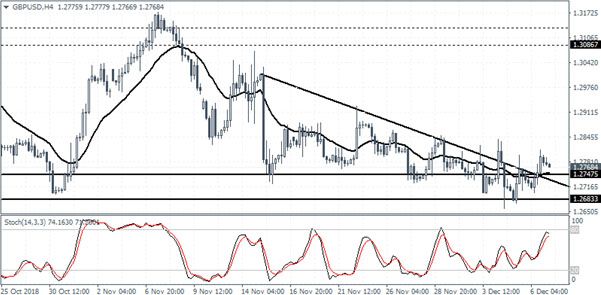
DAX Under Pressure
Pivot (invalidation): 10960.00
Our preference Short positions below 10960.00 with targets at 10730.00 & 10610.00 in extension.
Alternative scenario Above 10960.00 look for further upside with 11060.00 & 11160.00 as targets.
Comment The RSI is bearish and calls for further downside
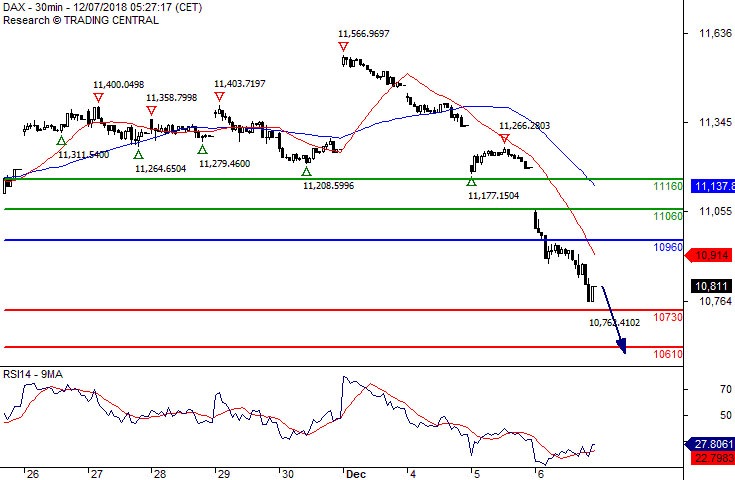
Crude Oil Bullish Bias Above 50.85
Pivot (invalidation): 50.85
Our preference Long positions above 50.85 with targets at 52.05 & 52.60 in extension.
Alternative scenario Below 50.85 look for further downside with 50.10 & 49.40 as targets.
Comment Even though a continuation of the consolidation cannot be ruled out, its extent should be limited.
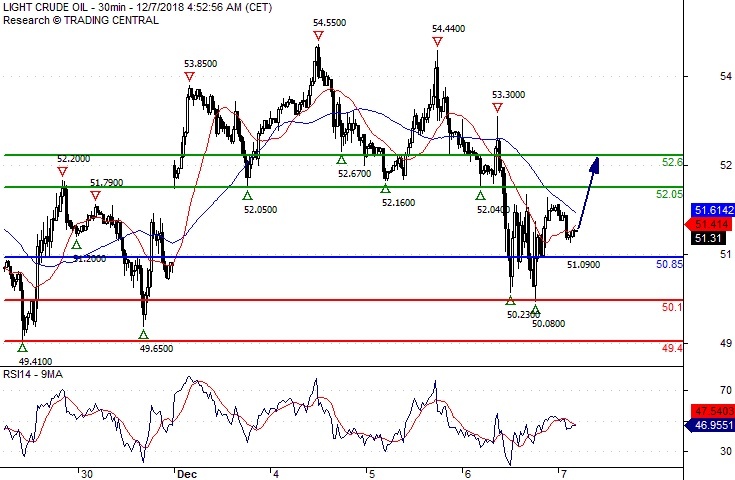
Silver Spot Key Resistance At 14.5100
Pivot (invalidation): 14.5100
Our preference Short positions below 14.5100 with targets at 14.3800 & 14.3200 in extension.
Alternative scenario Above 14.5100 look for further upside with 14.5800 & 14.6600 as targets.
Comment The RSI is mixed and calls for caution.
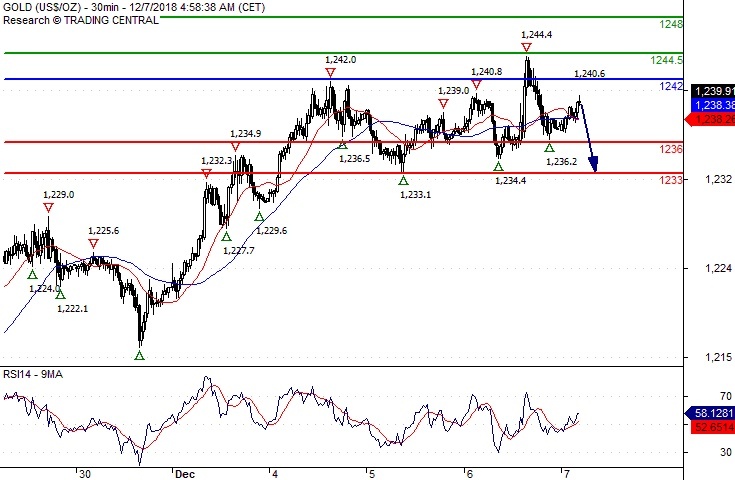
Gold Spot Consolidation
Pivot (invalidation): 1242.00
Our preference Short positions below 1242.00 with targets at 1236.00 & 1233.00 in extension.
Alternative scenario Above 1242.00 look for further upside with 1244.50 & 1248.00 as targets.
Comment As Long as 1242.00 is resistance, look for choppy price action with a bearish bias.
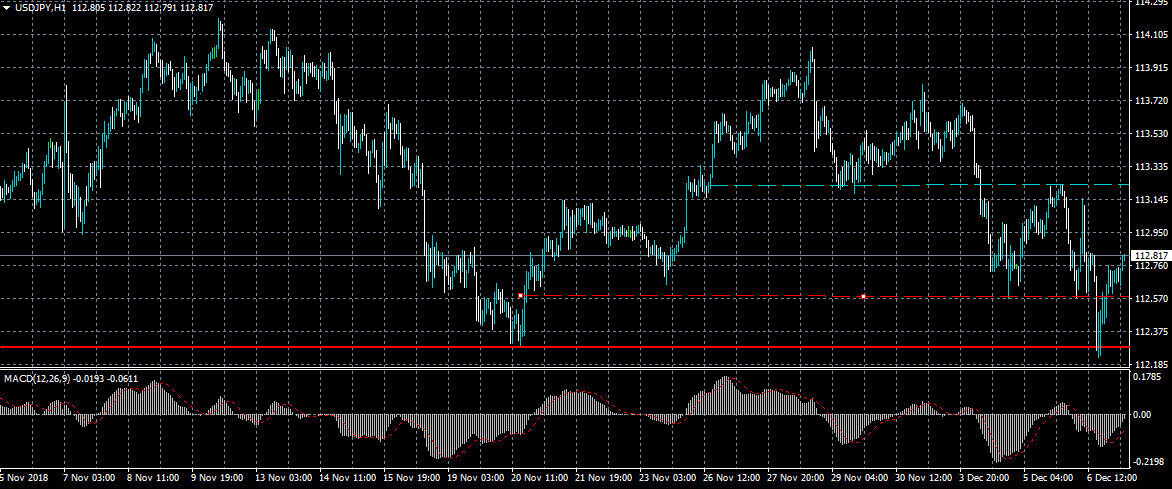
USDJPY Beatish Pattern Forming
The US dollar has tumbled to a fresh weekly low against the Japanese yen, following a sharp move lower in US equity markets. The USDJPY pair has formed a large head and shoulders pattern, with the neckline located at the 112.20 support region. The next directional move in the USDJPY pair will likely come after the release of the US Nonfarm Payrolls job report for the month of November.
The USDJPY pair is strongly bearish while trading below the 112.57 level, key support is found at the 112.20 and 111.50 levels.
If the USDJPY pair moves above the 113.00 level, key resistance is then found at the 113.20 and 113.90 levels.
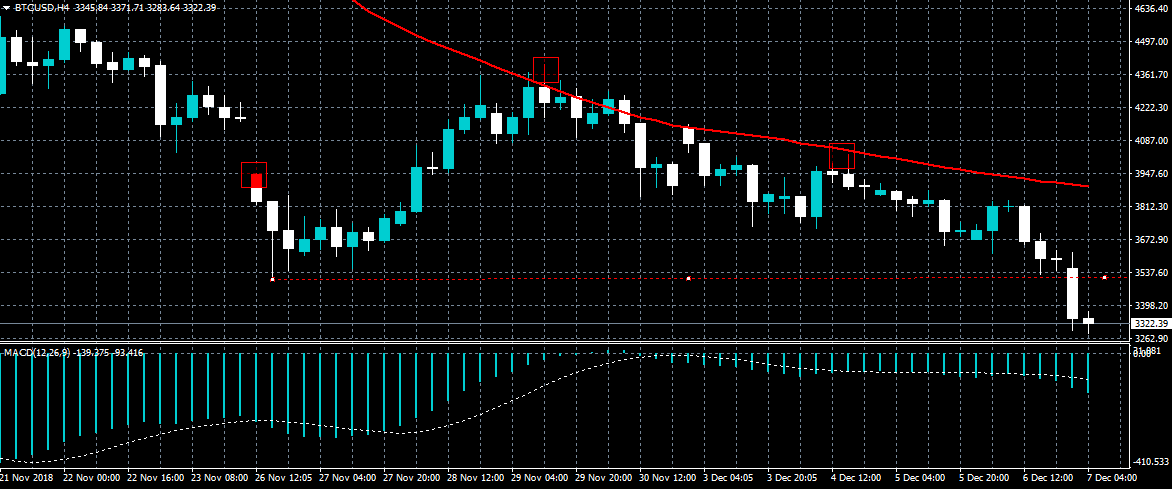
BTCUSD Breaks Neckline Support
Bitcoin has tumbled a fresh 2018 trading low, as investor confidence towards cryptocurrencies continues to erode. The BTCUSD pair has fallen below the $3,507 support level, triggering a bearish head and shoulders pattern. The downside projection for the bearish pattern is around $800.00, which would send the number one cryptocurrency well below the $3,000 support level.
The BTCUSD pair is strongly bearish while trading below the $3,507 level, key support is now located at the $3,000 and $2,700 levels.
If the BTCUSD pair moves above the $3,507 level, key resistance is found at the $3,800 and $4,000 levels.
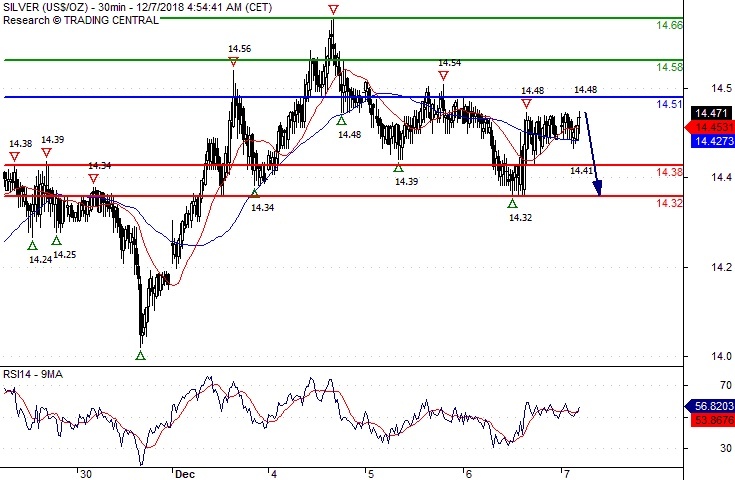
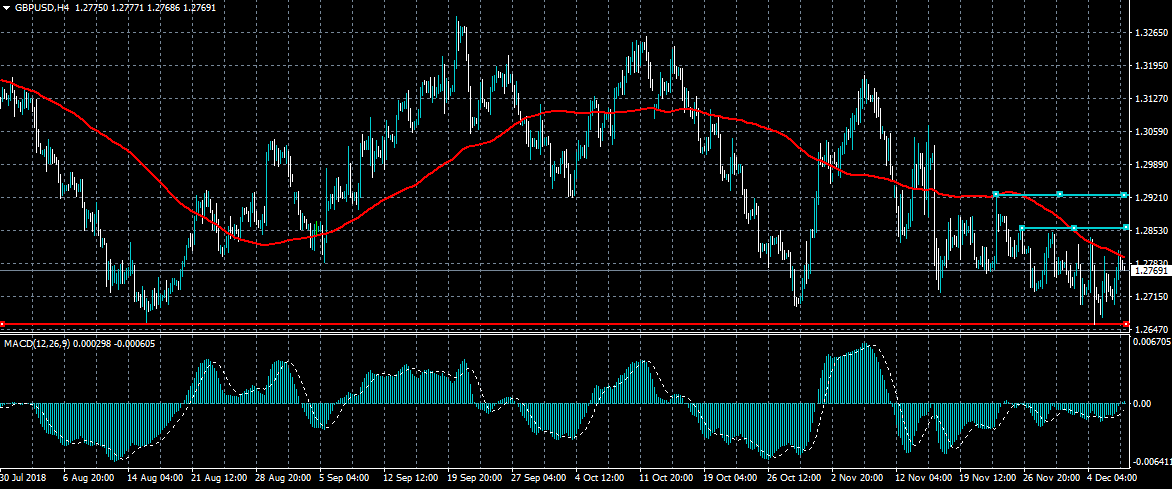
GBPUSD Moving Average Resistance Holds
The British pound is attempting to correct higher against the greenback, as the US dollar comes under mild selling pressure ahead of the release of the US monthly jobs report. The GBPUSD pair’s 100-period moving average on the four-hour time frame has been capping upside moves since late November. As long as price continues to trade below this key moving average, the short-term trend for sterling remains bearish.
The GBPUSD pair is bearish while trading below the 1.2790 level, key technical support is found at the 1.2700 and 1.2657 levels.
If the GBPUSD pair trades above the 1.2790 level, key resistance is found at the 1.2855 and 1.2925 levels.
Crude Oil Unchanged As US Becomes Net Exporter
The Japanese yen declined in the Asian session after weaker-than-expected household data. In October, spending contracted at an annualized rate of minus 0.3%. This was weaker than the growth of 1.2% traders were expecting. On a monthly basis, spending increased by 1.8%, which was higher than the estimated 1.4%. The average cash earnings rose by an annual rate of 1.5%, which was lower than the consensus estimate of 1.0%. This data measures the change in the employment income including overtime pay.
Crude oil was largely unchanged even after supportive inventory data from the US. Data released by the EIA showed that inventories sunk by more than 7 million barrels. This was much lower than the contraction of about 900K barrels they were expecting. Previously, API data had shown an increase in inventories by more than 5.3 million barrels. The drawdown reported by EIA was the first since September this year. Meanwhile, data from EIA showed that the US exported more crude oil than it imported for the first time in decades last week. This has been a goal of many administrations.
The US dollar was little moved ahead of this week’s Non-Farm Payrolls data. The numbers are expected to show that the economy added 200K jobs in November after adding 250K in October. The unemployment rate is expected to remain at 3.7% while the participation rate is expected to remain at 62.9%. This data will come a day after ADP’s numbers showed that 179K people were hired. Meanwhile, Fed Chair Jerome Powell said that the economy’s job position was very strong in what sounded like a hawkish statement. He said this at a housing conference in Washington.
EUR/USD
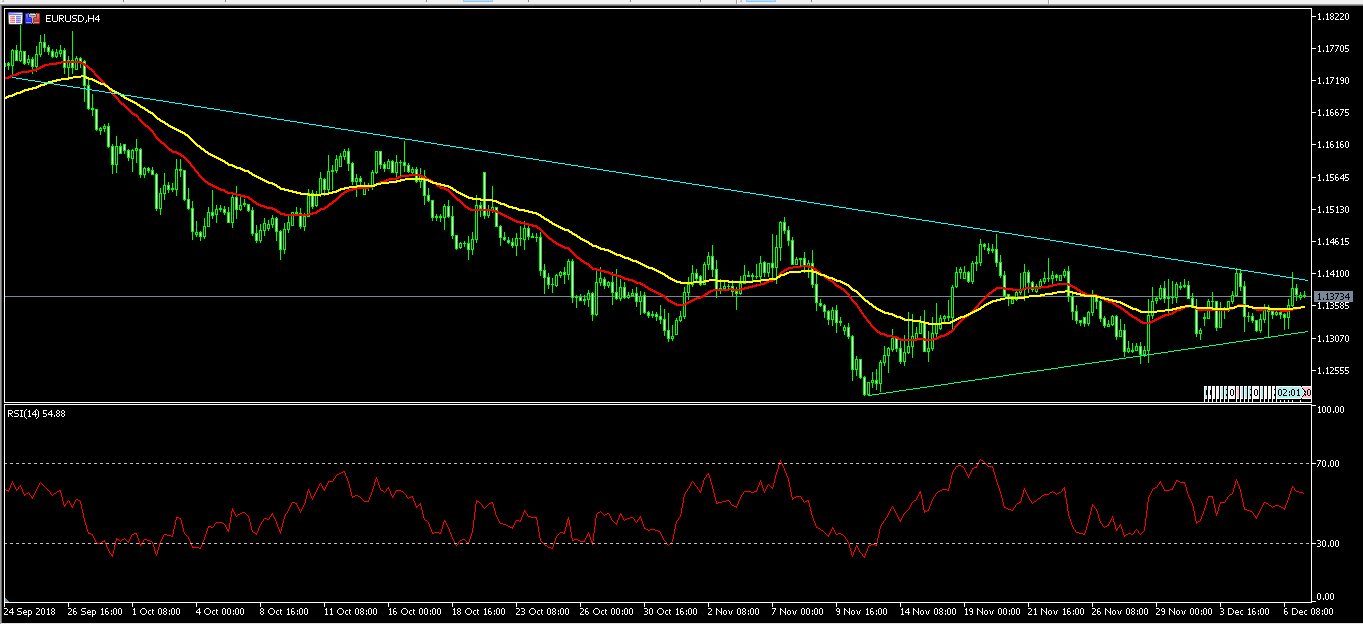
The EUR/USD pair is trading at 1.1373, which is close to where it has been trading this week. Throughout the week, the pair has been forming a triangle pattern and with US jobs numbers expected today, it is likely to breakout in either direction. The RSI is at 54, which is considered a neutral level and so are the moving averages. Therefore, today might be an important day for the pair because of the NFP numbers.
USD/JPY
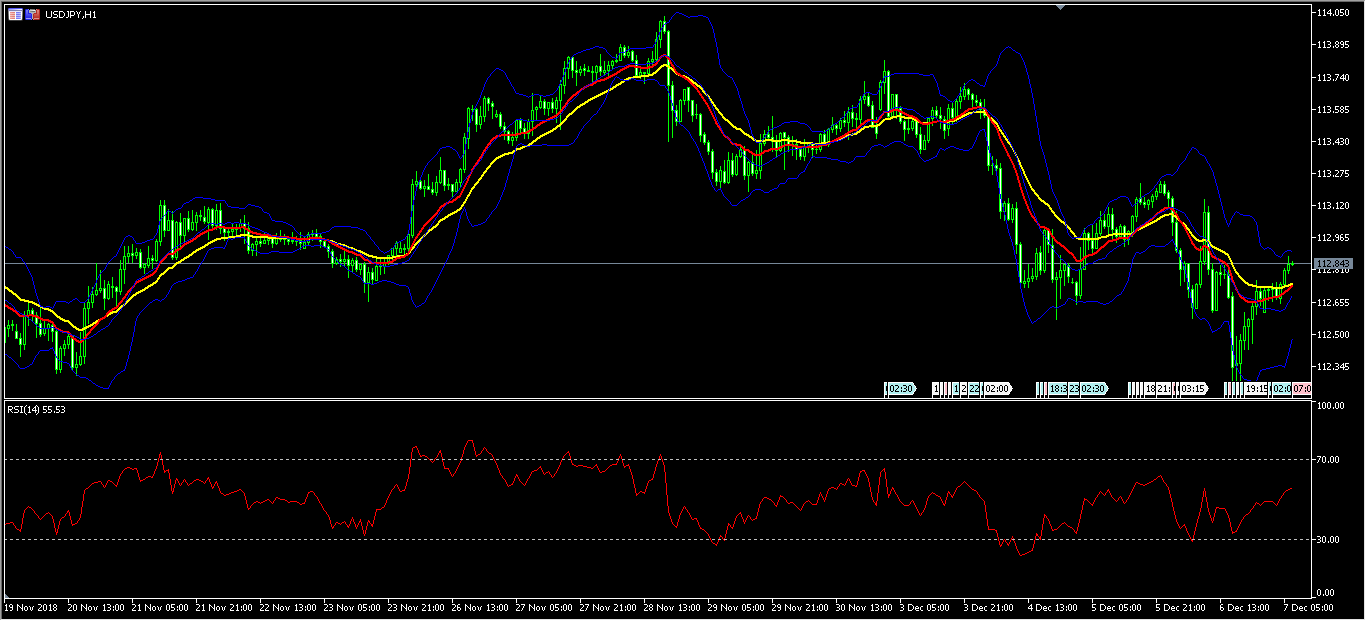
The USD/JPY pair continued the upward momentum started yesterday. It reached an intraday high of 112.88. The 15-day EMA is currently passing the 25-day EMA in a bullish move while the RSI is moving up and is now at 55 while the price is close to the upper band of the Bollinger Bands. The pair could continue moving up today until the NFP numbers are released.
XPD/USD
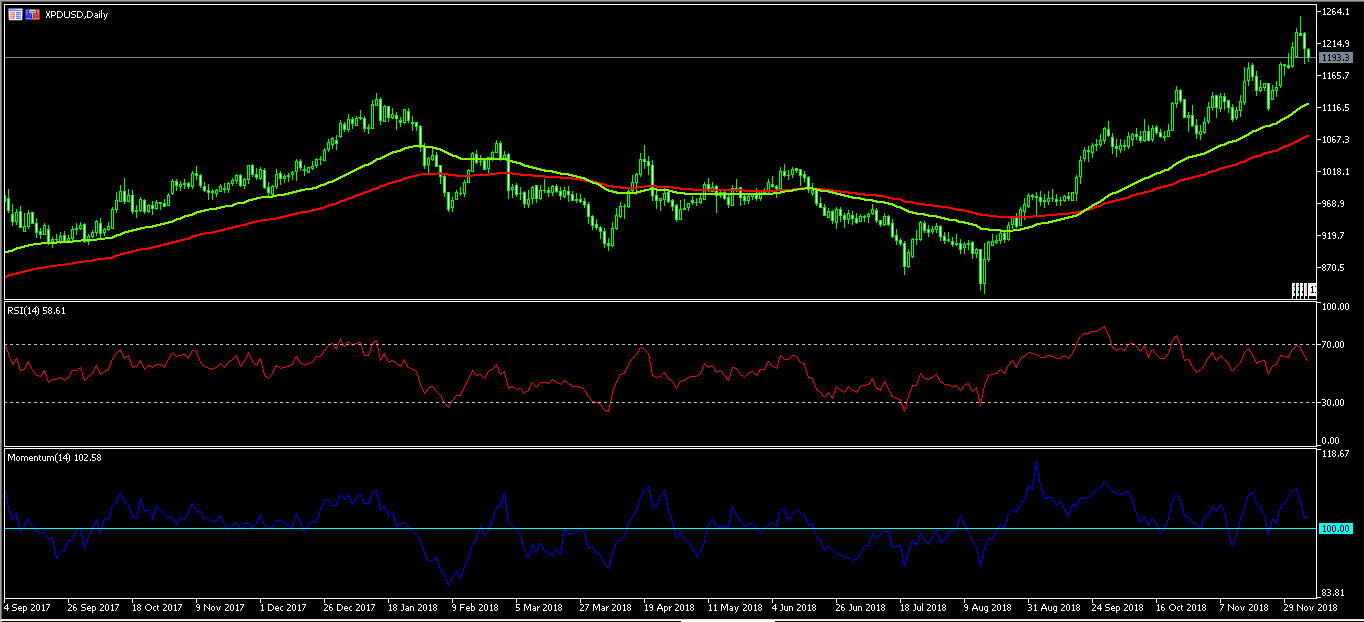
Palladium lost its luster as the most valuable precious metal. The price has dropped to $1190, while gold is currently at $1240. On the daily chart below, the XPD/USD RSI is currently below the overbought level of 70 while the pair is trading above the double EMAs. The momentum indicator is moving down too and is now close to the neutral level. The pair could see some downward pressure as traders take profit.
XAUUSD Intraday Analysis
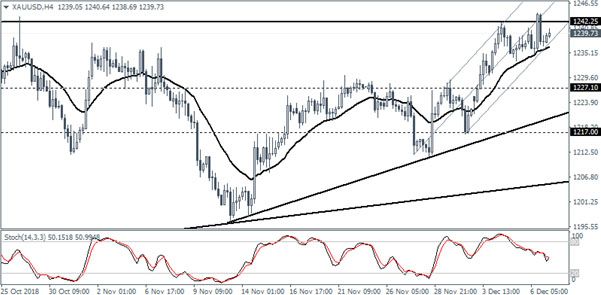
XAUUSD (1239.73): Gold prices recovered from the interday pull back to advance gains. Price action retested the resistance level of 1242.25 once again only to reverse the gains. The current pullback could see yet another attempt to breach the resistance level. Failure to close above the resistance level could potentially confirm the downside correction to 1227.10. Alternately, a successful break of the resistance level could trigger further gains as gold is likely to target 1280.
GBPUSD Intraday Analysis
GBPUSD (1.2768): The GBPUSD currency pair continues its consolidation. However, price action managed to break past the falling trend line and is seen currently pulling back. A retest of the support at 1.2745 could establish the upside if the gains hold at the support. To the upside, this opens the way for GBPUSD to test the previously established resistance level at 1.3088 region potentially.