

Sample Category Title
GBP/USD Weekly Outlook
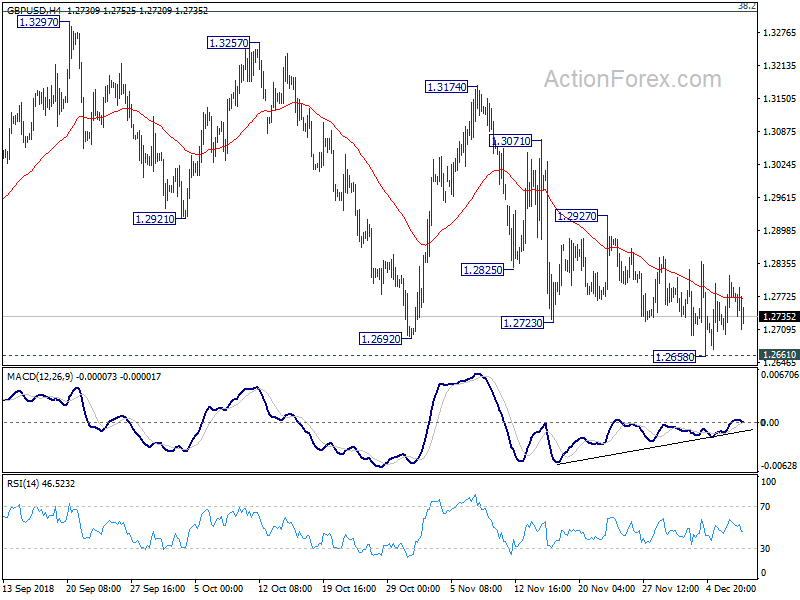
GBP/USD dipped to 1.2658 last week but failed to break through 1.2661 key support, and turned sideway. Initial bias remains neutral this week first. On the downside, sustained break of 1.2661 low will resume larger down trend from 1.4376. Next target will be 1.1946. On the upside, break of 1.2927 will extend the consolidation from 1.26661 with another rise. But even in case of strong rebound, upside should be limited by 1.3316 fibonacci level to bring down trend resumption eventually.
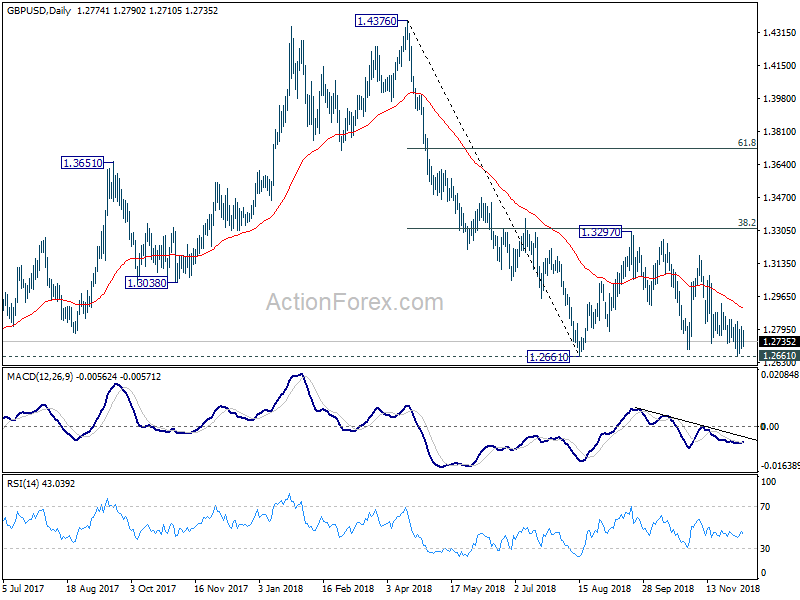
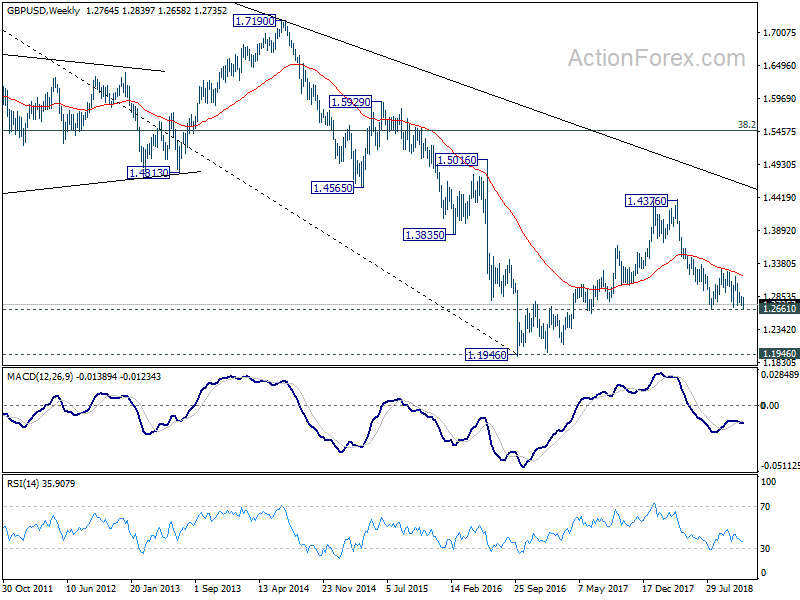
In the bigger picture, whole medium term rebound from 1.1946 (2016 low) should have completed at 1.4376 already, after rejection from 55 month EMA. The structure and momentum of the fall from 1.4376 argues that it's resuming long term down trend. And this will be the preferred case as long as 38.2% retracement of 1.4376 to 1.2661 at 1.3316 holds. However, firm break of 1.3316 would bring stronger rebound to 61.8% retracement at 1.3721. And, the eventual depth of the fall from 1.4376, and the chance of hitting 1.1946 low, will depend on the strength of the interim corrective rebound from 1.2661.
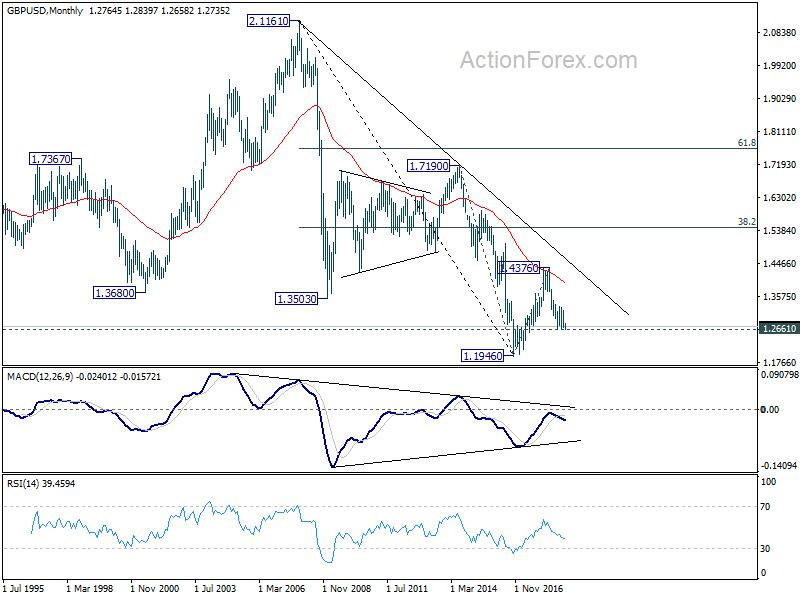
In the longer term picture, outlook in GBP/USD is held bearish. Rebound from 1.1946 was rejected solidly by falling 55 month EMA. The pair was limited well below 38.2% retracement of 2.1161 (2007 high) to 1.1946, as well as the decade long falling trend line. On break of 1.1946, next target will be 61.8% projection of 1.7190 to 1.1946 from 1.4376 at 1.1135.
USD/CHF Weekly Outlook
USD/CHF's fall from 1.0128 resumed last week by taking out 0.9908 support. Initial bias stays on the downside this week for 0.9848 support first. Break there will confirm near term reversal and target 61.8% retracement of 0.9541 to 1.0128 at 0.9765. On the upside, break of 1.0008 resistance is needed to indicate short term bottoming. Otherwise, near term outlook will now remain bearish in case of recovery.
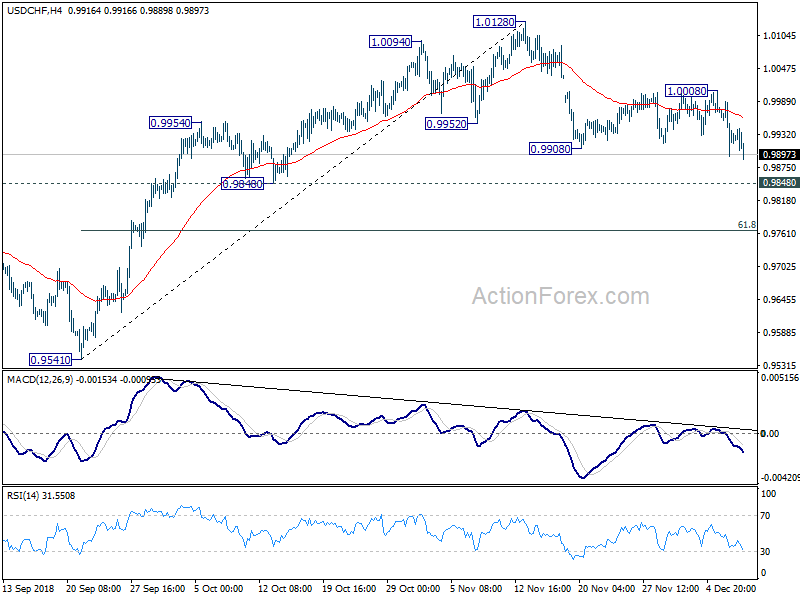
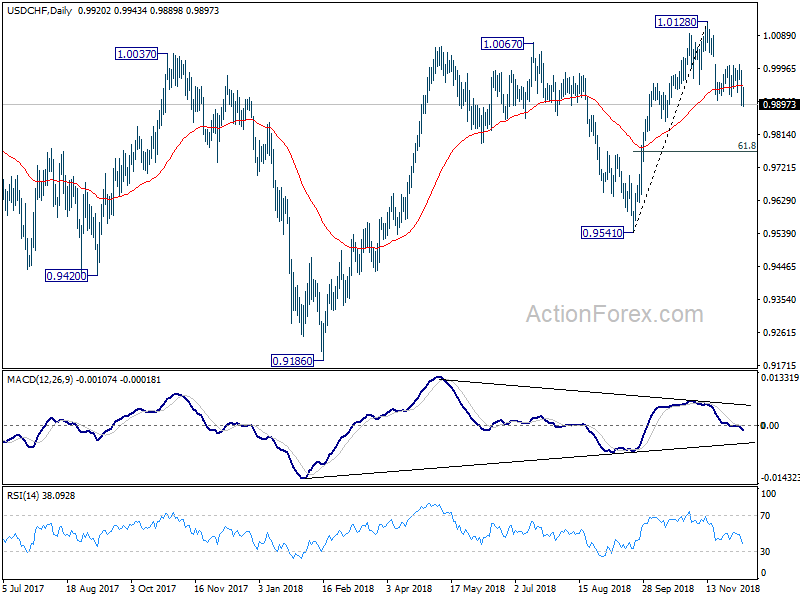
In the bigger picture, rise from 0.9541 could have topped at 1.0128. But as long as 0.9541 support holds, we'd still expect rise from 0.9186 to resume at a later stage. Break of 1.0128 will target 1.0342 key resistance. However, break of 0.9514 will pave the way back to 0.9186 low.
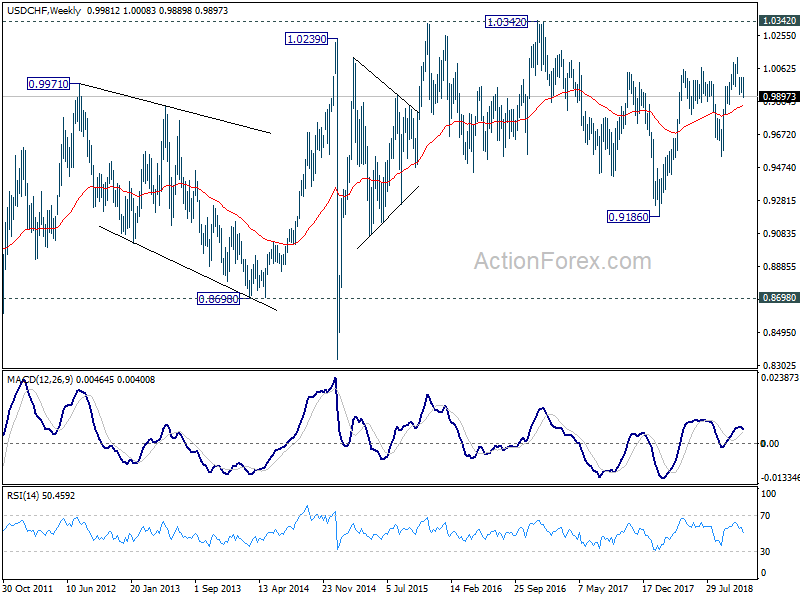
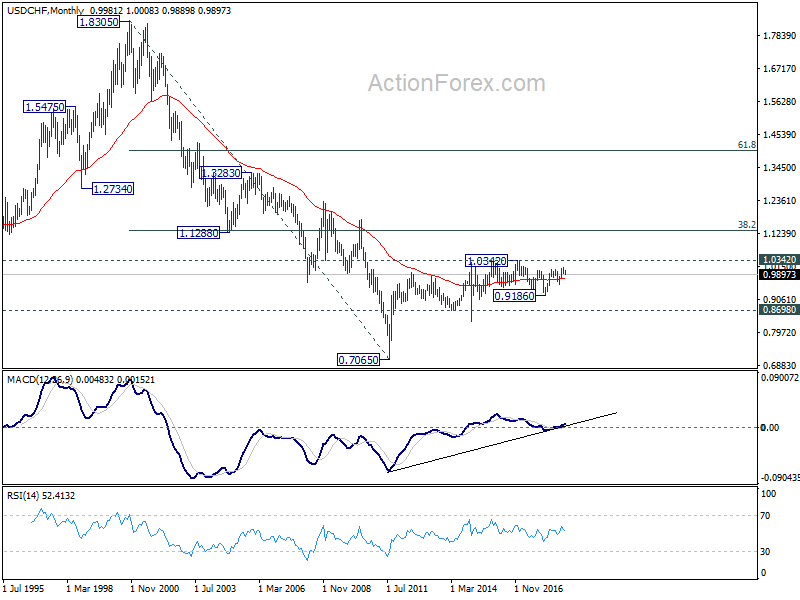
In the long term picture, price actions from 0.7065 (2011 low) are not clearly impulsive yet. Thus, we'll treat it as developing into a corrective pattern, at least, until a firm break of 1.0342 resistance.
AUD/USD Weekly Outlook
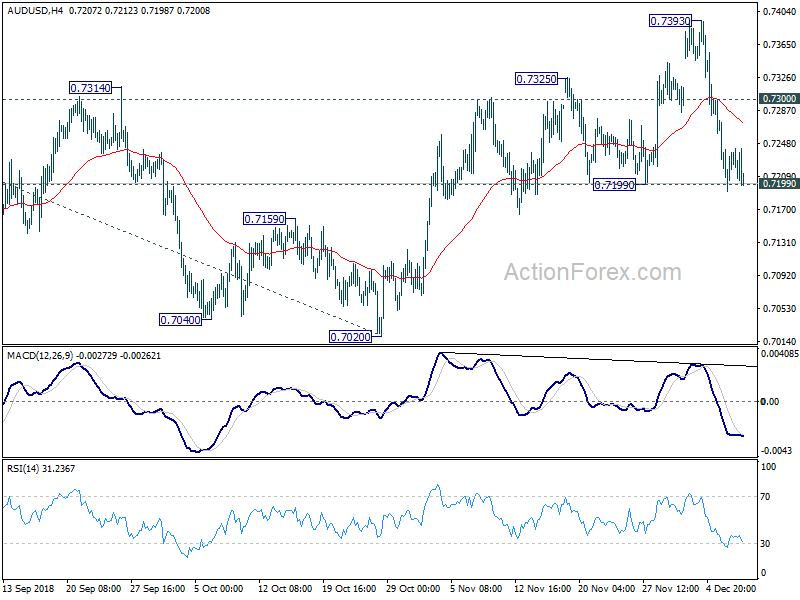
AUD/USD edged higher to 0.7393 last week but reversed from there. Initial bias stays on the downside this week with focus on 0.7199 support. Decisive break there will suggest that the corrective rebound from 0.7020 has completed earlier than expected. Deeper fall should then be seen back to retest 0.7020 low. On the upside, above 0.7300 minor resistance will turn bias back to the upside. In that case, corrective rise from 0.7020 would extend to 38.2% retracement of 0.8135 to 0.7020 at 0.7446 before completion.
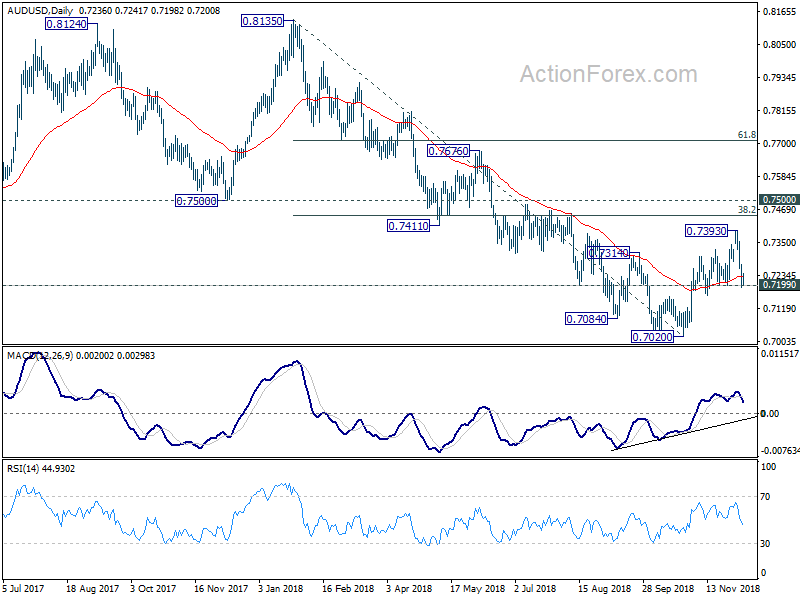
In the bigger picture, a medium term bottom is in place at 0.7020 ahead of 0.6826 key support (2016 low). Stronger rebound might be seen to correct the whole fall from 0.8135 high. But we'd expect strong resistance from 0.7500 support turned resistance to limit upside. Medium term fall from 0.8135 should resume and extend to take on 0.6826 low at a later stage, after the correction from 0.7020 completes.
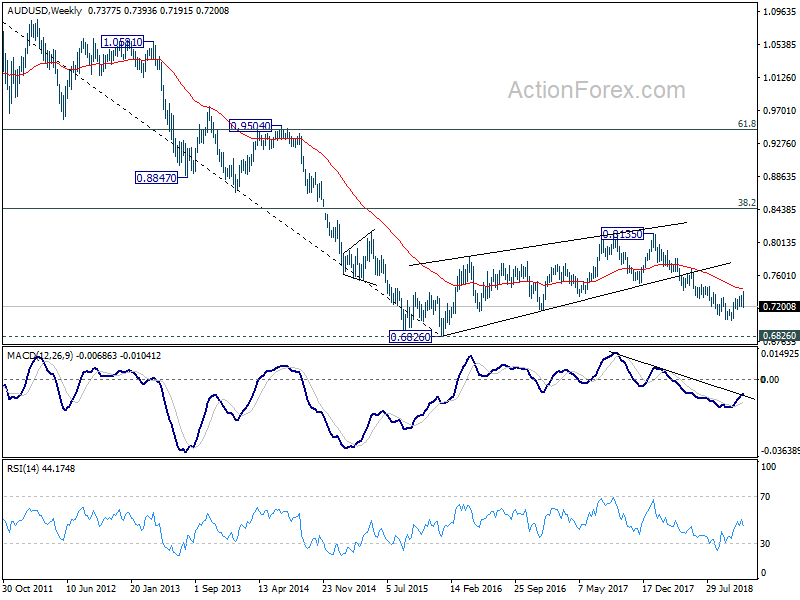
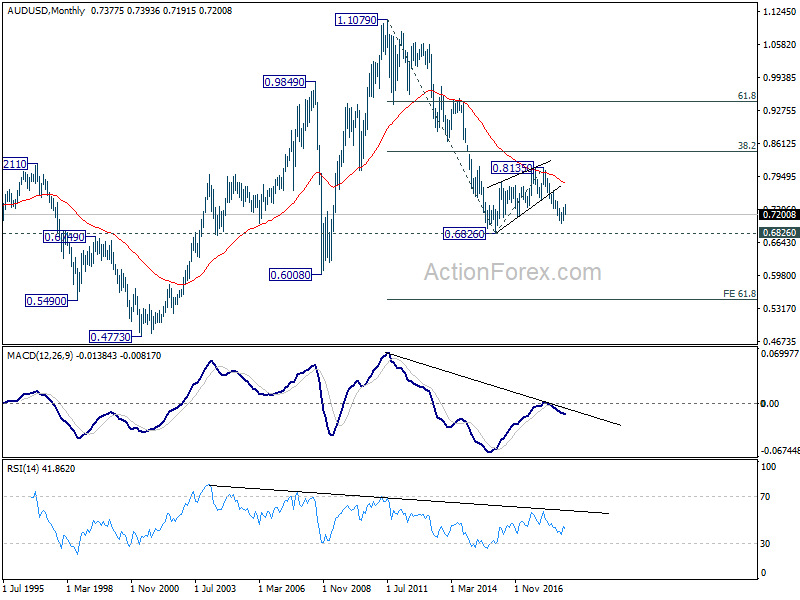
In the longer term picture, the corrective structure of rebound from 0.6826 (2016 low) to 0.8135, and the failure to break 38.2% retracement of 1.1079 (2011 high) to 0.6826 at 0.8451, carry bearish implications. AUD/USD was also rejected by 55 month EMA. Now, the down trend from 1.1079 is in favor to extend. On break of 0.6826, next target will be 61.8% projection of 1.1079 to 0.6826 from 0.8135 at 0.5507.
USD/CAD Weekly Outlook
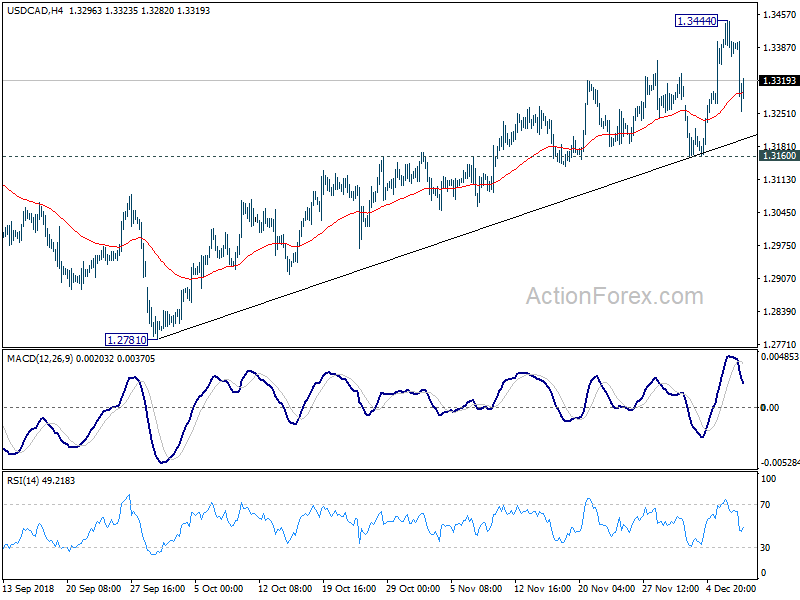
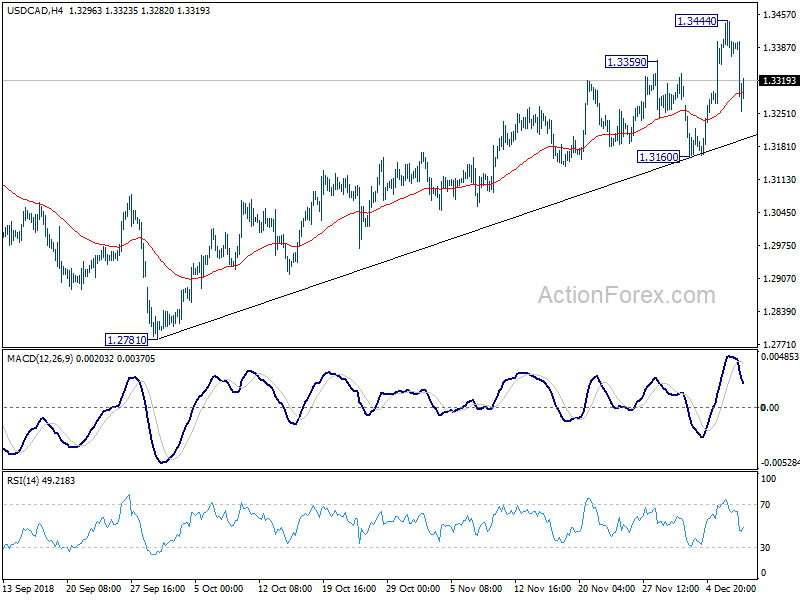
USD/CAD rose to 1.3444 last week but failed to sustain above 1.3385 resistance and retreated sharply. Initial bias is neutral this week first. Near term outlook will remain cautiously bullish as long as 1.3160 support holds. On the upside, break of 1.3444 will turn bias back to the upside. Larger rally from 1.2061 should target 1.3685 fibonacci level next.
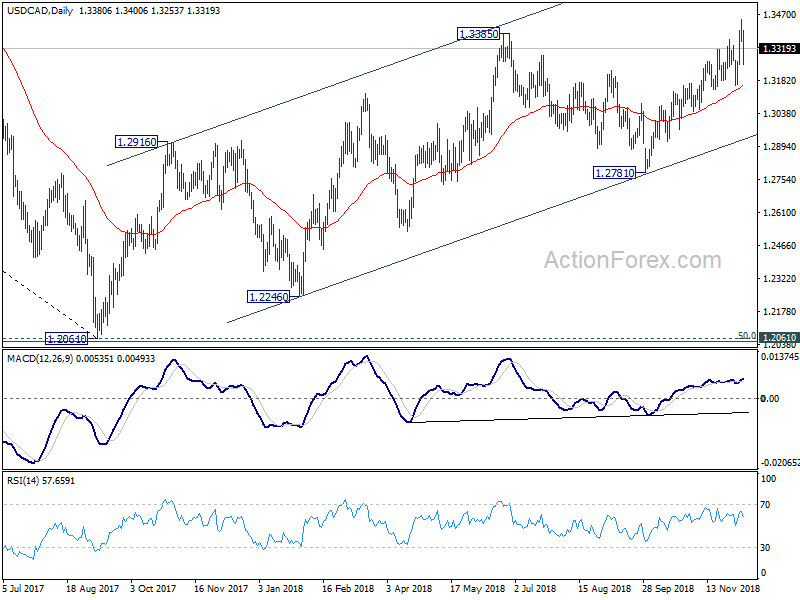
In the bigger picture, up trend from 1.2061 (2017 low) is still in progress and should target to 61.8% retracement of 1.4689 (2016 high) to 1.2061 at 1.3685. This will remain the preferred case as long as channel support (now at 1.2937) holds.
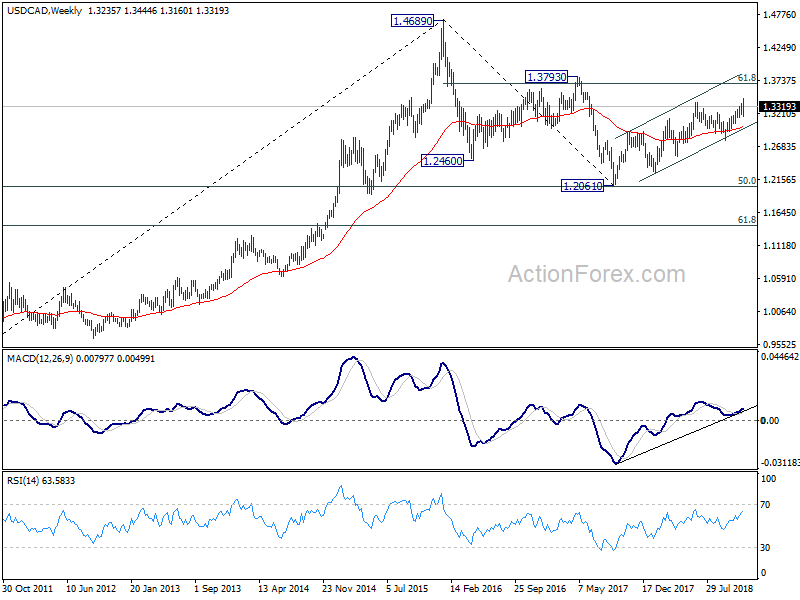
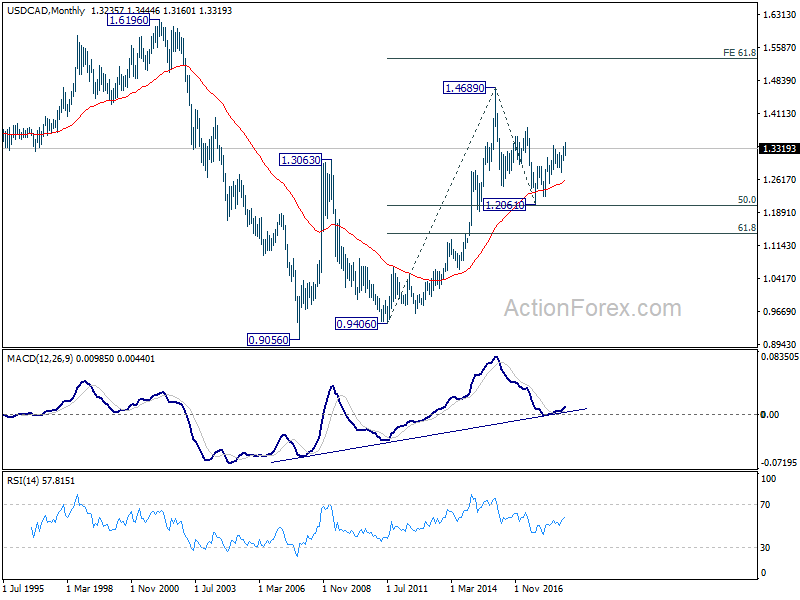
In the longer term picture, corrective fall from 1.4689 (2015 high) should have completed with three waves down to 1.2061, just ahead of 50% retracement of 0.9406 (2011 low) to 1.4689 (2015 high) at 1.2048. The development keeps long term up trend from 0.9406 and that from 0.9056 (2007 low) intact. For now, there is prospect of extending the long term up trend to 61.8% projection of 0.9406 to 1.4689 from 1.2061 at 1.5326 in medium to long term.
GBP/JPY Weekly Outlook
GBP/JPY dropped to 142.83 last week but formed a temporary low ahead of 142.76. Initial bias is neutral this week first. Some consolidation could be seen. But near term outlook remains cautiously bearish as long as 145.83 resistance holds. On the downside, firm break of 142.76 will pave the way to 139.29/47 key support zone.
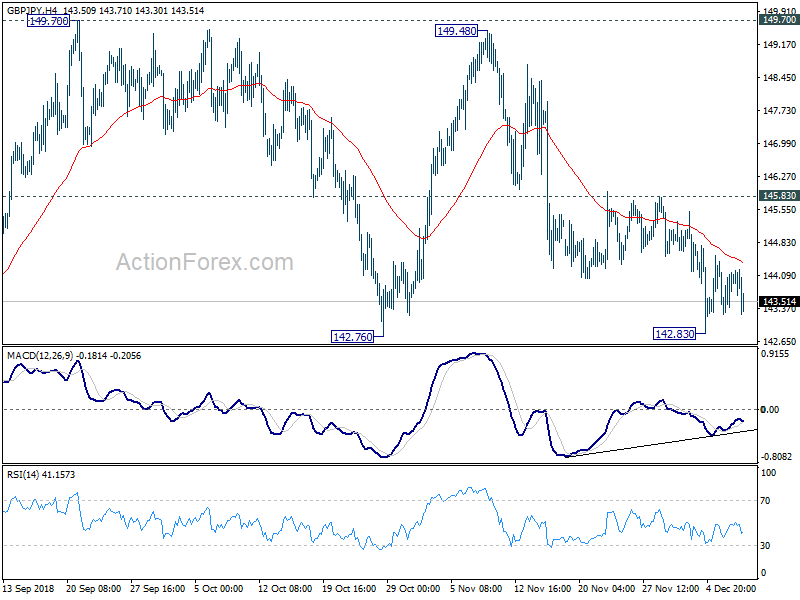
In the bigger picture, as long as 139.29 cluster support (50% retracement of 122.36 to 156.59 at 139.47) holds, up trend from 122.36 (2016 low) could still extend beyond 156.69 high. However, decisive break of 139.29/47 will suggest that such up trend is completed and turn outlook bearish. In that case, next target is 61.8% retracement at 135.43.
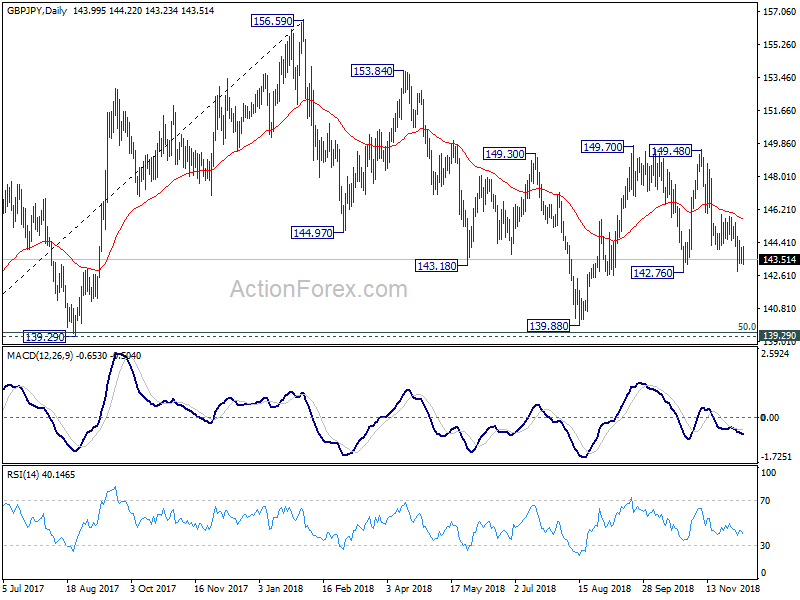
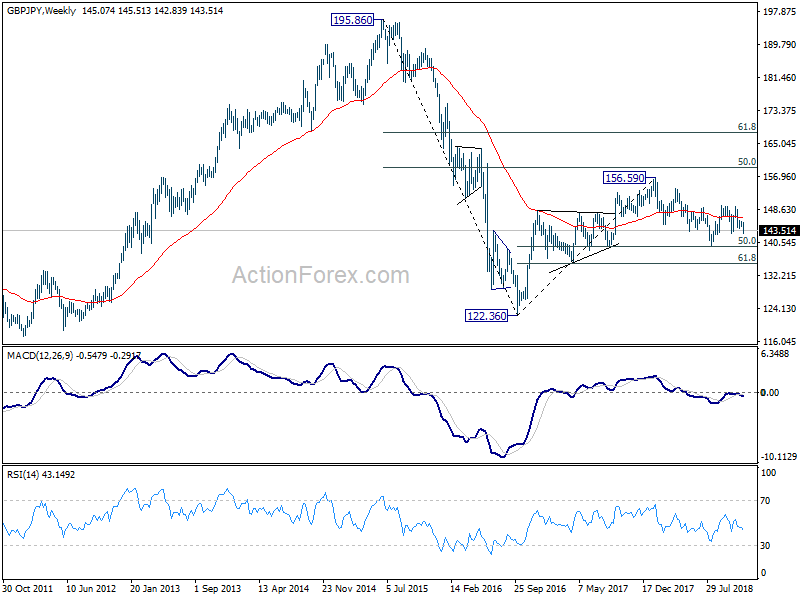
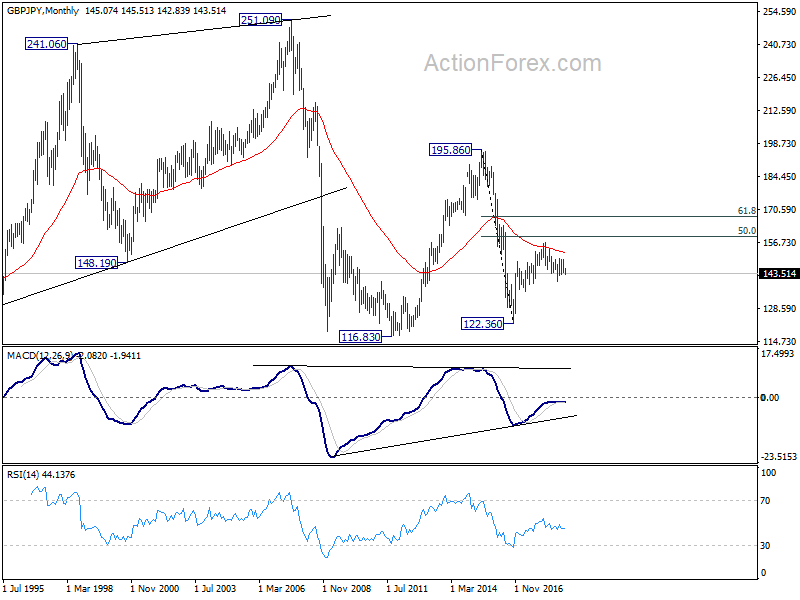
In the longer term picture, as long as 139.29 holds, rise from 122.36 is in favor to extend to 50% retracement of 195.86 (2015 high) to 122.36 (2016 low) at 159.11, and possibly further to 61.8% retracement at 167.78 before completion. However, firm break of 139.29 will turn focus back to 116.83/122.36 support zone instead (116.83 as 2011 low).
EUR/JPY Weekly Outlook
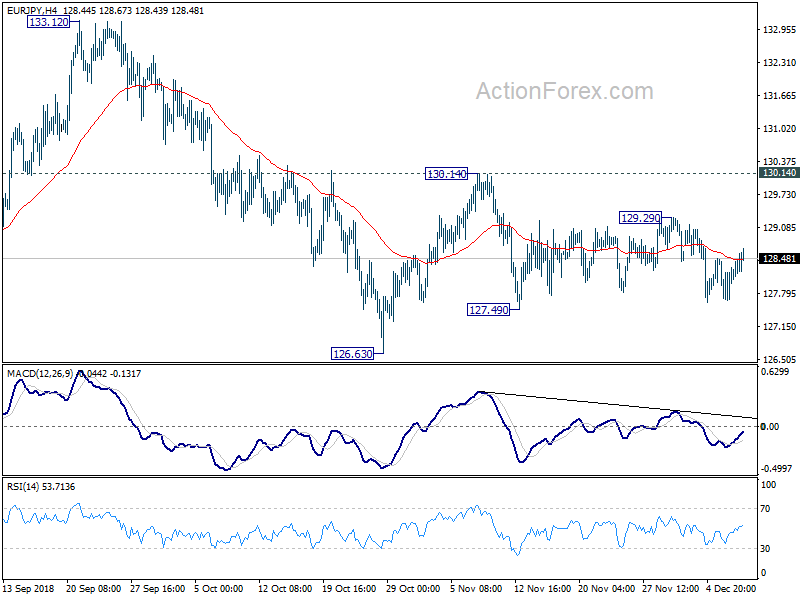
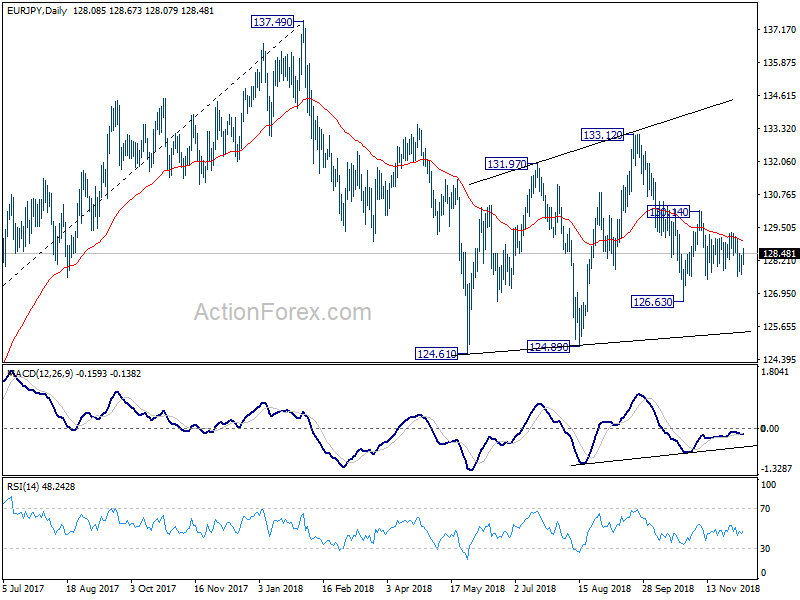
EUR/JPY stayed in range of 127.49/129.29 last week and outlook is unchanged. Initial bias remains neutral this week first. On the downside, break of 127.49 will target 126.63 support first. Break there will then resume the whole decline from 133.12 to 124.08/89 support zone. And, even in case of recovery, outlook will stay bearish as long as 130.14 resistance holds.
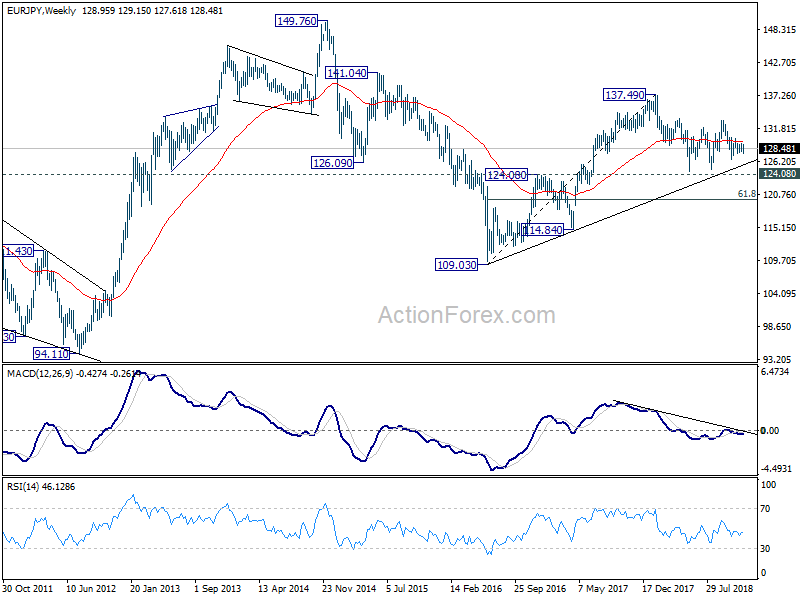
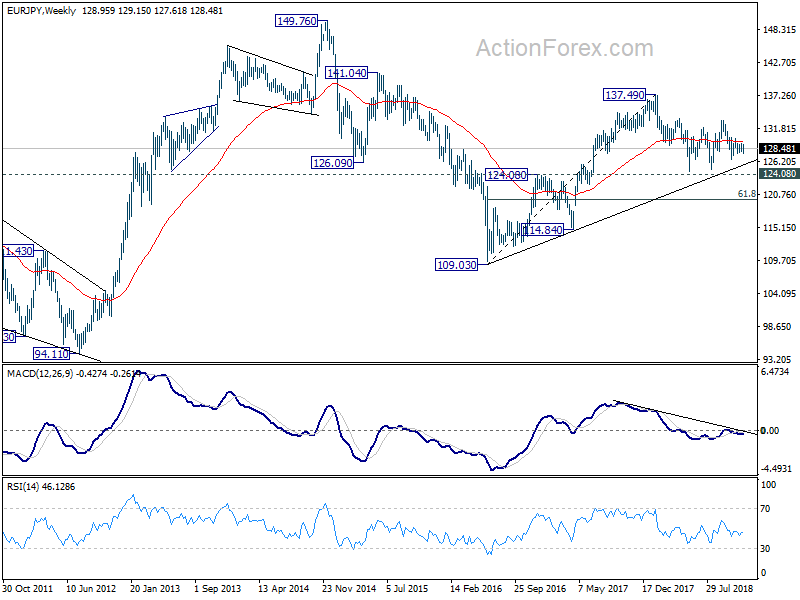
In the bigger picture, as long as 124.08 key resistance turn supported holds, larger up trend from 109.03 (2016 low) could still resume. Firm break of 137.49 structural resistance will target 141.04/149.76 resistance zone next. However, decisive break of 124.08 will argue that such rise from 109.03 has completed and turn outlook bearish. In that case, deeper fall would be seen to 61.8% retracement of 109.03 to 137.49 at 119.90.
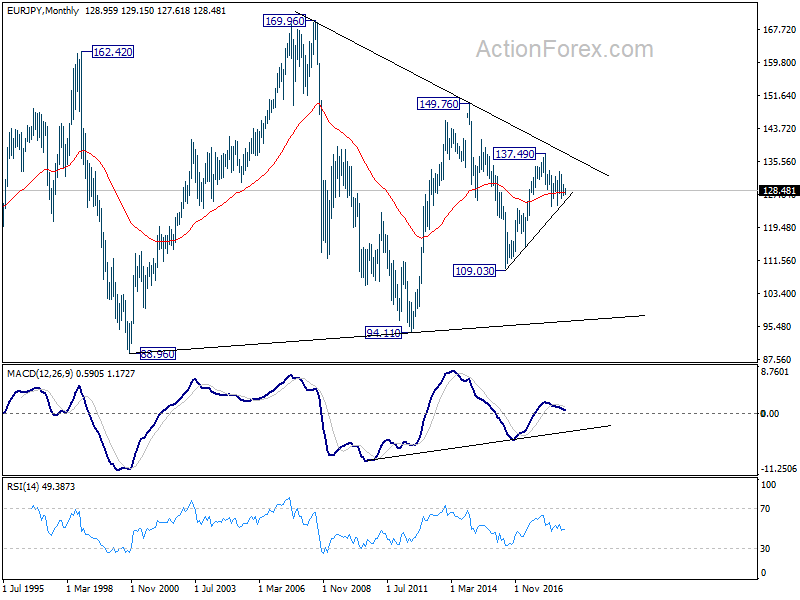
In the long term picture, at this point, EUR/JPY is staying in long term sideway pattern, established since 2000. Rise from 109.03 is seen as a leg inside the pattern. As long as 124.08 support holds, further rally is in favor in medium to long term through 149.76 high. However, break of 124.08 could extend the fall through 109.03 low instead.
EUR/GBP Weekly Outlook
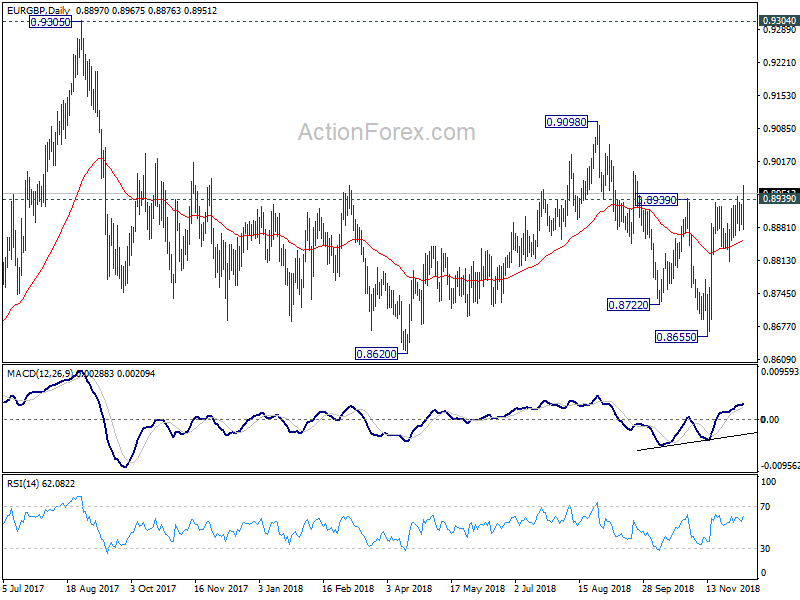
EUR/GBP's late break of 0.8939 resistance suggests that fall from 0.9098 has completed at 0.8655 already. Initial bias is now on the upside this week for 0.9098 first. Sustained break will target 0.9304 key resistance next. On the downside, break of 0.8876 minor support will mix up near term outlook and turn intraday bias neutral first.
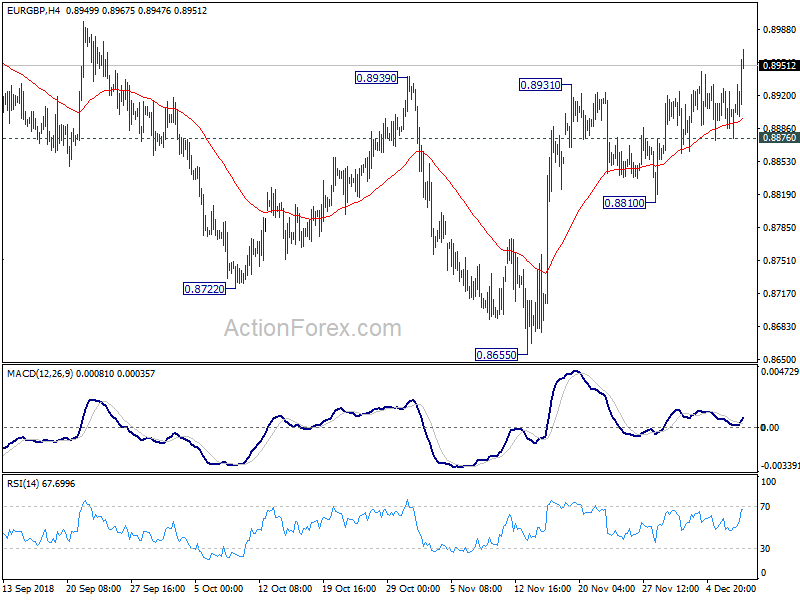
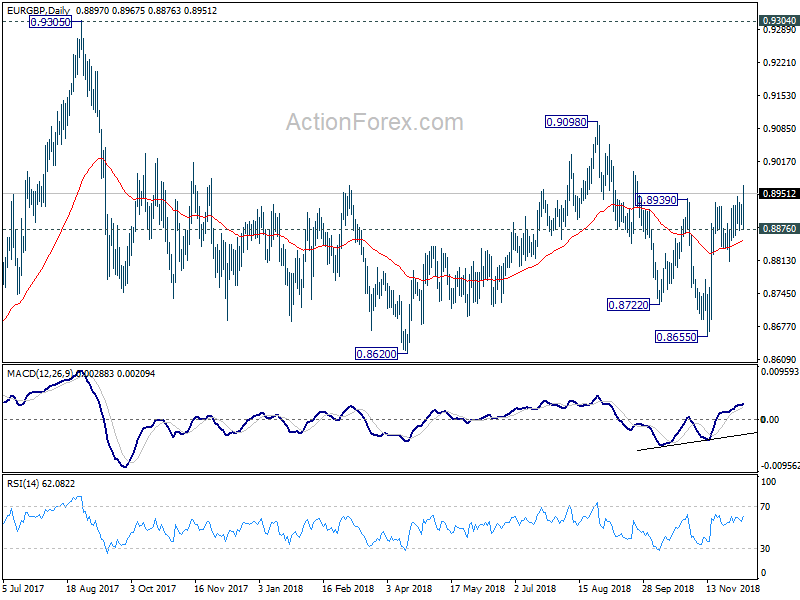
In the bigger picture, EUR/GBP is seen as staying in long term range pattern started at 0.9304 (2016 high). Sustained break of 0.8939 resistance will confirm that it's in a medium term rising leg for 0.9098 and above. And for now, in case of another fall, downside will likely be contained by 0.8620/55 support zone to bring rebound.
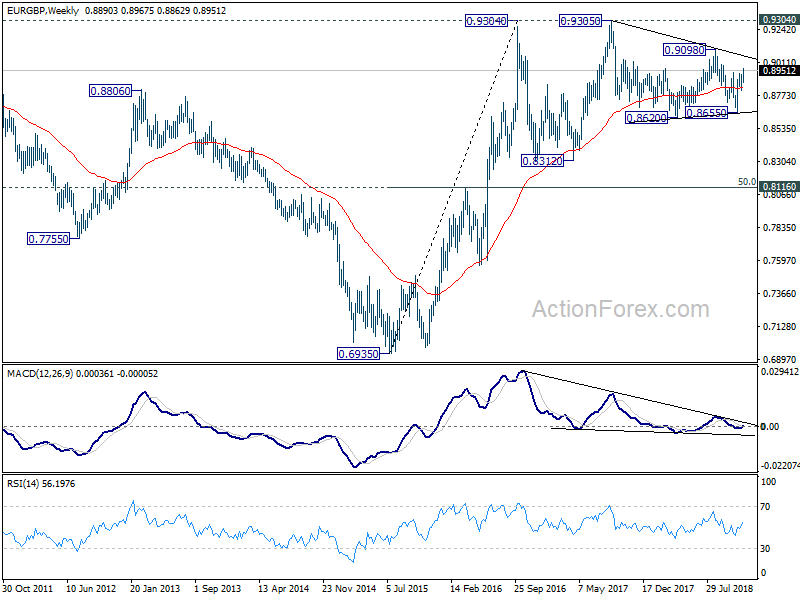
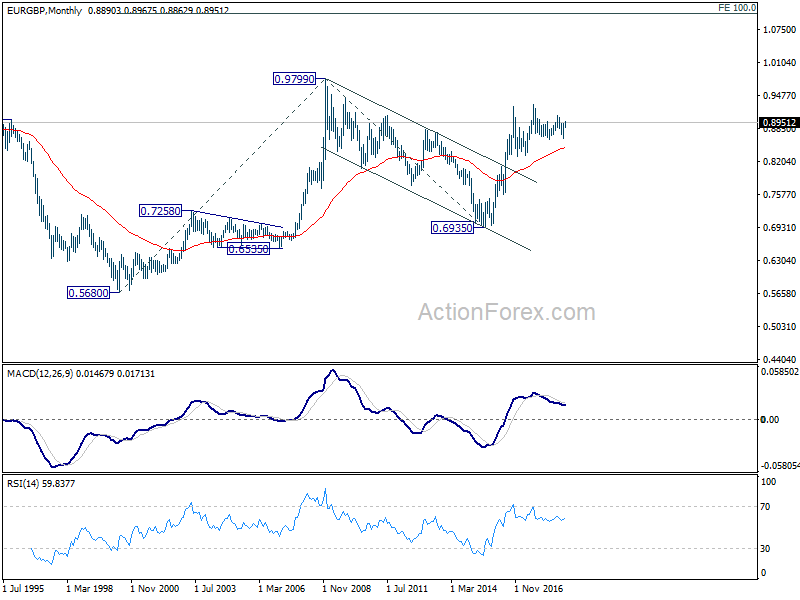
In the long term picture, we're holding on to the view that rise from 0.6935 (2015 low) is resuming the up trend from 0.5680 (2000 low). Hence, after the consolidation from 0.9304 completes, we'd expect another medium term up trend through 0.9799 to 100% projection of 0.5680 to 0.9799 from 0.6935 at 1.1054.
EUR/AUD Weekly Outlook
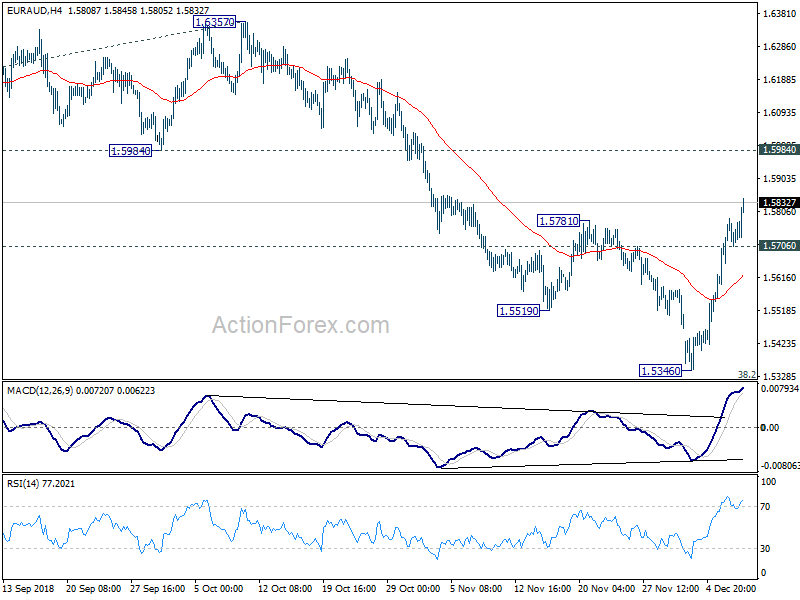
EUR/AUD rebounded strongly to as high as 1.5845 last week. The break of 1.5781 resistance argues that decline from 1.6357 has completed much earlier than expected. Initial bias is turned back to the upside for 1.5984 support turned resistance first. Break will bring retest of 1.6357 high. On the downside, break of 1.5706 minor support will turn intraday bias neutral and bring consolidation first, before staging another rally.
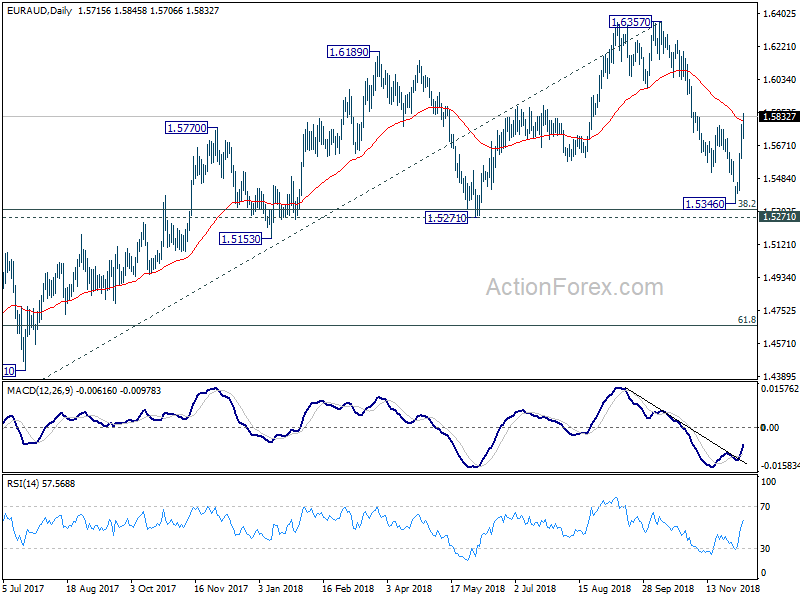
In the bigger picture, no change in the view that 1.6357 is a medium term top. But the strong rebound ahead of 1.5271 cluster support (38.2% retracement of 1.3624 to 1.6357 at 1.5313) suggests price actions from 1.6357 are developing into sideway consolidation, rather than a deep correction. The range of 1.5271/6357 is likely set for the consolidation. And we don't expect a break of the range any time soon. But decisive break of 1.6357 will resume the larger up trend from 1.3624 (2017 low) to 1.6587 (2015 high).
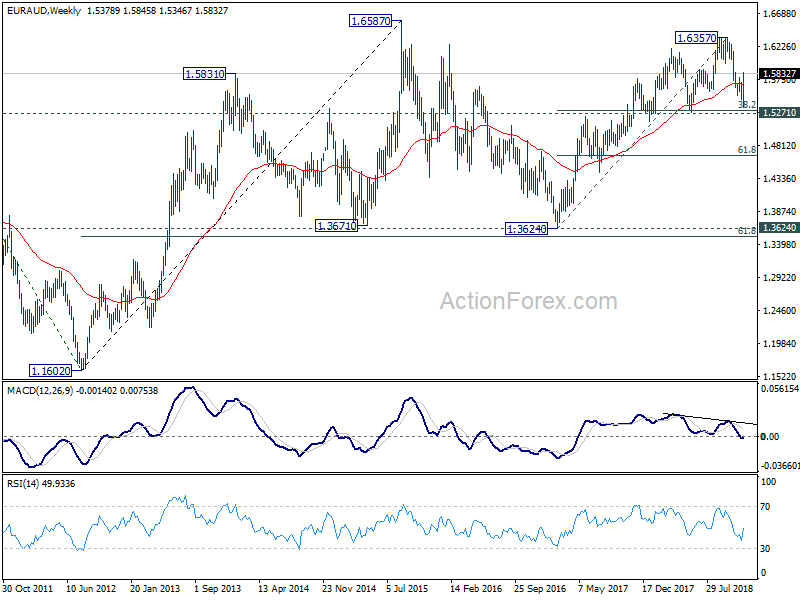
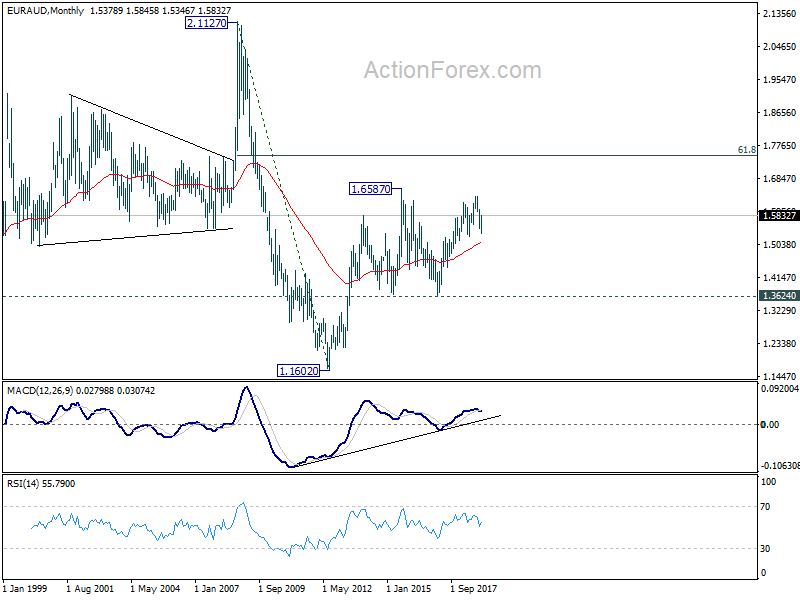
In the longer term picture, the rise from 1.1602 long term bottom (2012 low) isn't over yet. We'll keep monitoring the development but there is prospect of extending the rise to 61.8% retracement of 2.1127 to 1.1602 at 1.7488 and above. However, sustained trading below 1.3624 key support should indicate long term reversal and target 1.1602 long term bottom again.
EUR/CHF Weekly Outlook
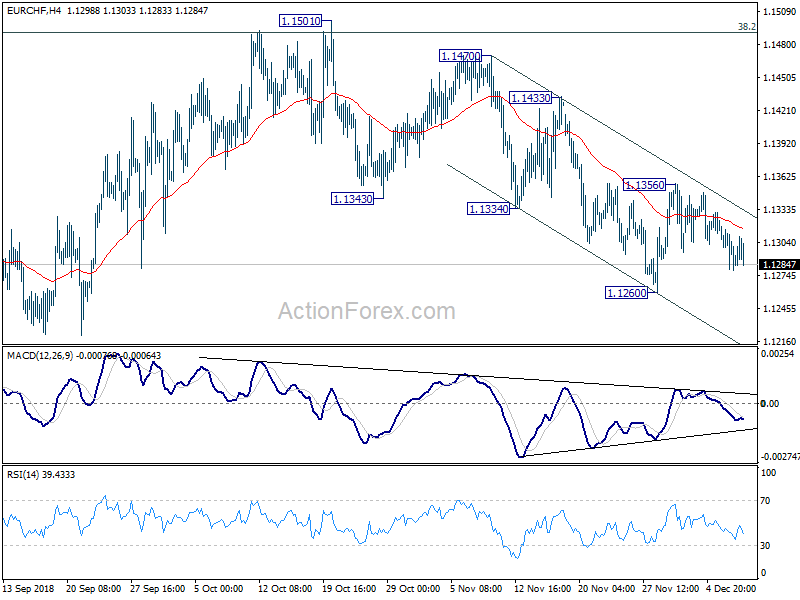
EUR/CHF's decline last week suggests that recovery from 1.1260 has completed 1.1356 already. Initial bias remains on the downside this week for 1.1260 support first. Break will resume the whole decline from 1.1501 and target 1.1173 low. On the upside, break of 1.1356 resistance is needed to indicate short term bottoming. Otherwise, near term outlook will be mildly bearish even in case of recovery.
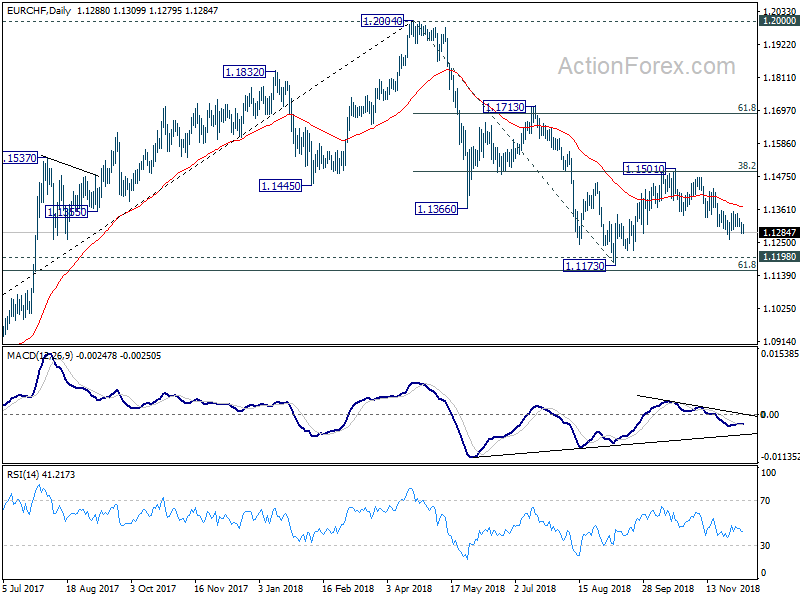
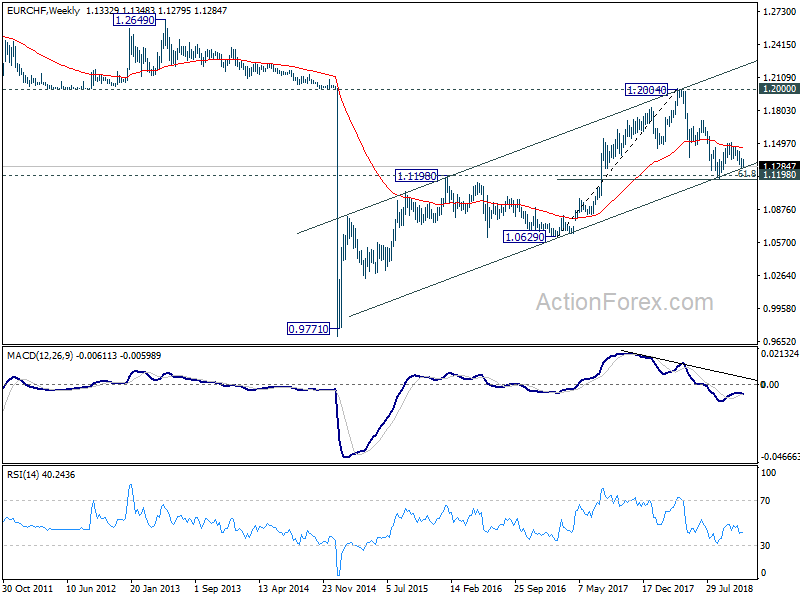
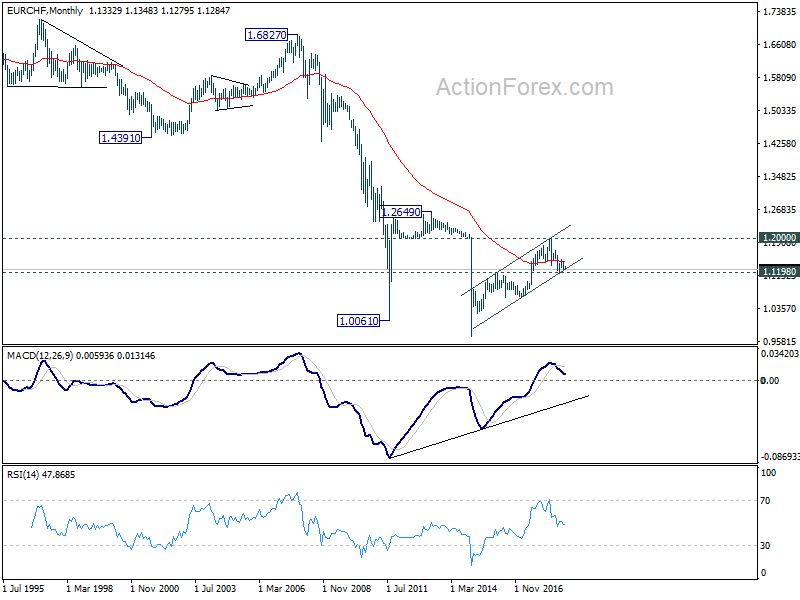
In the bigger picture, price actions from 1.2004 medium term top is seen as a correction only. Downside should be contained by support zone of 1.1198 (2016 high) and 61.8% retracement of 1.0629 to 1.2004 at 1.1154 to complete it and bring rebound. A break of 1.2 key resistance is still expected in the medium term long term. However, sustained break of the mentioned support zone will mark reversal of the long term trend. In that case, 1.0629 key support will be back into focus.
Yield Curve Inversion and Global Slowdown Hammered Stocks, Not US-China Trade Talks
It was another volatile week with multiple theme working on the markets. US-China trade truce, arrest of Chinese business executive, stock market routs, treasury yield free fall, US yield curve inversion, weak economic data and global slow down, OPEC+ production cut, UK Brexit parliament debate, Italy budget. All have a hand in market volatility.
Commodity currencies ended as the weakest ones. Australia lead the way with surprisingly weak Q3 GDP figure. Canadian Dollar was additionally pressured by BoC and oil, but saved by strong job data. Swiss Franc was the strongest one for the week, followed by Japanese Yen, on risk aversion. Mild weakest in emerging market currency like Turkish Lira gave the Franc a slight upper hand. Euro, Dollar and Sterling were mixed.
Many of the theme have not concluded yet. Markets will be eager to see more progress in the 90-day US-China trade talks. Brexit vote will be held on Tuesday. Italy may or may not submit its revised 2019 budget. ECB will meet on Thursday. Oil could be under pressure again after the production cut. And, yield and stocks are continuous theme.
Huawei CFO arrest would jeopardize US-China trade talk?
Worries over US-China trade war were blamed by many as the reason for the stock market selloffs. Some criticize that the meeting of Trump and Xi on December ended without concrete progress. More pointed to the arrest of Chinese tech giant Huawei's CFO in Canada, by the request of the US, as a move that would complicate or even jeopardize the trade negotiations. We do not share the same view.
Let's reiterate that a 90 days ceasefire period (from Dec 1) is now set for the negotiations. Words from Trump and White House economic advisor Larry Kudlow were affirmative. Trade Representative Robert Lighthizer, the only one in the cabinet who knows how to make a trade agreement, entered the ring to let the talks. China has agreed to buy soybeans immediately and would lower auto tariffs during the trade talks. China has also released plans for strict protection of intellectual property. And even after the arrest of the Huawei executive, no Chinese officials have linked the act with trade negotiations. The developments have been positive.
In the financial markets, China's Shanghai SSE has indeed closed the week up 0.68%. Hong Kong HSI just lost -1.67%. Remember that in the background, Japan said it will ban the purchase of equipment from both Huawei and ZTE. EU has raised alarm on Huawei's security risks. UK BT said it will bar Huawei from the core of its 5G networks, and remove it from the core of its 3G and 4G networks. These were pretty bad news for the China and Hong Kong tech sector. But stocks responses were rather limited. Staying in Asia, Singapore Strait Times closed the week down -0.21%. Nikkei, though, was heavier hit and lost -3.01%.
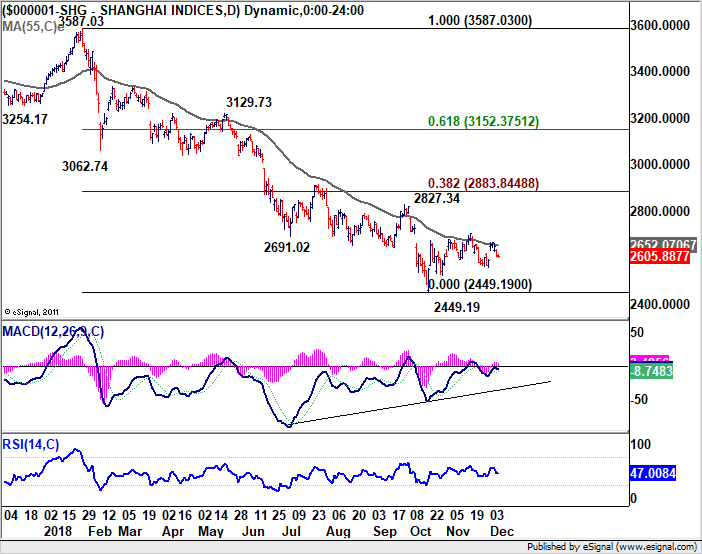
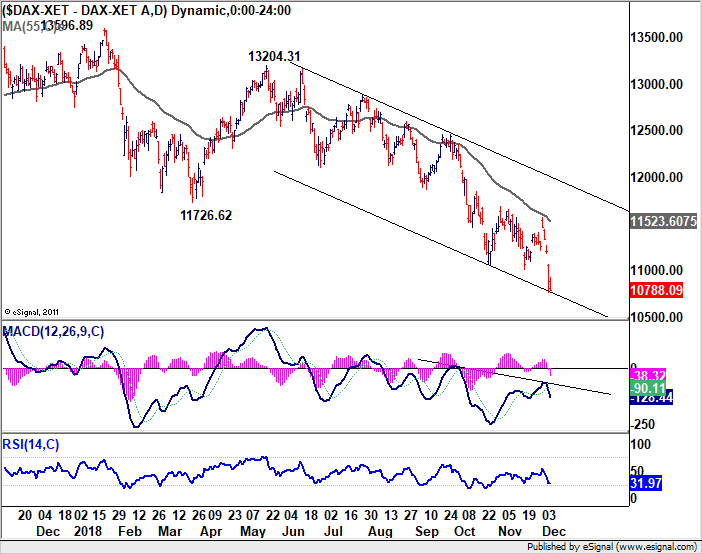
On the other hand, over the week, DOW dropped -4.50%, S&P 500 dropped -4.0%, NASDAQ dropped -4.93%. In Europe, DAX dropped -4.17%., CAC dropped -2.94% and FTSE dropped -2.75%. All three major European indices closed at new 2018 low. So, fear of escalation in US-China trade war prompted selloff in US and European stocks. But Asian stocks were immune? It doesn't make sense all.
Yield curve inversion and global slowdown
Instead, worries over slowdown in the advanced economy, slump in oil prices and yield curve inversion in the US are seen by us as the main driving force in the markets. November Eurozone PMI composite was finalized at 52.7, lowest since September 2016. In particular, Germany PMI composite hit 47-month low at 52.3. As Markit noted, "it was in Germany where the euro area's growth slowdown was centred". The disappointing US non-farm payroll report, which showed only 155k growth, also add to the argument that job market growth momentum has peaked.
Global bond yields suffered persistent decline last week. In Japan, 10 year JGB yield hit as low as 0.43, lowest since July, and compares to October's peak at 0.166. It closed at 0.063. German 10 year bund yield hit as low as 0.227 before closing at 0.251. That's the lowest since May's one-day spike low at 0.186. And it compares to October's high at 0.585.
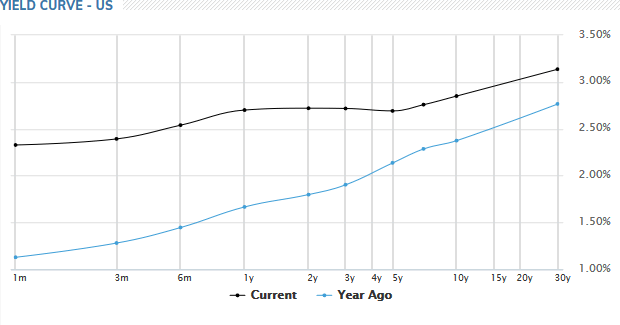
In US bond markets, 3-year yield dropped -0.087 to 2.718. Five year yield dropped -0.149 to 2.696. This is the part of the yield curve that flattened most over the year and is now inverted. Decline in yield was more serious at the long end too. 10 year yield closed down 0.163 to 2.850. 30 year yield closed down -0.168 at 3.143.
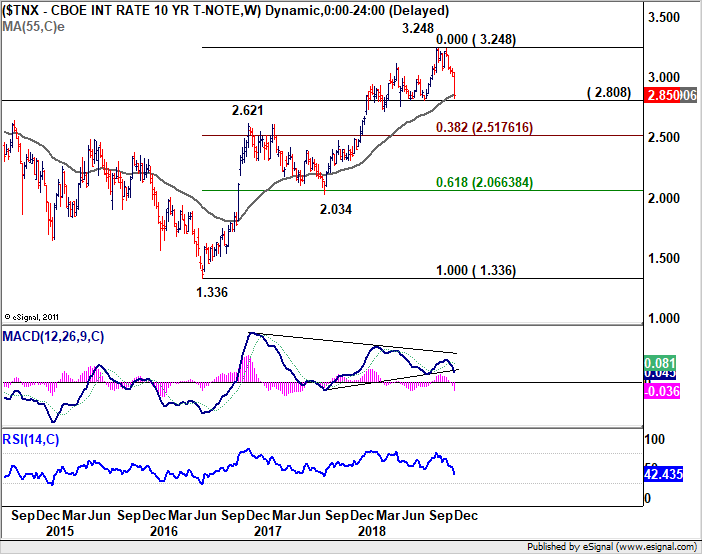
10-year yield is now pressing key support level between 2.808 and 55 week EMA. For now, we'd still favor this support to hold and bring rebound. However, firm break there will indicate medium term reversal and deeper fall would be seen to 2.034/621 support zone.
To conclude this part, we believe that the sentiments of investors are already bearish on the economic fundamentals. Even if Huawei's CFO is suddenly released and stocks rebound, that wouldn't be long lasting. As barring any strong upside surprise after 90 days of negotiations, we don't expect the results to prompt a turnaround in sentiments neither. Damages of Trump's global tariffs were already done.
OPEC+ production cut not enough to turnaround oil and CAD
Canadian Dollar was a big mover last week, on oil prices, BoC outlook and economic fundamentals. WTI crude oil stabilized above 50 last week but upside attempts were limited below 55. After much anticipation, OPEC finally agreed to cut output by 800k bpd from January. Non-OPEC allies also agreed to 400k bpd cut, making a total of 1.2M bpd production cut.
The news is certainly insufficient to have a turn around in oil prices. There is prospect of some more recovery in WTI but we don't expect a break of 58.04 resistance. The fall from 77.06 should extend below 61.8% retracement of 27.69 (2016 low) to 77.06 at 46.54 before finding enough support for bottoming.
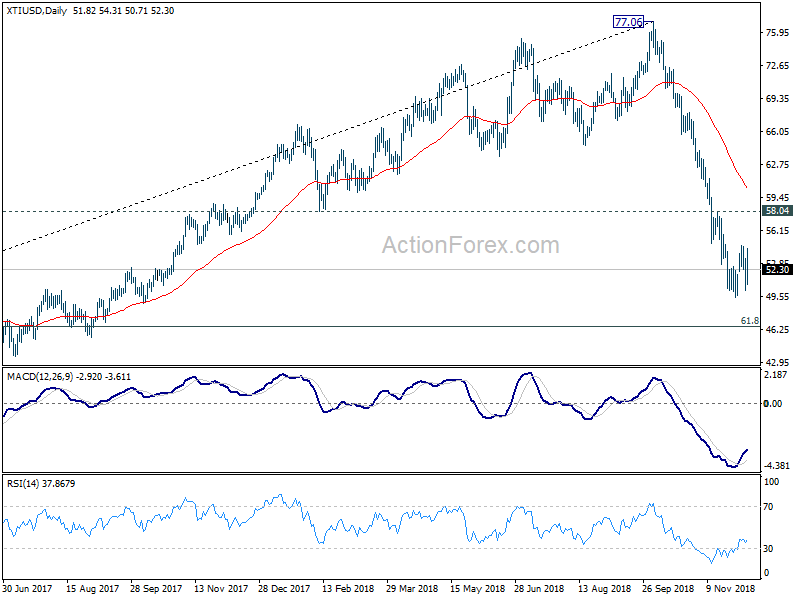
Back to Canadian Dollar, it's sold off sharply after BoC sounded worrisome on oil prices slump. BoC has made it very clear that "activity in Canada's energy sector will likely be materially weaker than expected." And, "the persistence of the oil price shock, the evolution of business investment" will be taken into account in consideration of the pace of rate hikes to neutral.
BoC Governor Stephen Poloz also admitted that "data released since our October Monetary Policy Report have been on the disappointing side ". And, "the economy has less momentum going into the fourth quarter than we believed it would." However, the Loonie was then saved by stellar job data which showed 94.1k growth in November. Unemployment rate dropped to 5.6% lowest since 1976.
After all, Canadian Dollar ended the week as the third weakest, just next to Aussie and Kiwi. And USD/CAD's pull back was held well above 1.3160 support so far. The Loonie remains vulnerable to further selloff, should WTI crude oil dips below 50.
EUR/GBP to face Brexit vote and ECB meeting
EUR/GBP will be an interesting pair to watch in the upcoming week. On the one hand, there is the highly anticipated Brexit vote in the UK parliament. Prime Minister Theresa May will need 320 votes backing her Brexit plan. But according to a Guardian estimate, May would lose by as many as 200 votes. There is still a chance for May to go back to Brussels to work one something to tweak the deal, if she just lose by a small margin, say below 50. And the situation will be totally different if she really lose by a wide margin.
But a tricky situation is that the European Court of Justice's advocate general said last week that UK has the right to withdraw Brexit notice unilaterally, up to the point of formal conclusion of the deal. ECJ will deliver it ruling on Monday, a day before the UK parliamentary vote. And ECJ followed the advocate's opinion as widely expected, that will open up a new possibility for Brexit. That is, May's defeat could then mean no-deal Brexit, or no Brexit at all. Such uncertainty was what kept the Pound rather quiet last week.
ECB meeting will be another focus. No change in its immediate plan is expected. That is, interest rates will be kept unchanged and ECB will stop asset purchase program after December. The main question is how ECB is viewing the current slow down in Eurozone growth. Would they maintain that Q3's slow down was just temporary? Or would they change the tune. A dovish shift doesn't necessarily change the forward guidance of keep interest rates at present levels at least "through the summer of 2019". ECB has enough flexibility in the guidance. But more cautiousness would likely mean more pressure on Euro.
EUR/GBP's break of 0.8939 resistance on Friday should send the cross to 0.9098 resistance, from a pure technical view. But the above two events are enough to change the picture completely.
Position trading
We entered EUR/JPY short on breach of 127.80 last week as updated here. Fall from 130.14 didn't resume as we anticipated. Instead, EUR/JPY recovered ahead of 127.49 support. But so far, there is no change in our view that price actions from 127.49 are corrective in nature. It's just a matter of time when the cross break through 127.49 to 126.63. Hence, we'll hold short in EUR/JPY, with stop staying at 129.30, slightly above 129.29 resistance.
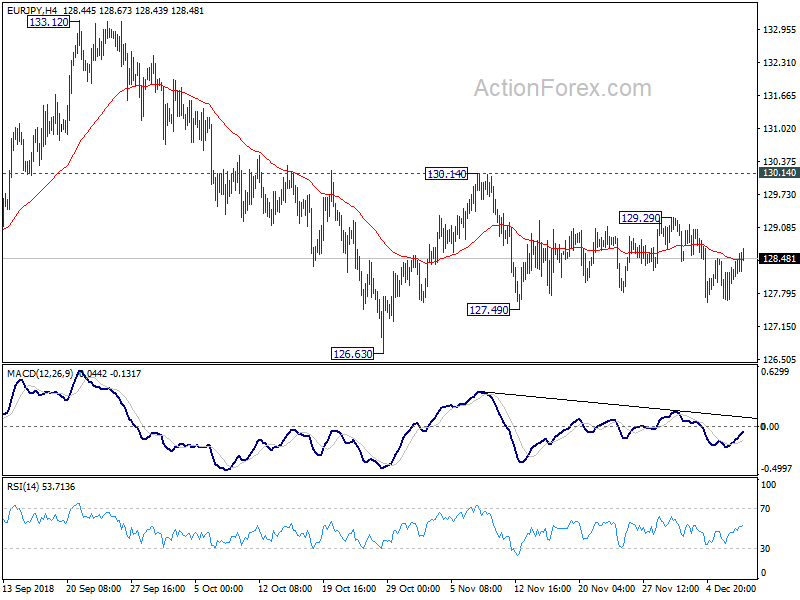
It's a bit early to be medium term bearish. But EUR/JPY is staying below 55 day EMA and 55 week EMA which indicates underlying weakness. We're envisaging the fall from 137.49 to resume eventually and extend to 61.8% retracement of 109.03 to 137.49 at 119.90. But we'll also watch the reactions from 124.08 closely.
EUR/AUD Weekly Outlook
EUR/AUD rebounded strongly to as high as 1.5845 last week. The break of 1.5781 resistance argues that decline from 1.6357 has completed much earlier than expected. Initial bias is turned back to the upside for 1.5984 support turned resistance first. Break will bring retest of 1.6357 high. On the downside, break of 1.5706 minor support will turn intraday bias neutral and bring consolidation first, before staging another rally.
In the bigger picture, no change in the view that 1.6357 is a medium term top. But the strong rebound ahead of 1.5271 cluster support (38.2% retracement of 1.3624 to 1.6357 at 1.5313) suggests price actions from 1.6357 are developing into sideway consolidation, rather than a deep correction. The range of 1.5271/6357 is likely set for the consolidation. And we don't expect a break of the range any time soon. But decisive break of 1.6357 will resume the larger up trend from 1.3624 (2017 low) to 1.6587 (2015 high).
In the longer term picture, the rise from 1.1602 long term bottom (2012 low) isn't over yet. We'll keep monitoring the development but there is prospect of extending the rise to 61.8% retracement of 2.1127 to 1.1602 at 1.7488 and above. However, sustained trading below 1.3624 key support should indicate long term reversal and target 1.1602 long term bottom again.