

Sample Category Title
Dollar Mixed As Stock Market Drops Ahead Of Bush Memorial
The US dollar is mixed on Tuesday ahead of a national day of mourning in honor of former President George Bush. The US federal government will close with no trading in the equity and fixed income market. Several economic indicator releases scheduled for Wednesday will be pushed to Thursday or later. The JPY rose 0.76 percent as the trade ceasefire agreed by China and the United States is starting to unravel. The Canadian dollar is the major currency that is lower against the greenback after depreciating 0.48 percent. The Bank of Canada (BoC) will publish its December monetary policy statement on Wednesday, December 5 at 10:00 am EST. The central bank is not expected to modify its benchmark interest rate, with markets pricing in a more likely rate move in January. The US stock benchmark fell 800 points on Tuesday and a flattening of the US government debt yield curve created anxiety amongst investors.
- ECB President to speak in Frankfurt
- Bank of Canada (BoC) to hold rate at 1.75%
- ADP report, US ISM non manufacturing PMIs and EIA crude oil inventories pushed to Thursday
BoC to Hold due to Lower Oil Prices and Economy Losing Momentum
The Canadian dollar fell 0.35 percent on Tuesday. The USD/CAD is trading at 1.3243 ahead of the Bank of Canada (BoC) publishing its rate statement on Wednesday. The central bank is expected to stand pat at 1.75 percent as energy market volatility, global trade uncertainty and rising concerns with the pace of Canadian growth will keep Governor Poloz from pulling the trigger on a rate lift.
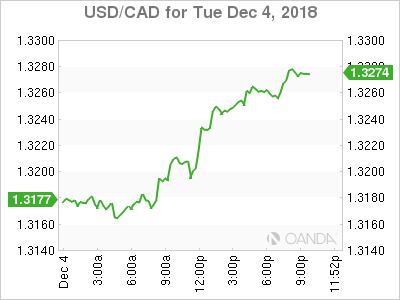
The market is pricing in a January rate hike, but as headwinds grow stronger unless there is a strong pick up in internal as well as external indicators there might not be enough runway for that to happen. Oil prices remain caught between fears of oversupply and a potential sequel to the production cut agreement between the OPEC and other major producers.
Energy Prices Await OPEC Cut Agreement
West Texas Intermediate fell 0.7 percent on Tuesday. WTI is trading at $52.77 ahead of the meeting of the Organization of the Petroleum Exporting Countries (OPEC) in Vienna. The group is highly anticipated to once again strike a deal to limit production in an effort to stabilize prices. Russia has been on the fence after participating in the first agreement. During the G20 leaders from Russia and Saudi Arabia met and Vladimir Putin made an announcement on Saturday agreeing to a cut. The actual details of how much the curb of supply would be remains up for debate and until those numbers are known crude will be under pressure.
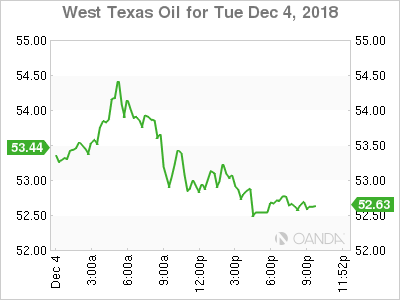
The Energy Information Administration (EIA) will delay its weekly crude inventories data due to the Bush national mourning day. This week the report will be published on Thursday at 11:00 am EST. Making Thursday a very busy day for energy traders as the OPEC meeting and weekly US crude stocks will happen on the same day, alongside other major economic indicators that were delayed.
Gold Rises as Trade Uncertainty Makes a Comeback
Gold rose 0.35 percent on Tuesday. The yellow metal is trading at $1,238 after the truce announced by China and the United States during the G20 meeting appear to be short lived. Both camps went on the offensive and hinted that things could get ugly if a deal is not reached. The yellow metal was a refuge for investors as the dollar was sold off in search for a safe haven.
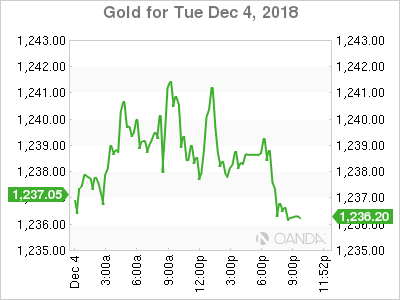
Gold remains under pressure from more potential interest rate hikes form the U.S. Federal Reserve, but investors are starting to question how many rate hikes are really left before the Fed reaches a neutral rate. The market is pricing in an almost 90 percent probability of a rate lift in the December 19 meeting, but the outlook beyond is getting cloudy, with investors questioning the dot plot expecting 4 more rate hikes next year.
Market events to watch this week:
Wednesday, December 5
4:30am GBP Services PMI
8:15am USD ADP Non-Farm Employment Change
10:00am CAD BOC Rate Statement
7:30pm AUD Retail Sales m/m
Thursday, December 6
All Day All OPEC Meetings
8:30am CAD Trade Balance
10:00am USD ISM Non-Manufacturing PMI
11:00am WTI EIA Weekly Oil Inventories
Friday, December 7
8:30am CAD Employment Change
8:30am USD Average Hourly Earnings m/m
8:30am USD Non-Farm Employment Change
China MOFCOM on US-China trade talk: Will implement specifics as soon as possible
China's Ministry of Commerce issued an extremely brief Q&A statement regarding the results of Xi-Trump summit. In short, the MOFCOM said the meeting was successful. And, the economic and trade teams from both sides will actively promote the work of negotiations within 90 days in accordance with a clear timetable and road map. Most importantly, China pledged to implement the specifics, "sooner the better".
Here is the exact Q&A translated by Google.
A reporter asked: We know that the Chinese economic and trade team has returned to Beijing. What is your comment on this meeting?
A: The meeting was very successful and we have confidence in the implementation.
Q: How is China prepared to promote the next economic and trade consultation?
A: The economic and trade teams of the two sides will actively promote the consultation work within 90 days in accordance with a clear timetable and road map.
Q: What are the priorities for China?
A: China will start from implementing specific issues that have reached consensus, and the sooner the better.
First Impressions: Australian Q3 GDP
Q3 Real GDP: 0.3%qtr, 2.8%yr. A material downside surprise, led by weak consumer spending.
Q3 GDP
- Output growth was 0.3%, which was well below expectations (market median and Westpac 0.6%)
- This follows results for the past three quarters of: 0.5% Q4 2017; 1.0% Q1 and 0.9% for Q2.
- Annual growth has slipped to 2.8%, also a downside surprise – a forecast 3.3%. The June annual growth figure was revised to 3.1% from 3.4% previously
Key surprises
- Consumer spending was weak, up only 0.3% vs an expected 0.5%. Business investment declined by more than anticipated and by more than suggested by the partials, a -1.9% vs an expected -0.8%.
Details
- Real GDP: 0.3%qtr, 2.8%yr
- Nominal GDP: 1.0%qtr, 5.2%yr
- Terms of trade: 0.8%qtr, 2.7%yr
- Domestic demand: 0.3%, 2.7%yr
- Inventories: -0.3ppts qtr
- Net exports: +0.4ppts qtr, +0.6ppts yr
- Consumer spending: 0.3%qtr, 2.5%yr
- Home building: 1.0%qtr, 7.1%yr
- Business investment: -1.9%qtr, -0.8%yr
- Public demand: 1.5%qtr, 4.5%yr
- Farm output: -1.0%qtr, -8.1%yr
- Wage incomes: 1.0%qtr, 4.3%yr
- Wages (average earnings non-farm sector): 0.2%qtr, 1.2%yr
- Household consumption deflator: 0.4%qtr, 1.8%yr
- Household saving ratio: 2.4%, moderating from 4.0% a year earlier.
Comments
The economy lost momentum moving in to the second half of 2018 centred on housing and the consumer against the backdrop of a further tightening of lending standards to the housing sector. Business investment also took a step lower, led by mining, with the completion of major gas projects.
Jobs growth remained robust in the September quarter, at +0.7%, including a 0.8% increase in full-time jobs. Drought conditions in NSW and surrounding areas, as well as supply disruptions in the mining sector, were headwinds in the period, constraining the nation’s productivity performance.
New home building activity declined in Q3, -0.8%, after recent strong gains over the first half of the year (3.5% and 3.0%). This is the start of a downturn in our view, as suggested by the trend decline in approvals
Consumer spending came in below expectations with a 0.3% gain in the quarter slowing annual growth to 2.5%yr.
The big downside surprise was around services spend which looks to have dipped in the quarter, and vehicle operations (i.e. spending on fuel).
The updates on household incomes were also soft. Labour income posted a decent 1% gain in the quarter but disposable incomes rose just 0.3% overall with weak non-wage income and increased tax payments curbing the gain in nominal terms.
In real terms, household disposable incomes dipped 0.1% in the quarter and have shown no growth at all in 2018.
That meant the gain in spending was again ‘funded’ by a reduction in savings – the savings rate falling from an upwardly revised 2.8% in Q2 to 2.4% in Q3, a post GFC low (previous historical estimates have also been revised up).
Business investment was disappointing in Q3, -1.9%, led lower by infrastructure, -8.2% (centred on the mining sector due to the recent completion of major gas projects) and by a decline in non-residential building work. The capex survey suggests that business investment will advance in the 2018/19 financial year.
Public demand and net exports were key growth engines in the quarter, a dynamic that is expected to continue. Public investment is rising sharply, with a focus on transport infrastructure, as governments play catch-up in meeting the needs of fast growing populations in our major cities, particularly Melbourne and Sydney.
Net exports are adding to growth supported by services and a lift in LNG exports as new capacity comes on stream. The Q3 outcome was held back by temporary supply disruptions which saw iron ore and coal shipments decline.
Reserve Bank’s Response: Bill Evans, Chief Economist
This result will come as a disappointment to the Reserve Bank. Note that the forecast for GDP growth in 2018 for which appeared in the November Statement on Monetary Policy was 3.5%. With the first three quarters of the year totalling 2.2% the December quarter would have to print growth of 1.3% (a 5.2% annualised growth pace) – a highly unlikely event. We can expect the Bank to lower its forecast for GDP growth in 2018 from 3.5% to 3.0% when it next releases its forecasts on February 9 2019.
That forecast will then challenge the 2019 forecast of 3.25% which appeared in the November Statement. It was reasonable for the Bank to assume some slowing between 2018 and 2019 (Westpac’s growth forecast for 2019 has been 2.7%) particularly with a more clouded outlook for global growth and a likely accelerated contraction in residential investment. (Note new dwellings contracted by 0.8% in The September quarter following two quarters which averaged 3.2% in March and June). That would immediately push the likely 2019 forecast back to around Westpac’s forecast of 2.7%.
So, this print is likely to change the Bank’s growth rhetoric of strongly above trend to slightly above trend drifting back to trend in 2019.
Westpac has consistently forecast that the cash rate would remain on hold through 2019 and 2020. If we are right that the Bank will revise down its growth forecasts on the basis of this result then lower expected growth momentum going into 2020 may also temper the Bank’s attitude to rates in 2020 as well.
DOW and yields tumbled, but limited downside potential in near term
US stocks tumbled sharply overnight and risk aversion spreads to Asia. DOW closed down -799.36 pts or -3.10% at 25027.07. S&P 500 dropped -3.24% to 2700.06 and NASDAQ lost -3.80% to 7158.83. DOW has now pared much most of the gains triggered by Fed Chair Jerome Powell's dovish turn last week, as well as the US-China trade truce.
While the fall was deep, there was no special technical development. It's a bit disappointing that DOW couldn't even touch 26000 with the rebound. But after all, it's in the corrective pattern that started from 26951.81. We'd maintain that for the near term, range is set for the consolidation and 24122.23 should hold even in case of deeper fall. For the medium term the correction from 26951.81 would likely have a test on 38.2% retracement of 15450.56 (2016 low) to 26951.81 at 22558 before completion.
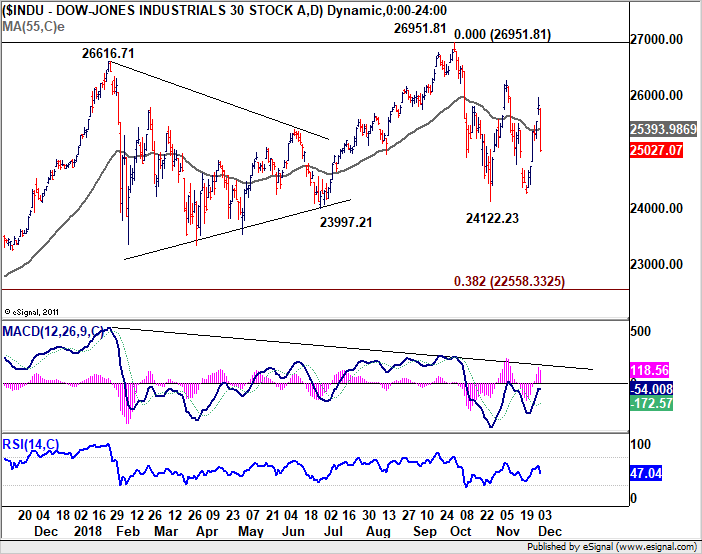
Some attributed the stock market decline to yield curve inversion in the US, between 3- and 5- year yield. That's certainly hit the nerves of investors as global treasury yields, not just the US, dropped sharply.
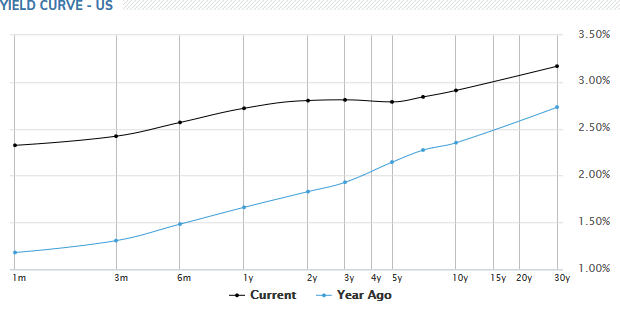
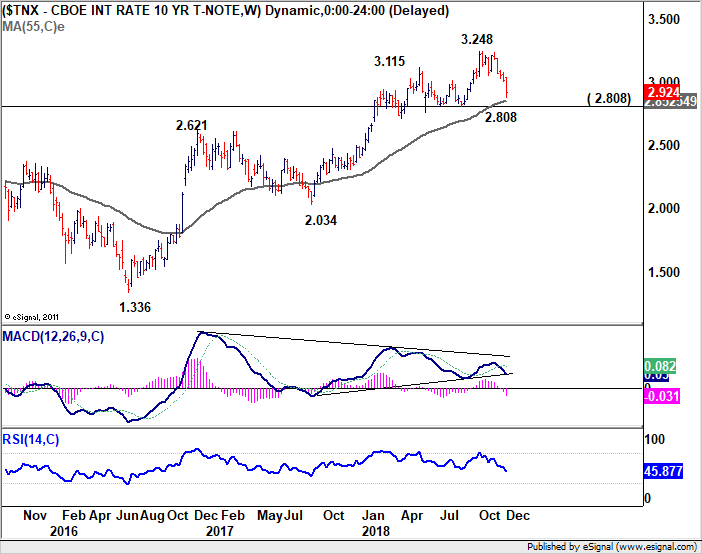
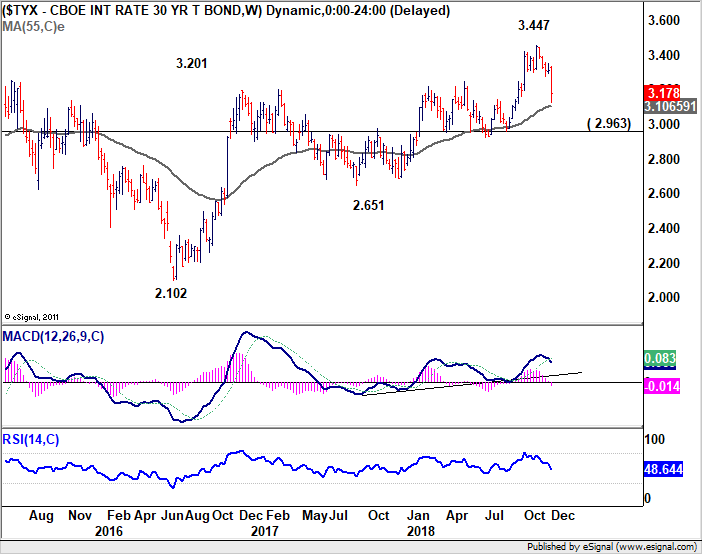
10 year yield closed down -0.068 at 2.924, back below 3% handle. 30 year yield also dropped -0.100 to 3.178. The technical developments are turning bad. But for the near term at least, as both are close to 55 week EMAs, we'd expect limited downside potential.
Eco Data 12/5/18
[php_everywhere instance="1"]
Today’s top mover: CAD/JPY is a pair to avoid
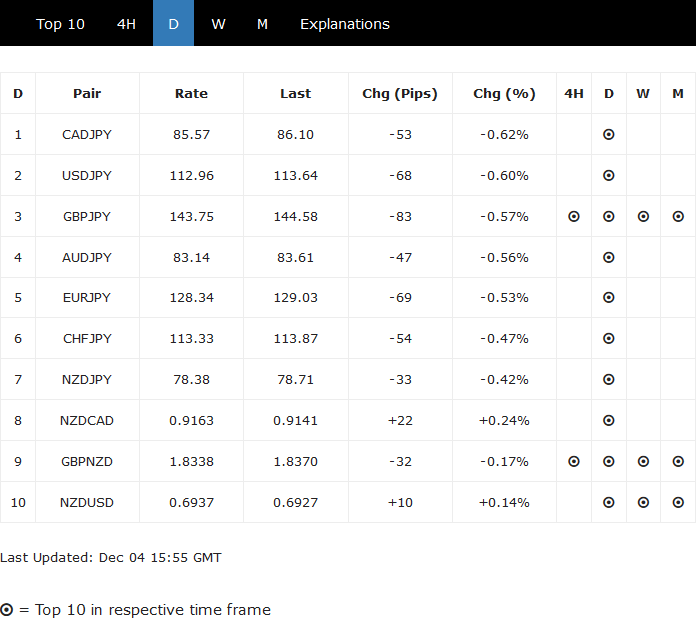
At the time of writing, CAD/JPY is the biggest mover today, down -53 pips. But it's a rather tight race. Yen is generally speaking the stronger one on falling global treasury yields. But no currency is decidedly strong.
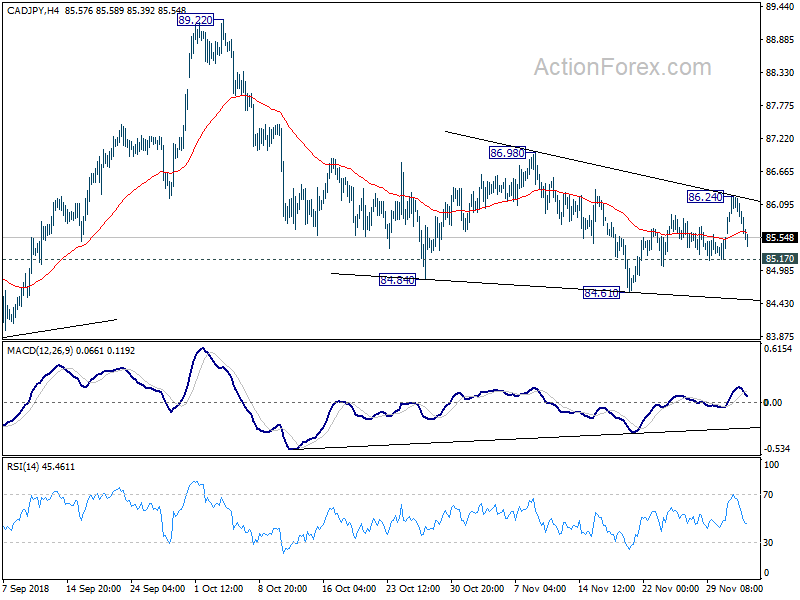
Meanwhile, the outlook of CAD/JPY is rather mixed and, admittedly, hard to determine. There are two scenarios with equal probability to us. Firstly, the corrective fall from 89.22 has completed with three waves down to 84.61. That is CAD/JPY has bottomed at 84.61 already and the next move is up through 86.98 resistance.
Secondly, such decline is not completed yet. And price actions from 84.84 are merely a sideway corrective pattern that's skewed to the downside. That is, CAD/JPY should have another decline through 84.61 low.
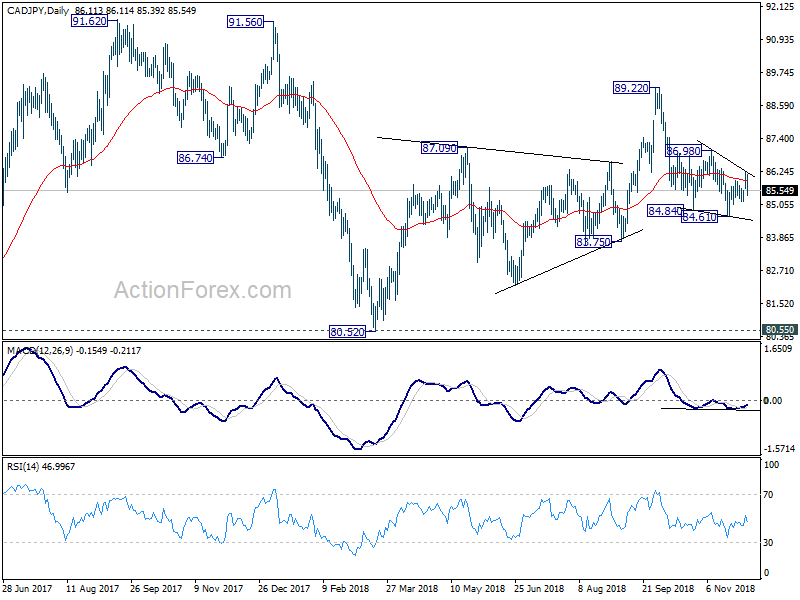
We won't object if our readers found the above view as nonsense. They're actually quite useless for trading the pair. At this point, to us, CAD/JPY is a pair to avoid.
But anyway, break of 85.17 minor support will favor the bearish case and turn bias to the downside for 84.61 support first. Break will target 83.75 and below. On the upside, break of 86.25 will favor the bullish case and turn bias to the upside for 96.98 resistance.
What to Expect From Central Bankers in 2019
Highlights
- 2019 is likely to represent the peak level of interest rates for the U.S. and Canada. The debate among market participants will continue to heat up on whether central banks will succeed in finding the sweet spot in the neutral rate.
- Policymakers will have to double-down on efforts to monitor incoming economic and financial data during this last phase of the rate-hike cycle. High on the watch list will be any sharp deterioration in consumer/business confidence within a slowing global economy.
- There has been some market concern related to a potential stress on commercial banks from the continued draining in excess reserves. Though we believe this is much ado about nothing, the Fed will have to provide clarity on its intention of excess liquidity within the banking system.
- The Bank of Canada has only one policy lever to focus on, the overnight rate. However, the balance of risks for Canada is more to the downside than its U.S. counterpart, given overstretched households and the recent negative shock to local energy markets.
Three years ago, the Federal Reserve raised its policy rate for the first time since the global financial crisis. While it wasn't the first central bank to hike, previous attempts by others proved premature. For example, the Bank of Canada was one of the first out of the gate, but had to reverse course as weak oil and broader commodity prices dragged down economic growth prospects in 2015.
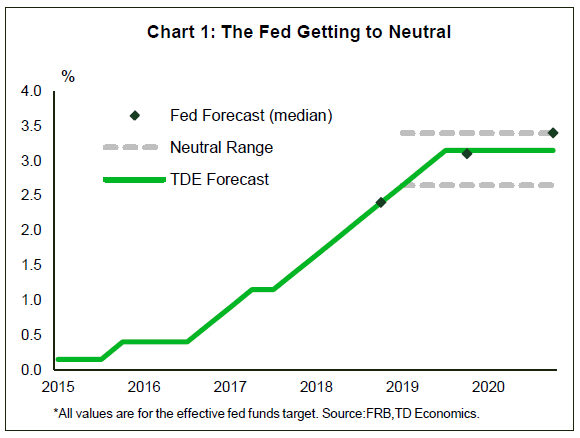
The Federal Reserve's cautiousness didn't go away once they began hiking rates. After a single rate hike, a full year elapsed before another followed, while it assessed the global economic stress stemming from China. Once that risk proved benign, the FOMC re-started the pace of interest rate hikes. Now, with 200 bps under its belt and another 25 bps coming in December, the Fed's target rate will have entered the bottom end of estimates for the neutral rate (Chart 1). This leaves them facing three important questions in 2019. Will the Fed find the sweet spot within the neutral range, cited as 2.50-3.50%? What will be the interplay of global and financial market movements? And, how will balance sheet runoff be evaluated alongside both of these backdrops? With the exception of the balance sheet question, the Bank of Canada will be facing a similar decision set.
How high will rates go?
The policy decisions of the Fed are directly based on the dual mandate of full employment and stable prices. On the former, the mandate has been filled in a broad sense. There's no light that suddenly goes off to tell us this, but there are a number of labor market indicators that offer confidence. For instance, the unemployment rate sits at 3.7%, well below the Fed's 4.5% assumption for the natural rate. Furthermore, the amount of people feeling confident enough to leave current jobs is at a record high, and businesses are consistently reporting increased difficulty in filling positions. Supporting this notion, aggregate wages breached 3% for the first time since the recession. Is there room to draw more workers into the labor force? We suspect the answer is yes. Participation rates of 25-54 year olds are at a cyclical (but not historical) high, and there are about 4.6 million people still working part time for economic reasons. Even so, none of this overcomes from the reality that marginal increases in labor are getting tougher to come by and the data convey a tight labor market.
As wage and other input prices place pressure on the operating costs of businesses, this is eventually passed through to consumer prices. After years of disinflationary pressures, the Fed's preferred metric of core PCE has largely stabilized around the 2% target rate. There are no alarm bells going off on this front, and recently the trend has even ebbed. But, the balance of risks is tilted to the upside so long as labor markets remain tight and the overall U.S. economy runs at an above trend pace.
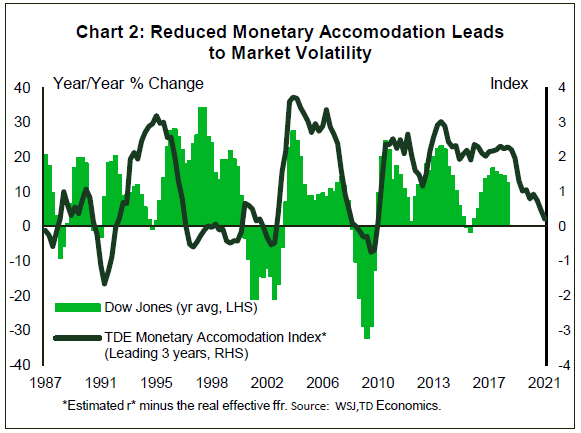
Putting all of this into a monetary policy rule tells us that the Fed should raise rates closer to the mid-point of the neutral range, rather than keeping rates at the bottom end. However, this is now the "fine tuning" stage of the policy rate cycle. There is broad agreement that the Fed is within the scope of the neutral level, yet there isn't agreement on its precise level. That means we will likely see greater diverging views among Fed members (within speeches and voting dissents) relative to the past year, when voices were largely in unison about the direction and pace of rate hikes. Likewise, financial markets will remain sensitive to gyrations in the data and be more "opinionated" on the Federal Reserve's judgement as peak interest rates come into sight. This is the stage in the interest rate cycle where volatility in equity market movements can become more exaggerated (Chart 2), however this does not necessarily correlate to a downturn in the economic cycle. It's merely warning shots being fired by investors, as recalibration occurs on expectations for corporate earnings and business cycle risks.
How much do global and financial market risks matter?
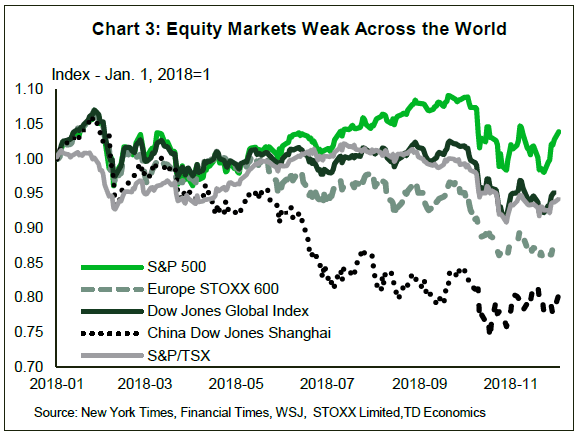
With clear evidence that economic momentum has already downshifted in the second half of 2018, the New Year will usher in ongoing questions regarding the stability of the global economy. Ever since the U.S. Administration's steel and aluminum tariffs, both consumer and business confidence (outside of the U.S.) have eased from elevated levels. More recently, there's even evidence that U.S. order books are wavering, particularly business sentiment indicators on export orders. Equity and currency markets have indicated their angst (Chart 3), with global markets negative on the year. At this point, 2018 marks the worst year for global equity returns since 2015. The S&P 500 has fared better, holding onto a roughly 4.5% year-to-date return. In turn, safe-haven flows have pushed up the greenback by 8% against its broad trading partners over the year. This narrative is drawing a lot more investor concern and you better bet the Fed is closely watching these developments.
There's no question that global growth hit the high water mark in the first half of 2018, but this is not a surprise. We had forecasted slower growth, consistent with the fact that momentum was too high relative to its sustainable running speed. However, the knock-on impacts of trade tensions has certainly rung some alarm bells that global growth might now overshoot to the downside, rather than stabilize as we hope. The source of deceleration is largely stemming from emerging market economies. Growth is slowing from Latin America to East Asia. Ground zero appears to be in South East Asia, specifically China, India, and the ASEAN economies, influencing global trade, the commodity channel, and corporate profits. The recent developments from the G20 summit, where an escalation of U.S.-China trade tariffs will be delayed for 90 days is certainly favorable. But, the lack of specifics from both countries and a defined resolution means that the risk-environment remains high.
By the same token, U.S. growth hit a high water mark about three months ago. Although this was a bit later than the global economy due to the fiscal stimulus impulse, momentum is ultimately constrained by the economic fundamentals. GDP growth for the fourth quarter is tracking about 2.5%, down from close to 4% annualized during the previous two quarters. The step-down in global and U.S. growth prospects will leave financial markets more sensitive to gyrations in the data.
It is important to confirm that even though investor confidence is coming down from a cyclical high, we have not yet seen a confidence shock. Advanced economy stock markets typically experience peak-to-trough sell-offs of 15% in any given year. Recent movements are still within the realm of normal, and the VIX is sitting at its historical average. However, if there's a significant and sustained deterioration in equity prices (20% or more) alongside measures of business and consumer confidence, the Fed will hit the pause button on rate hikes.
Does size matter on the Fed's balance sheet?
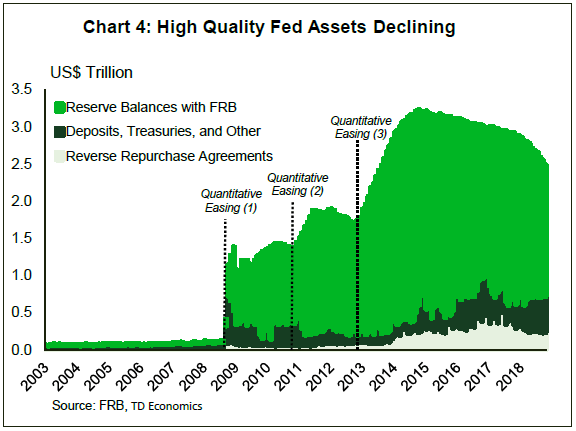
Part of the Fed's communication in 2019 will also need to address investor questions on the next stage of its balance sheet. In June 2017, the Addendum to the Policy Normalization Principles and Plans was published – outlining the runoff schedule for the Fed's balance sheet. Following years of asset accumulation through its quantitative easing (QE) program, reserves above what is required amounts to $2.4tn, down from $3.2tn in late 2014 (Chart 4). The run-off of the balance sheet was initiated in October 2017 to little market reaction and has neither impacted market stability, nor pushed Treasury yields significantly higher. However, some commentators are now quibbling about the potential for market stress to materialize if the total amount of excess liquidity in the system is drained too much. The question being asked is whether the Fed will strike the right balance between the needs of financial institutions and that of monetary policy?
There are several components to this question. The first rests in the mechanics of setting the target policy rate. The existence of a balance sheet in excess of what is required by the economy means that the Federal Reserve must use a "floor system" for setting rates instead of the channel system (open market operations) it used prior to QE. This requires an upper limit that is held in place by incentivizing financial institutions to leave their funds at the central bank in exchange for receiving interest on excess reserves (IOER). The lower limit is set via overnight reverse repurchase agreements (ON-RRPs) in order to make sure that rates don't go below a predetermined floor. In combination, these allow the Federal Reserve to maintain an incentive system that keeps the effective fed funds rate within the target range. This system is working quite well and based on past Fed communication, we expect it is here to stay.
Keeping the floor system requires that excess liquidity remain in the system and that banks continue to hold these reserves on their balance sheets. This is important as commercial banks have been using reserves with the Fed to meet their regulatory requirements to hold specific amounts of high quality liquid assets (HQLA). In this way, the amount of excess reserves the Fed decides to leave in the banking system will directly impact banks (who are also collecting interest on these assets).
We see the Fed continuing to normalize until reserves above currency reaches a level around $500bn to $1tn. As the Fed drains reserves as part of their balance sheet normalization process, banks will need to find substitutes for HQLA. Some believe this opens the door to a policy error, with the Fed inadvertently creating strain on commercial banks, which will have to sell other risky assets to purchase HQLA to maintain regulatory ratios. We're doubtful that this will cause any significant stress on financial institutions. Banks know the run-off schedule of the Fed in advance and the slow moving process will enable banks to gradually adjust the composition of their balance sheets in an orderly fashion. Furthermore, the bulk of excess reserves are held on the balance sheets of the largest U.S. banks. These holdings are well in excess of what regulations require. Therefore, the elimination of excess reserves is not likely to force large asset sales as some fear and the required transaction of substituting HQLA away from excess reserves will not cause systemic stress. Still, some investors may take an "I'll believe it when I see it" attitude.
What to expect from the Bank of Canada?
Like the U.S. economy, the Canadian economy is demonstrating stable prices with several core measures of inflation all around 2%. The Bank of Canada is also in a position of normalizing interest rates back to neutral levels (which we think is around 2.25% to 2.50%). We believe the Bank will get to a neutral stance in 2019, but how it gets there is of great debate amongst economists.
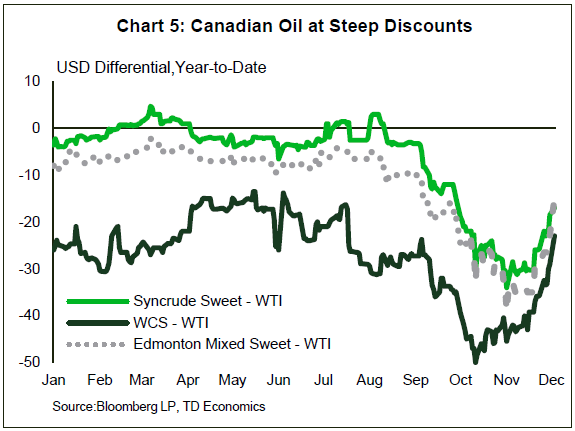
Even with the Bank of Canada's inflation mandate essentially filled, there are risks to the outlook that are unique to Canada and may slow the timing of rate hikes. The most familiar of these is the long standing risk related to over-leveraged households that may belt tighten more than expected. Already the consumer spending profile for the third quarter was less than impressive with a below-trend pace of 1.2%. More recently, a new kid on the block has shown up as a primary risk to the outlook – weak Canadian energy prices and the knock-on impact to economic momentum from production and employment cuts. An intensification of shipping constraints have caused Canadian oil prices to be heavily discounted (Chart 5), forcing the Alberta government to cut production. Even with refineries ramping-up production and more rail capacity becoming available, it will take time to reduce high inventories. The discount on Canadian energy is likely to hold at above-average levels relative to history. More importantly for Bank of Canada consideration, recent developments will markdown economic momentum, with particular negative impacts to income and Canada's terms of trade. Although this may prove to be only a temporary influence in the data, their risk-management framework argues to monitor developments and ensure the forecast remains on track before moving forward with further rate hikes. At the time of writing, our tracking for real GDP in the fourth quarter of 2018 is below the Bank of Canada's 2.4% forecast by roughly a full percent (annualized). This suggests the timing of the next rate hike would be better suited for the March/April period, even though financial markets currently have high hopes of a rate hike come the January 9th meeting.
Bottom Line
The Fed is on course to raise its policy rate to the bottom end of the neutral range at its policy meeting in mid-December. This sets up 2019 as the year to slow the pace of hikes and find the sweet spot within the neutral range. The U.S. economy is facing tight labor markets, evidenced by rising wages and core inflation at 2%. With economic momentum continuing to overshoot the potential pace, this should keep the Fed's bias towards further upward nudges in the policy rate towards the mid-point of the neutral range. They will also be mindful that 2019 will carry forward elevated risks related to trade policy and investor aversion. Any large deviations from expectations on this front will cause the Fed to move to the sidelines.
As for the Bank of Canada, the focus will be on the intersection of domestic risks to international risks, with the latter marked by slowing global momentum, softening commodity prices and any escalation in U.S. trade tensions with other countries. The signing of the USMCA clearly mitigates a key domestic risk, but others have popped up in its place, like the energy sector and some woes from the auto manufacturing sector. The Bank has long reinforced that they are data dependent and are not on a pre-set course with their interest rate cycle, and this will remain the case in 2019. We think two rate hikes are on the docket for 2019, which is a downgrade from our prior view of three hikes in light of the recent domestic risks that have emerged and some unexpected weakening in economic momentum.
Japanese Yen Rallies as Risk Appetite Wanes
The Japanese yen has ticked higher in the Tuesday session. In North American trade, USD/JPY is trading at 112.92, down 0.64% on the day. It’s a quiet day on the release front, with no major indicators in Japan or the United States.
The markets were delighted with the results of a weekend meeting between President Trump and Chinese President Xi Jinping at the G-20 summit. Trump had threatened to raise tariffs on all Chinese products from 10 percent to 25 percent on December 1, but the Chinese convinced Trump to hold off on the tariffs until March 1, to give more time for the countries to reach a deal. News of the truce between the world’s two largest economies raised risk appetite and equity markets showed sharp gains. However, the optimism proved to be short-lived, as investors are concerned that the 90-day reprieve may not lead to a long-term agreement over tariffs. Tuesday’s flavor of the day has been safe-haven assets, which has sent the yen sharply higher. The U.S. and China the sides remain far apart on a number of issues, and reaching a deal will be difficult. If the talks fail to show progress, the yen could continue to move higher.
Is the Japanese economy in trouble? Japan’s manufacturing sector slowed down in November, raising concerns about the strength of the economy. Manufacturing PMI slipped to 52.2, down from 52.9 in October. The ongoing global trade war is a primary factor in the weak reading, as Japanese companies which export to the U.S. or China have been hurt by higher tariffs. A weaker eurozone economy has led to softer European demand for Japanese exports. Making matters worse, domestic demand remains fragile, as nervous consumers continue to hold tightly onto their purse strings.
Sunset Market Commentary
Markets
Global core bonds are gaining ground today. Yesterday’s risk improvement after the US/China 90-day truce didn’t persevere today with Asian equity markets (except Chinese indices whom closed in green) setting the tone. US Treasuries rose further this morning. The front end of the US yield curve (5y-2y) inverted for the first time in more than a decade, hinting a looming recession and investors estimating that the end of the Fed’s hiking cycle is closer than originally thought. European equities opened with substantial losses, mirrored by a higher opening for the German Bund. It immediately paired those gains however and moved sideways for the rest of the day. Higher than expected EMU PPI’s didn’t influence trading much, with no other economic data being released today in the eurozone. The US eco calendar was entirely empty too. No fresh signals stem from Italy today as both Italy and the EU confirm willingness to work towards an agreement. Italian BTP’s edge somewhat lower anyway. The German yield curve bull flattens with changes ranging from -0.2 bps (2-yr) to -3.2 bps (30-yr). The US yield curve flattens too with yield changes from +0.6 bps (2-yr) to -3.9 bps (30-yr). The decline in risk sentiment pushed spreads over the German 10-yr yield higher, with Greece (+5 bps), Portugal (+3 bps) and Italy (+3 bps) underperforming.
Underlying drivers of today’s currency markets are hard to pinpoint and at times even conflicting. Slightly better EMU PPI’s were only of secondary importance from a currency point of view. From Asian trading onwards EUR/USD traded with an upward bias. Moves in the likes of USD/JPY reveal that it has more to do with dollar weakness rather than with euro strength. A fragile risk environment (i.e. declining core bond yields and equity markets) would suggest otherwise. The pair topped around noon with the US entering markets and is currently struggling to hold the 1.14 mark (1.1397 at the time of writing). It is possible US investors are frontloading some dollar bids as US financial markets are closed tomorrow in honour of George H.W. Bush. USD/JPY only recovers slightly from this morning’s knock-out punch. The pair is trading at 112.9.
Sterling jumped higher today after the attorney general of the EU’s Court of Justice said the UK has a right to unilaterally withdraw Article 50 – the article triggered by the UK following a 2016 referendum to leave the European Union. The attorney general’s non-binding opinion suggests there is no need for unanimity among the 27 other member states should the British government – although unlikely – reverse Brexit. News like this cuts both ways. It could provide the government the leverage needed to silence Brexit hardliners and win their support for the current brexitdeal on December 11th. The AG’s conclusion might on the other hand embolden pro-Remainers, triggering them to vote against the deal and stepping up efforts for a second referendum. Sterling took the report very well initially, surging below the EUR/GBP 0.89-handle but retracing all of the progress afterwards. The pair is currently trading close to 0.893. In his speech before Parliament, chair Carney defended the BoE’s projections in case of a disorderly Brexit. The bank was accused of presenting a “doomsday” scenario in order to help the government getting the deal through Parliament. The pound was little affected.
News Headlines
The South African economy grew with 2.2% in the third quarter (QoQa), beating expectations of a 1.9% increase and following a revised 0.4% decrease in the quarter before. The year-on-year GDP number rose from 0.4% to 1.1%, beating market expectations of 0.5%. Rebounds in finance, trade and manufacturing were the drivers of the growth.
French president Emmanuel Macron will reverse the planned fuel-tax hike, in the light of recent protests. Prime Minister Edouard Phillippe announced the decision of the French government today, saying that “no tax merits putting the nation in danger”. The protesting “Yellow Vests’ already said it was too little, too late.
Trump: Xi and I want the deal to happen; Stock markets ignore and decline with yields & dollar
The financial markets seem to be repricing the US-China trade truce today. DOW open lower and is currently trading down -160pts or -0.6%.
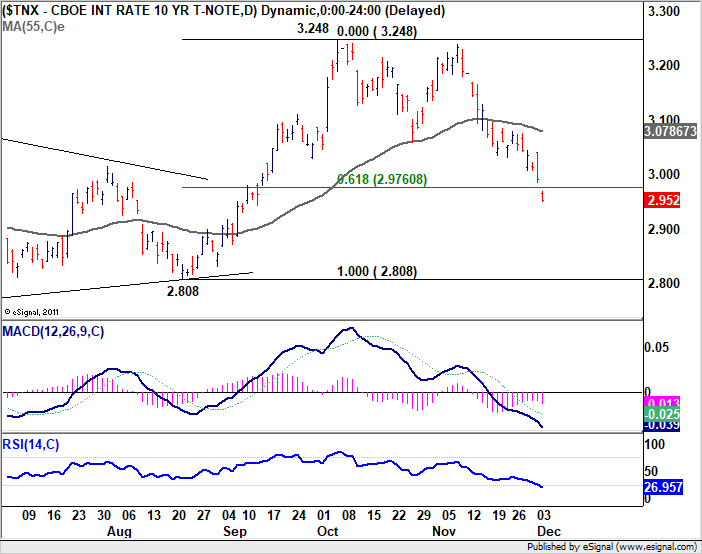
At the same time treasury yield is in deep decline. 10-year yield breaks 61.8% retracement of 2.808 to 3.248 at 2.976. That's a rather bearish development and would put 2.808 medium term key support in focus. At the same time, Dollar is among the weakest ones together with Canadian and Aussie.
Trump sounded positive with his tweet as same "President Xi and I want this deal to happen, and it probably will". But the stock markets aren't paying much attention.
https://twitter.com/realDonaldTrump/status/1069962093301022720
https://twitter.com/realDonaldTrump/status/1069968462724980736
https://twitter.com/realDonaldTrump/status/1069970500535902208