Sample Category Title
Aussie Extends Its Losses In The Asian Session
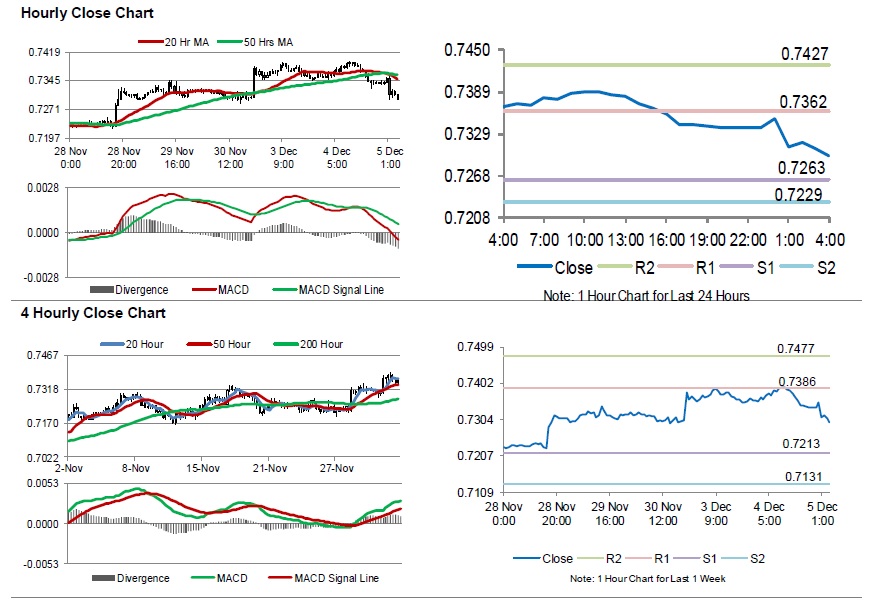
For the 24 hours to 23:00 GMT, the AUD declined 0.24% against the USD and closed at 0.7338.
LME Copper prices declined 0.5% or $29.0/MT to $6278.0/MT. Aluminium prices rose/declined 0.1% or $2.5/MT to $1985.0/MT.
In the Asian session, at GMT0400, the pair is trading at 0.7296, with the AUD trading 0.57% lower against the USD from yesterday’s close.
Overnight data indicated that Australia’s seasonally adjusted gross domestic product (GDP) advanced 0.3% on a quarterly basis in 3Q 2018, undershooting market consensus for an advance of 0.6%. In the previous quarter, GDP had recorded a rise of 0.9%. Furthermore, the nation’s AIG performance of services index climbed to a level of 55.1 in November, following a level of 51.1 in the prior month. Moreover, the CBA services PMI rose to a level of 53.7 in November, compared to a reading of 52.6 in the preceding month.
Elsewhere in China, Australia’s largest trading partner, the Caixin/Markit services PMI index unexpectedly increased to a level of 53.8 in November, defying market anticipation for a fall to a level of 50.7. In the previous month, the index had registered a level of 50.8.
The pair is expected to find support at 0.7263, and a fall through could take it to the next support level of 0.7229. The pair is expected to find its first resistance at 0.7362, and a rise through could take it to the next resistance level of 0.7427.
The currency pair is trading below its 20 Hr and 50 Hr moving averages
EUR/AUD Daily Outlook
Daily Pivots: (S1) 1.5415; (P) 1.5441; (R1) 1.5480; More....
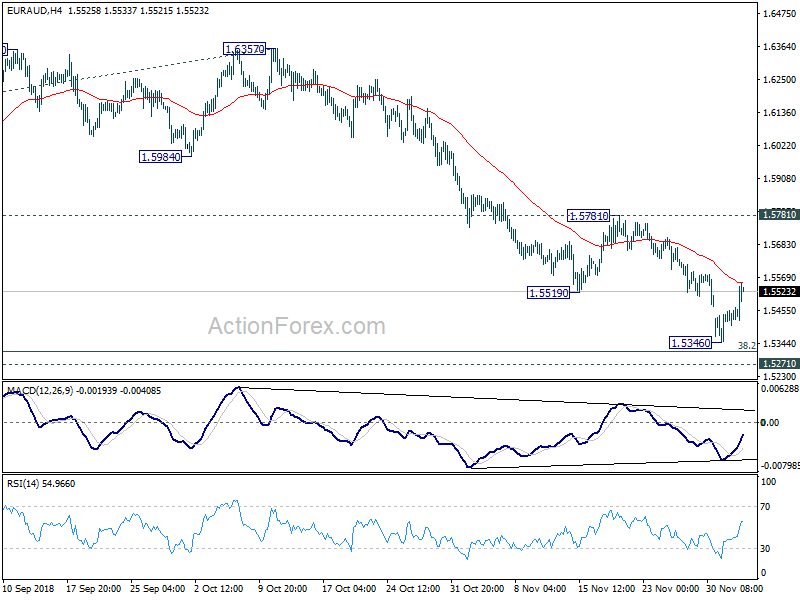
EUR/AUD rebounded after hitting 1.5346, ahead of 1.5271/5313 cluster support zone. Intraday bias is turned neutral first. While stronger recovery cannot be ruled out, near term outlook will stay bearish as long as 1.5781 resistance holds. On the downside, below 1.5346 will target 1.5271/5313 cluster support zone again. However, considering bullish convergence condition in 4 hour MACD, break of 1.5781 will suggest that fall from 1.6357 has completed. And intraday bias will be turned back to the upside for retesting 1.6357.
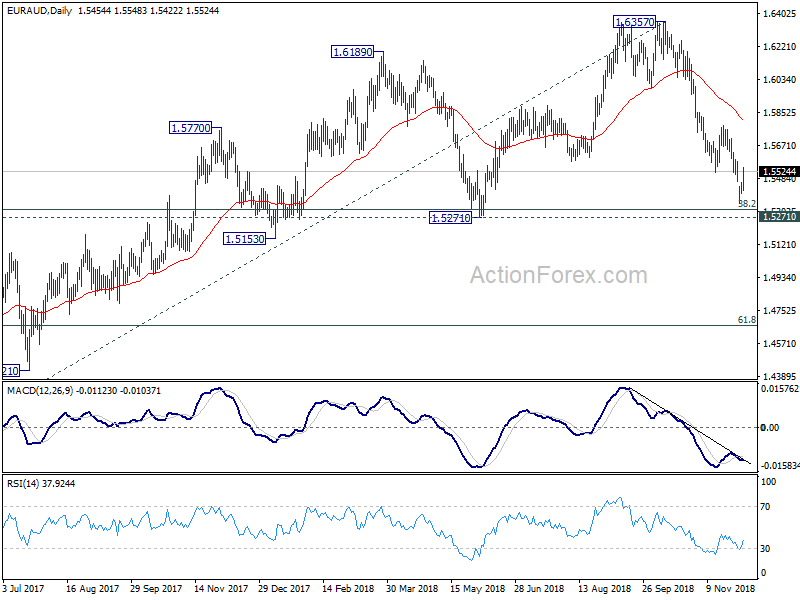
In the bigger picture, current development argues that up trend from 1.3624 (2017 low) is possibly completed at 1.6357, ahead of 1.6587 (2015 high). Fall from 1.6357 should be corrective such up trend and would target 1.5271 cluster support (38.2% retracement of 1.3624 to 1.6357 at 1.5313). Break will extend the correction to Break will target 61.8% retracement at 1.4668. Nevertheless, firm break of 1.5781 will suggest that the pull back has already completed. And larger uptrend from 1.3624 might be ready to resume.
Gold: Yellow Metal Reverses Its Gains In The Asian Session
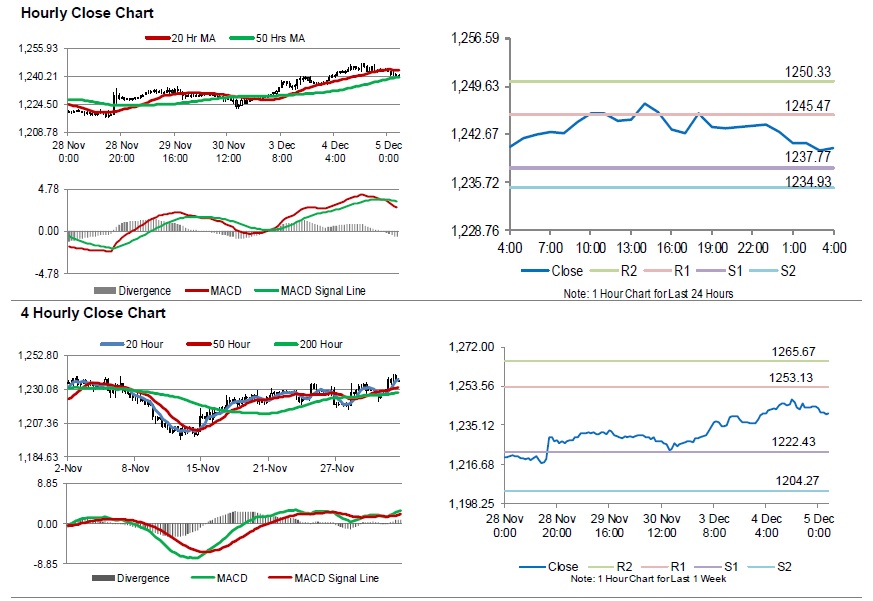
For the 24 hours to 23:00 GMT, Gold rose 0.62% against the USD and closed at USD1243.90 per ounce.
In the Asian session, at GMT0400, the pair is trading at 1240.60, with gold trading 0.27% lower against the USD from yesterday’s close.
The pair is expected to find support at 1237.77, and a fall through could take it to the next support level of 1234.93. The pair is expected to find its first resistance at 1245.47, and a rise through could take it to the next resistance level of 1250.33.
The yellow metal is trading below its 20 Hr moving average and showing convergence with its 50 Hr moving average.
Silver: White Metal Trading On A Weaker Footing This Morning
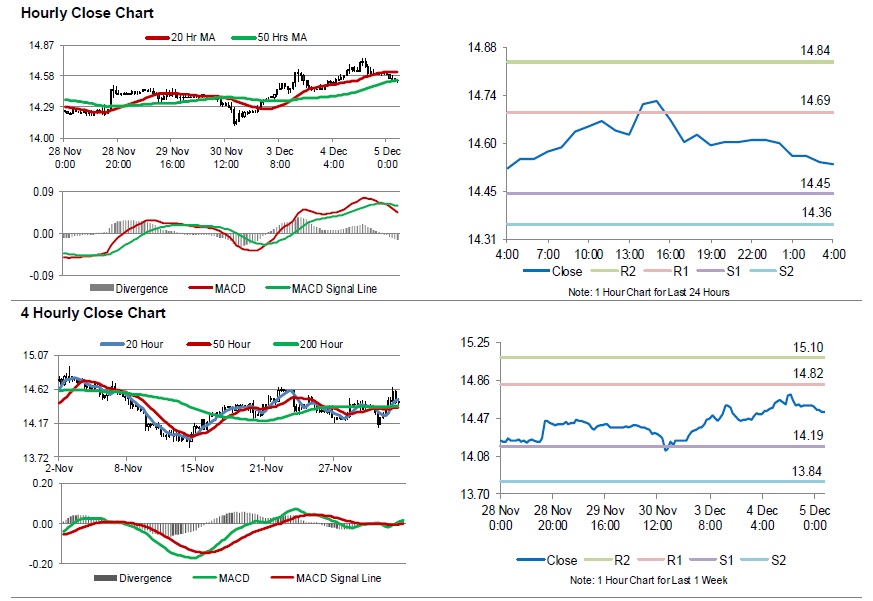
For the 24 hours to 23:00 GMT, Silver rose 0.97% against the USD and closed at USD14.61 per ounce, tracking gains in gold prices.
In the Asian session, at GMT0400, the pair is trading at 14.54, with silver trading 0.48% lower against the USD from yesterday’s close.
The pair is expected to find support at 14.45, and a fall through could take it to the next support level of 14.36. The pair is expected to find its first resistance at 14.69, and a rise through could take it to the next resistance level of 14.84
The white metal is trading below its 20 Hr moving average and showing convergence with its 50 Hr moving average
Crude Oil: Oil Trading Lower, Ahead Of EIA’s Weekly Crude Oil Stockpiles Data
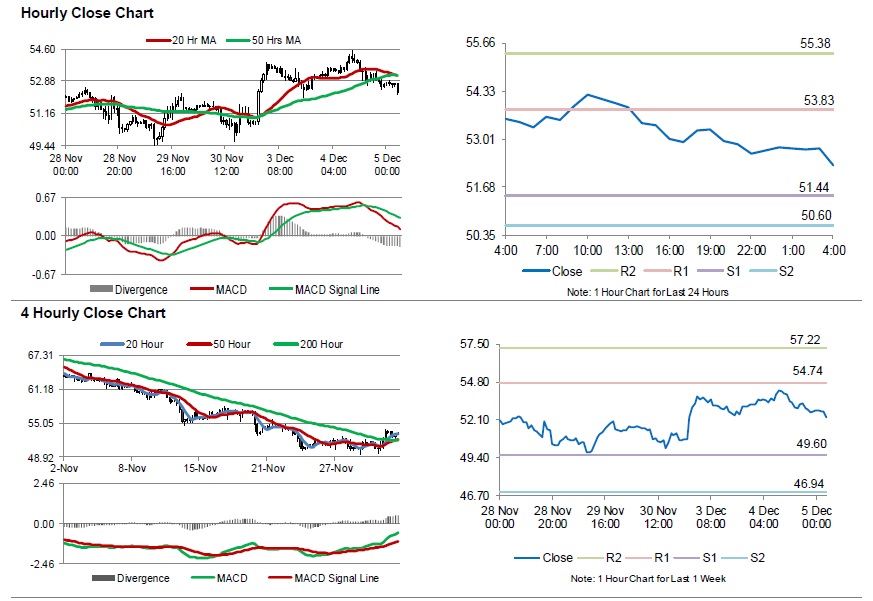
For the 24 hours to 23:00 GMT, Crude Oil declined 0.92% against the USD and closed at USD52.69 per barrel, after the American Petroleum Institute (API) reported that US crude oil inventories climbed by 5.4 million barrels to 448.2 million barrels in the week ended 30 November.
In the Asian session, at GMT0400, the pair is trading at 52.27, with oil trading 0.80% lower against the USD from yesterday's close.
The pair is expected to find support at 51.44, and a fall through could take it to the next support level of 50.60. The pair is expected to find its first resistance at 53.83, and a rise through could take it to the next resistance level of 55.38.
Crude oil is trading below its 20 Hr and 50 Hr moving averages.
EUR/CHF Daily Outlook
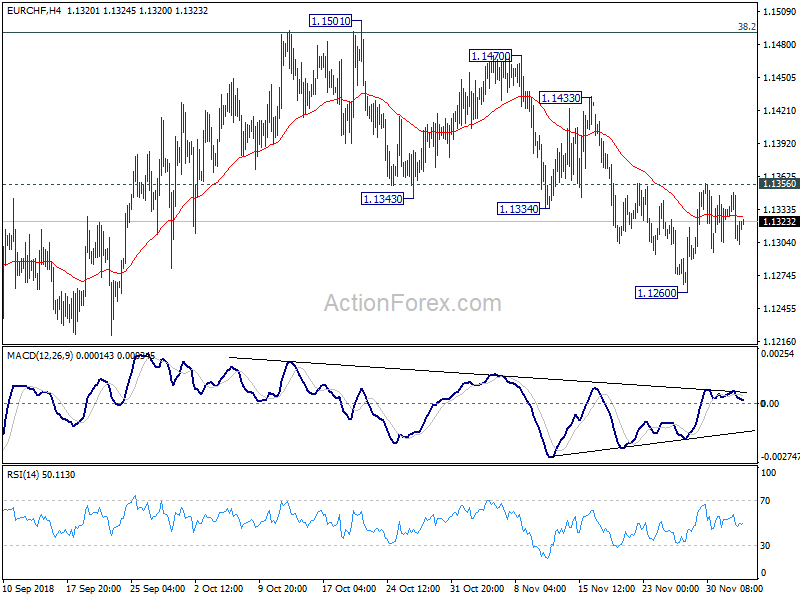
Daily Pivots: (S1) 1.1297; (P) 1.1324; (R1) 1.1342; More...
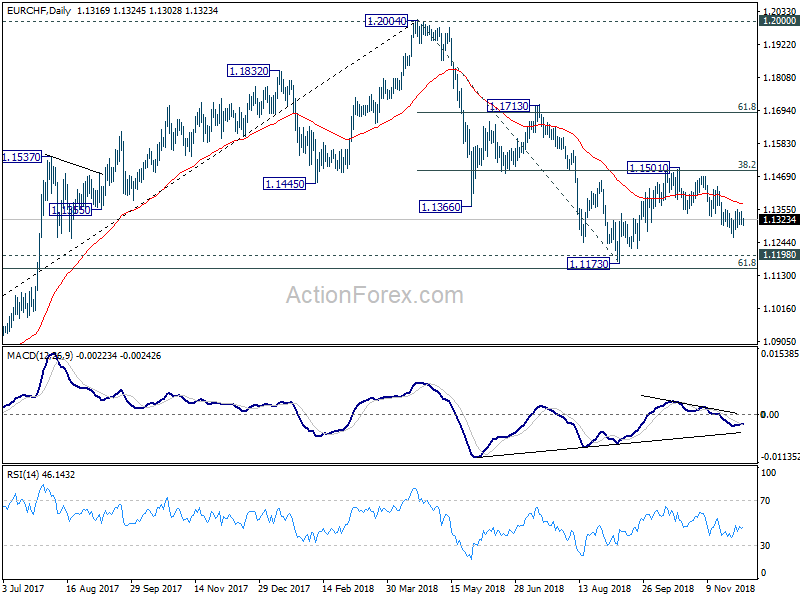
Intraday bias in EUR/CHF remains neutral for the moment. And, with 1.1356 minor resistance intact, another fall is expected in the cross. On the downside, break of 1.1260 will extend the decline from 1.1501 towards 1.1173 low. Nevertheless, on the upside, firm break of 1.1356 resistance will argue that the pull back from 1.1501 has completed at 1.1260. In that case, intraday bias will be turned back to the upside for 1.1501 instead.
In the bigger picture, price actions from 1.2004 medium term top is seen as a correction only. Downside should be contained by support zone of 1.1198 (2016 high) and 61.8% retracement of 1.0629 to 1.2004 at 1.1154 to complete it and bring rebound. A break of 1.2 key resistance is still expected in the medium term long term. However, sustained break of the mentioned support zone will mark reversal of the long term trend. In that case, 1.0629 key support will be back into focus.
EUR/USD Daily Outlook
Daily Pivots: (S1) 1.1300; (P) 1.1361; (R1) 1.1403; More.....
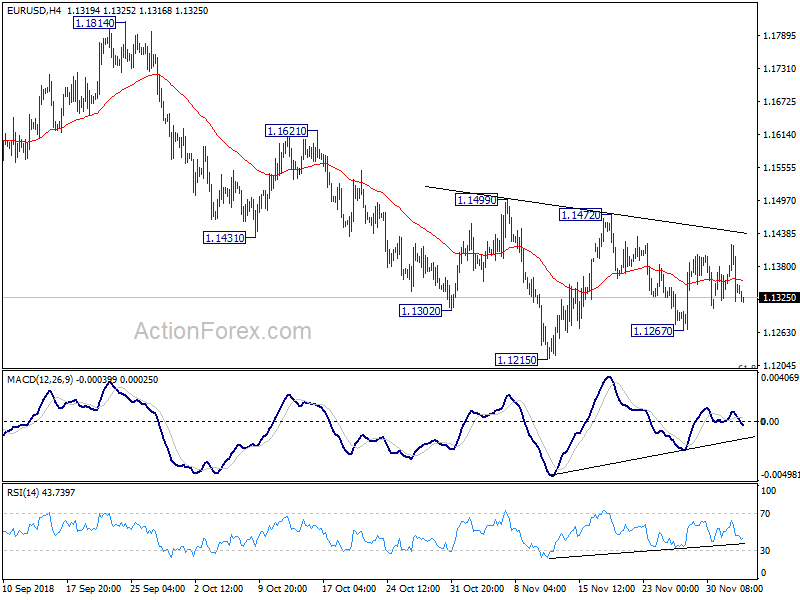
No change in EUR/USD's outlook as it's staying in range of 1.1267/1472. Intraday bias remains for now. As long as 1.1472 resistance holds, deeper decline is expected in the pair. On the downside, break of 1.1267 will target 1.1215 low first. Firm break there will resume larger down trend from 1.2555 for 1.1186 fibonacci level next. However, considering bullish convergence condition in daily MACD, firm break of 1.1472 will be suggest medium term bottoming and turn outlook bullish for 1.1814 resistance instead.
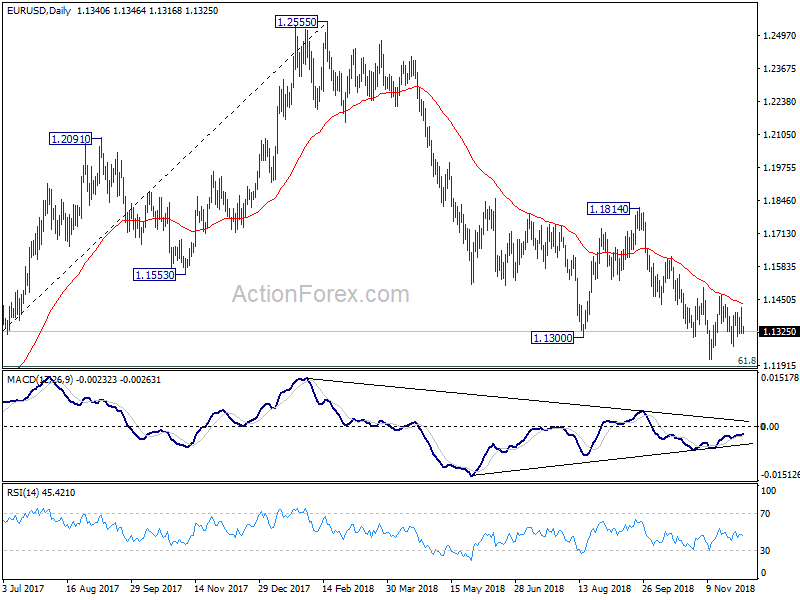
In the bigger picture, as long as 1.1814 resistance holds, down trend down trend from 1.2555 medium term top is still in progress and should target 61.8% retracement of 1.0339 (2017 low) to 1.2555 at 1.1186 next. Sustained break there will pave the way to retest 1.0339. However, break of 1.1814 will confirm completion of such down trend and turn medium term outlook bullish.
GBP/USD Daily Outlook
Daily Pivots: (S1) 1.2636; (P) 1.2738; (R1) 1.2817; More...
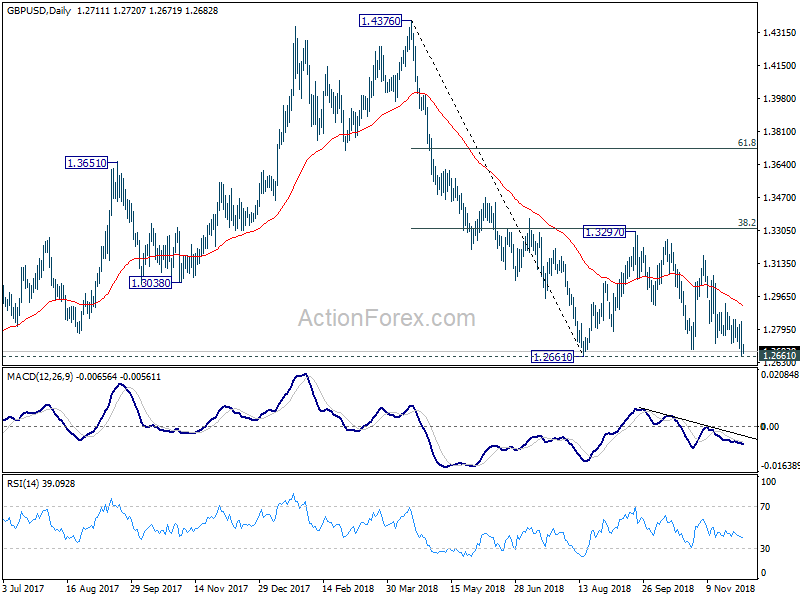
GBP/USD drops again after brief recovery and intraday bias is back on the downside. Sustained break of 1.2661 low will resume larger down trend from 1.4376. Next target will be 1.1946 low. On the upside, break of 1.2927 will extend the consolidation from 1.26661 with another rise. But even in case of strong rebound, upside should be limited by 1.3316 fibonacci level to bring down trend resumption eventually.
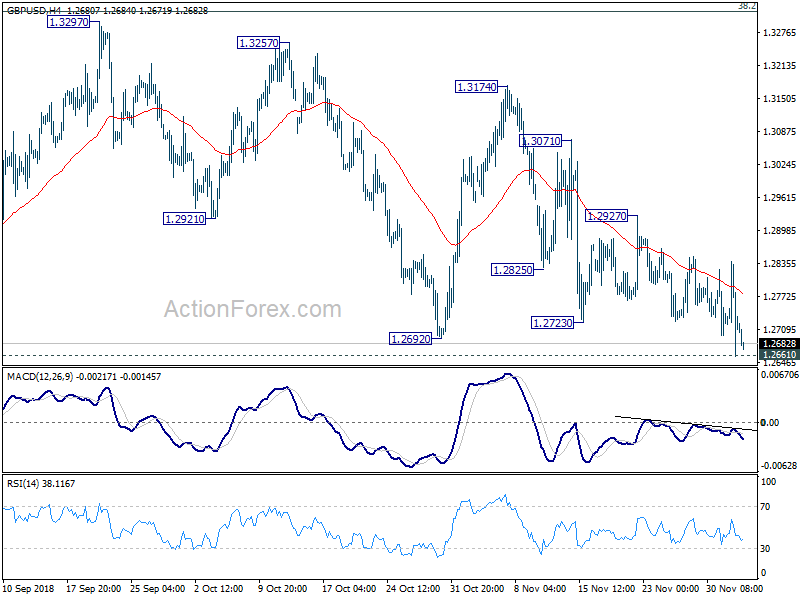
In the bigger picture, whole medium term rebound from 1.1946 (2016 low) should have completed at 1.4376 already, after rejection from 55 month EMA. The structure and momentum of the fall from 1.4376 argues that it's resuming long term down trend. And this will be the preferred case as long as 38.2% retracement of 1.4376 to 1.2661 at 1.3316 holds. However, firm break of 1.3316 would bring stronger rebound to 61.8% retracement at 1.3721. And, the eventual depth of the fall from 1.4376, and the chance of hitting 1.1946 low, will depend on the strength of the interim corrective rebound from 1.2661.
USD/CHF Daily Outlook
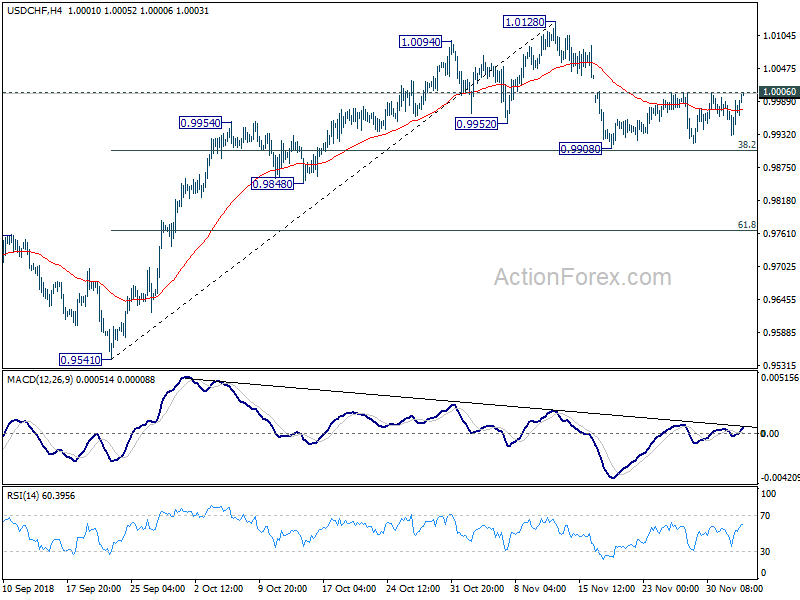
Daily Pivots: (S1) 0.9939; (P) 0.9965; (R1) 1.0000; More...
USD/CHF recovers again but it's still staying below 1.0006 minor resistance. Intraday bias remains neutral first. On the upside, break of 1.0006 will argue that the pull back from 1.0128 has completed. Intraday bias will be turned back to the upside for retesting 1.1028. On the downside, break of 38.2% retracement of 0.9541 to 1.0128 at 0.9904 will resume the fall from 1.0128 to 0.9848 key support level. Break there will indicate near term reversal and target 61.8% at 0.9765.
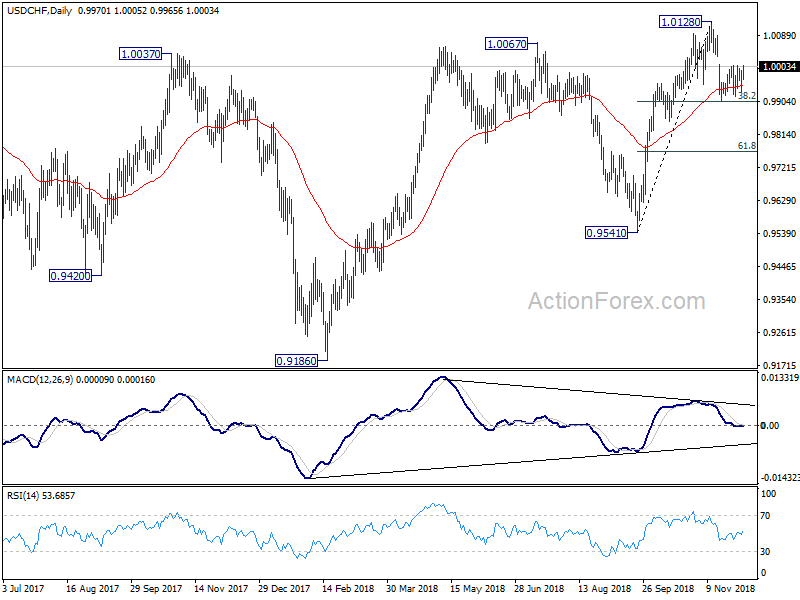
In the bigger picture, rise from 0.9541 could have topped at 1.0128. But as long as 0.9541 support holds, we'd still expect rise from 0.9186 to resume at a later stage. Break of 1.0128 will target 1.0342 key resistance. However, break of 0.9514 will pave the way back to 0.9186 low.
USD/JPY Daily Outlook
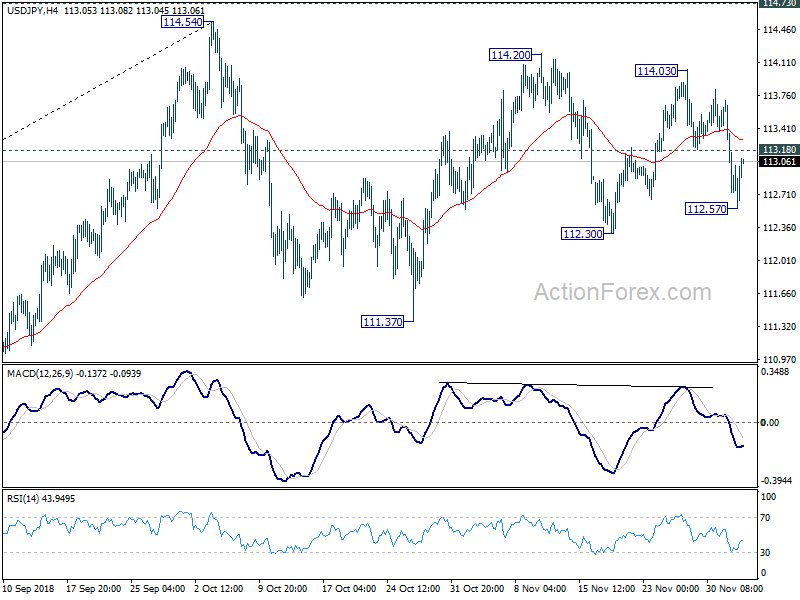
Daily Pivots: (S1) 112.35; (P) 113.01; (R1) 113.44; More..
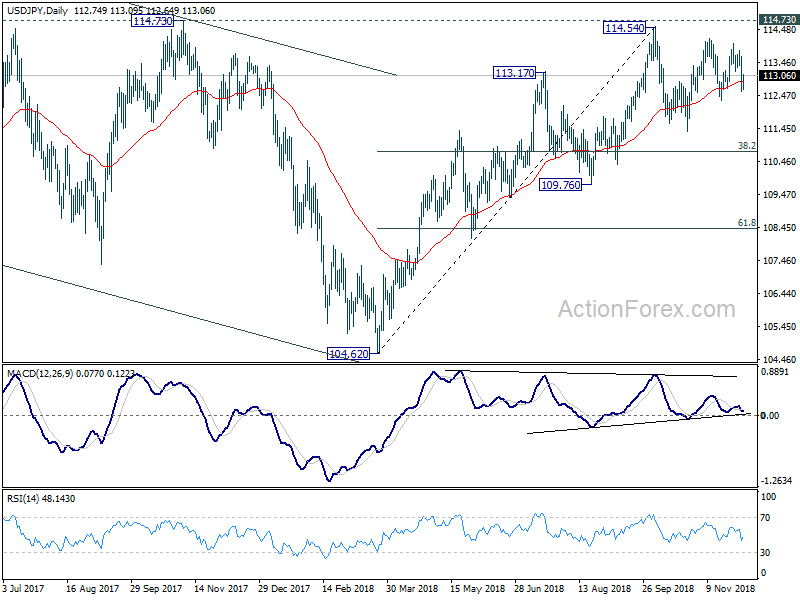
USD/JPY recovers after dipping to 112.57. But with 113.18 support turned resistance intact, deeper fall is still in favor. On the downside, below 112.57 will target 112.30 first. Break will target 111.37 and possibly below. On the upside, above 113.18 will turn bias back to the upside for 114.03 resistance first. Overall, price actions from 114.54 are seen as a consolidation pattern. Hence, even in case of deep decline, downside should be contained by 38.2% retracement of 104.62 to 114.54 at 110.75 to bring rebound. Larger rise from 104.62 is expected to resume later.
In the bigger picture, corrective fall from 118.65 (2016 high) should have completed with three waves down to 104.62. Decisive break of 114.73 resistance will likely resume whole rally from 98.97 (2016 low) to 100% projection of 98.97 to 118.65 from 104.62 at 124.30, which is reasonably close to 125.85 (2015 high). This will stay as the preferred case as long as 109.76 support holds. However, decisive break of 109.76 will dampen this bullish view and turns outlook mixed again.