

Sample Category Title
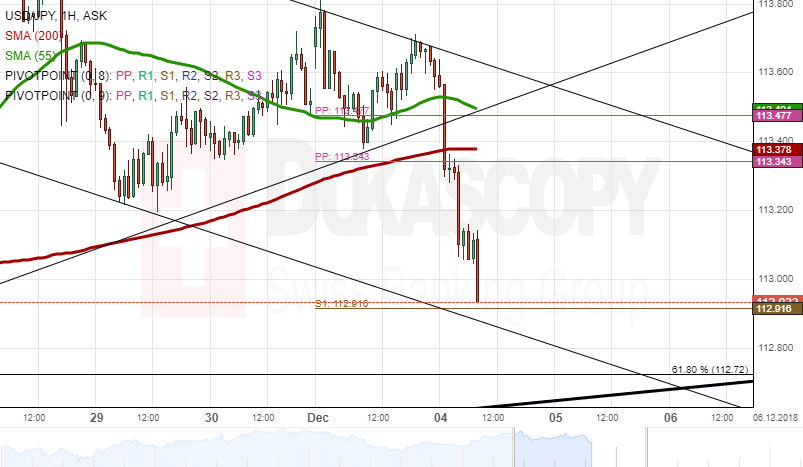
USD/JPY Analysis: Trades Below Monthly PP
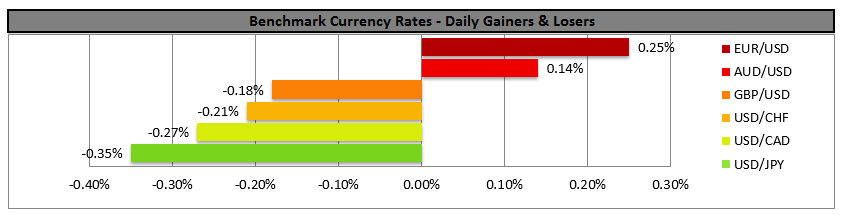
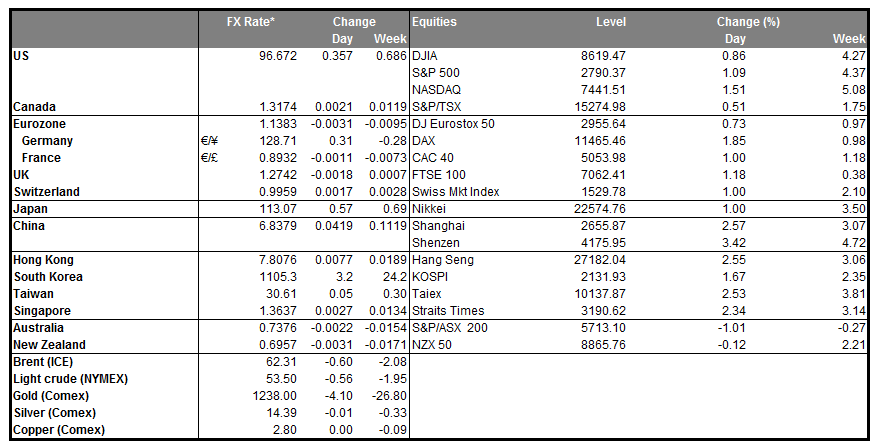
During Monday's trading session, the currency exchange rate was supported by the 55-hour SMA to end the trading session at the 113.55 mark. During Tuesday's morning hours, the US Dollar depreciated by 0.35% to trade at the 113.12 mark.
In regards to the near-term future, most likely, the US Dollar will trade sideways to stay at the freshly drawn trend line. It is expected that the currency exchange pair will be trading below the monthly PP at 113.34 to stay at the 113.00 level during the day.
On the other side, the US Dollar could pass through the support of the freshly drawn pattern line to trade towards the weekly S1 at the 112.91 mark.
XAU/USD Analysis: Will Meet Monthly R1
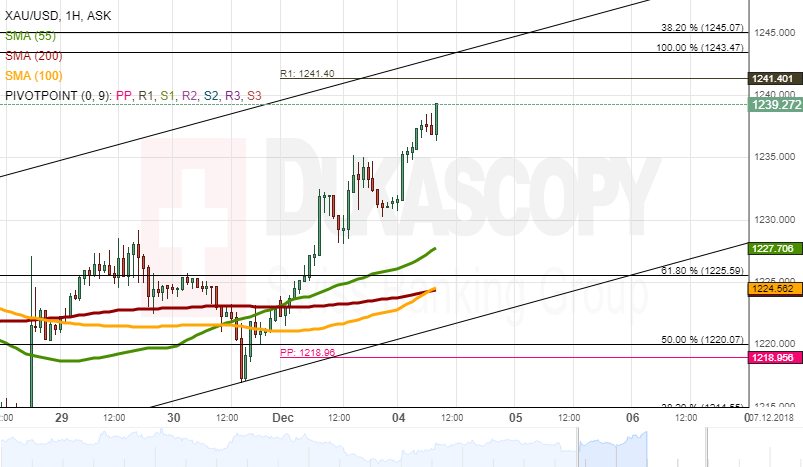
During Monday's trading session, the yellow metal kept surging towards the monthly R1 at 1,241.40 to end the trading session at the 1,230.70 mark. On Tuesday morning, the yellow metal was trading at the 1,237.47 mark.
In regards to the near-term future, most likely, the yellow metal will be retraced by the monthly R1 at 1,241.40 to push the gold to trade sideways during the trading session on Tuesday.
However, the gold could depreciate towards the 61.80% Fibonacci retracement level at the 1,225.59 due to a lack of any support level near the currency exchange pair.
RBA Remains On Hold, Aud Starts To Rise
RBA remained on hold at +1.50% as was widely expected and the AUD initially had little reaction, however later it started to rise. The accompanying statement kept the outlook for employment positive and assessed the Australian economy as performing well, with the GDP expected to average around 3.5% yoy in 2018. Interestingly enough, the bank projects a gradual acceleration of the inflation rate, with the central scenario being for it to reach 2.25% yoy in 2019. Also at the same time, it notes that the global economic expansion is continuing however there are signs of a slowdown in global trade, stemming from trade tensions. Given that the next RBA meeting is scheduled well into 2019, we expect the AUD to remain data driven and trade related in the near future.
AUD/USD had little reaction at the release of RBA's interest rate decision, but technically, the fact that it clearly broke the 0.7380 (S1) resistance line (now turned to support), could create hopes for the pair to rise further. We could see the pair continuing to rise should the USD side of the pair continue to weaken. Please note though, that the RSI indicator in the 4 hour chart, is nearing the reading of 70. Should the bulls dictate the pair's direction, we could see it breaking the 0.7415 (R1) resistance level and aim for the 0.7485 (R2) resistance hurdle. On the other hand, should the bears take over, we could see it breaking the 0.7360 (S1) and aiming for the 0.7315 (S2).
USD weakens as US bond yields fall
The USD weakened during the Asian session today as US treasury yields were reported to have fallen. As the US 10 year bond yields are dropping, analysts are focusing on a possible inversion of the yield curve especially the 2-10 year yield curve, as such an inversion could be an early sign of a possible recession for the US. Analysts note that falling US bond yields are a negative for the USD and that currently are near crucial technical support levels, which if broken could provide further pressure on the greenback. We expect volatility for the USD in the coming week as the US employment report release draws near, while on the other hand the effect of the temporary truce agreed between US president Trump and Chinese president Xi continues to affect its direction.
USD/JPY dropped during today's Asian session, breaking the 113.25 (R1) support level (now turned to resistance). We could see the pair continuing its drop should the USD side continue to weaken during the day. If the pair remains under the selling interest of the market, we could see it breaking the 112.72 (S1) support line, while if the market favors the pair's long positions we could pair breaking the 113.25 (R1) support line and aim for the 113.95 (R2) resistance level.
In today's other economic highlights:
In today's European session, we get UK's Construction PMI for November, however there may also other events affecting the pound's direction today. Bank of England Governor Mark Carney speaks to parliament's Treasury Committee about the central bank's report on what Brexit might mean for Britain's economy. Derided as "Project Hysteria" by Brexit supporters, Carney may be under pressure.
AUD/USD H4
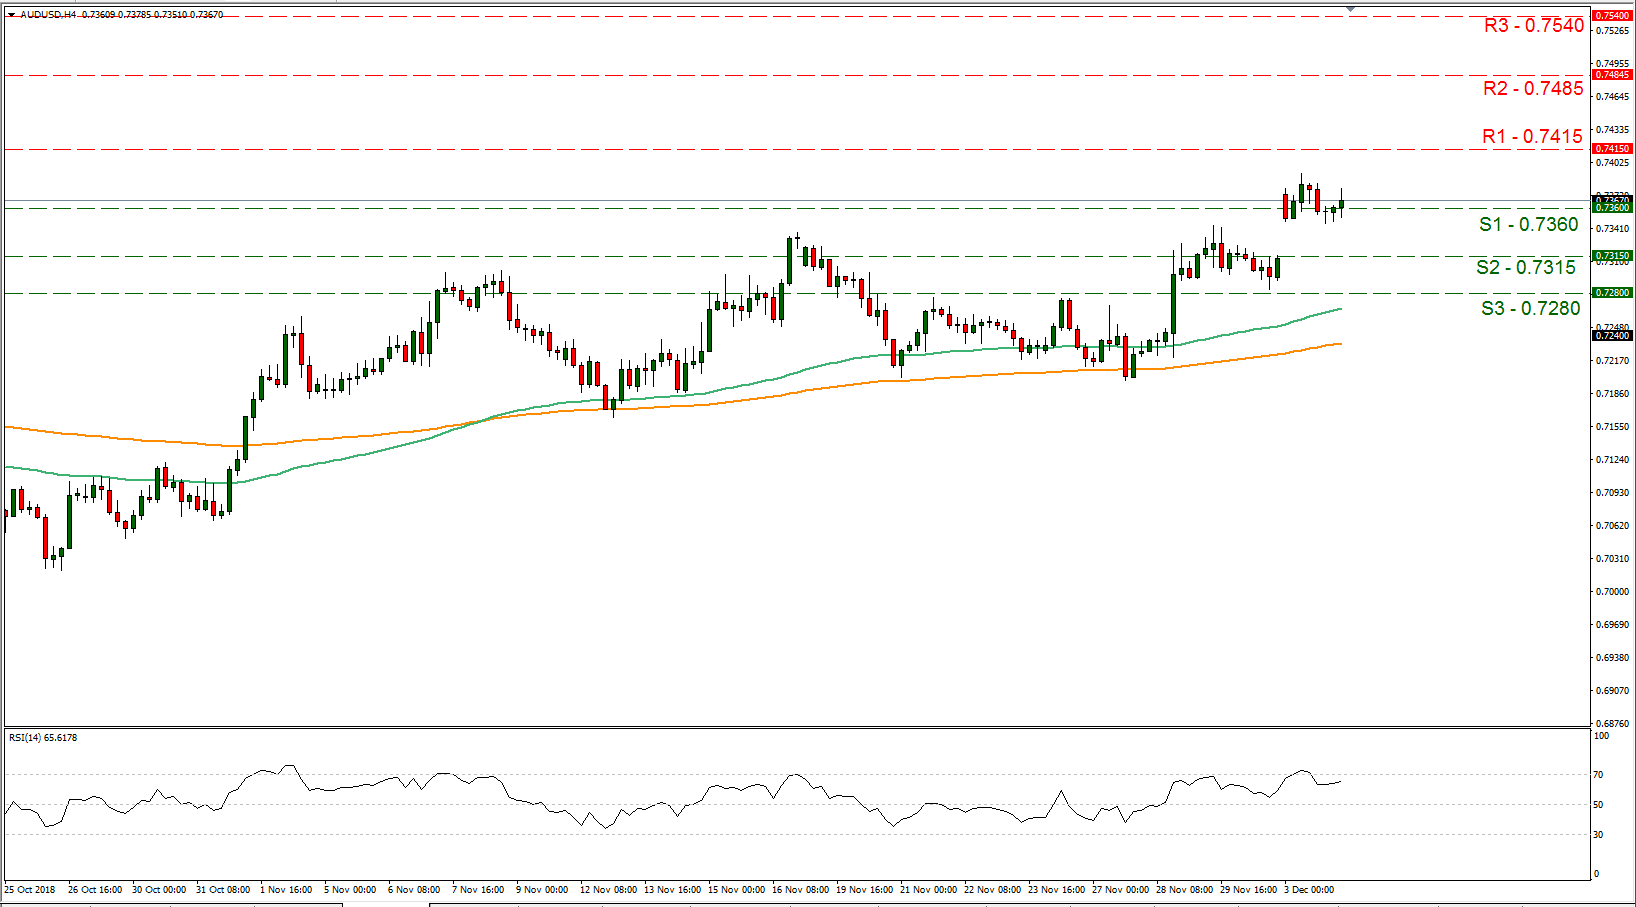
Support: 0.7360(S1), 0.7315 (S2), 0.7280 (S3)
Resistance: 0.7415 (R1), 0.7485 (R2), 0.7540 (R3)
USD/JPY H4
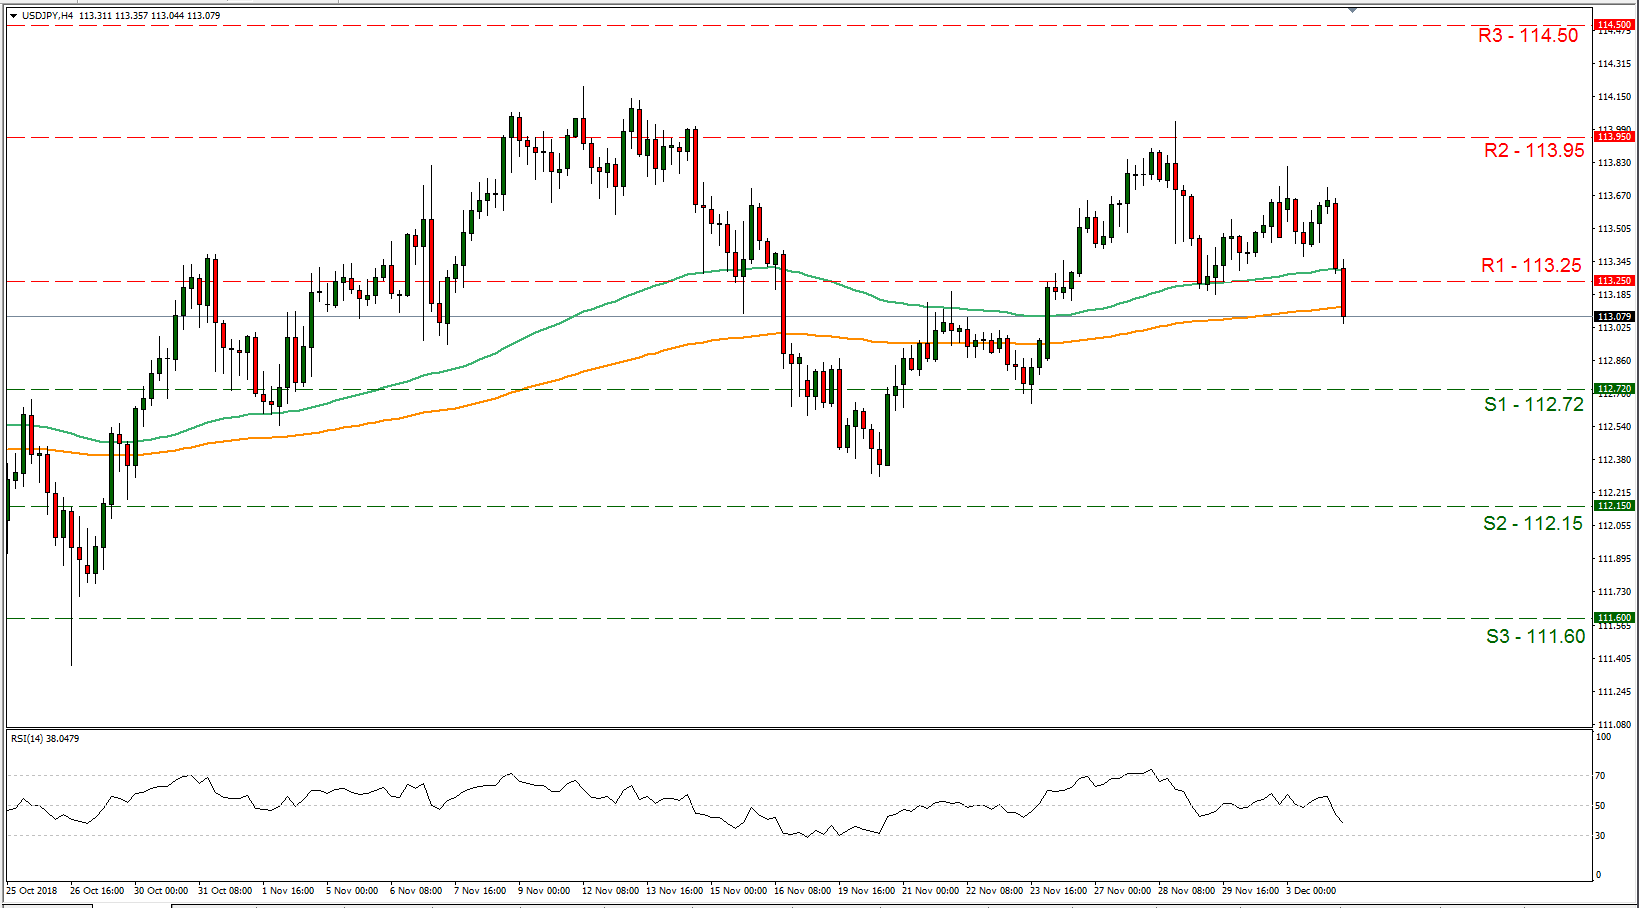
Support: 112.72 (S1), 112.15 (S2), 111.60 (S3)
Resistance: 113.25 (R1), 113.95 (R2), 114.50 (R3)
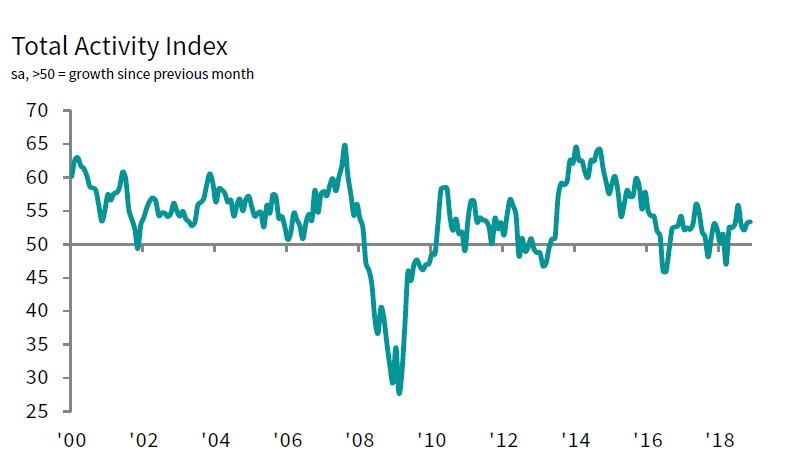
UK PMI construction rose to 53.4, job accelerates with upward pressure on wages
UK PMI construction rose to 53.4 in November, up from 53.2 and beat expectation of 52.5. That's also the highest level in four months. Markit noted there is solid expansion of overall construction output. Residential work reclaims its place as best performing area of construction activity. Job creation accelerates to its fastest since December 2015.
Tim Moore, Economics Associate Director at IHS Markit, which compiles the survey:
"November data indicates that the UK construction sector remains in expansion mode, with resilient business activity trends seen for housing, commercial and civil engineering activity. The latest overall rise in construction output was the fastest since July, helped by a stronger contribution to growth from house building activity.
"Higher levels of new work were recorded for the sixth month running in November, which resulted in a robust and accelerated rise in staffing numbers. The latest upturn in employment was the fastest for almost three years. A number of construction firms noted that greater demand for staff had led to upward pressure on salaries in November.
"Business confidence regarding the year ahead outlook for construction work picked up from October's recent low, but remained weaker than seen on average in the first half of 2018. Survey respondents widely commented that Brexit-related uncertainty had held back business optimism in November."
Also released in European session, Swiss CPI dropped -0.3% mom, rose 0.9% yoy in November, versus expectation of -0.1% mom, 1.1% yoy. Eurozone PPI rose 0.8% mom, 4.9% yoy in October, above expectation of 0.5% mom, 4.5% yoy.
The Analytical Overview Of The Main Currency Pairs
The EUR/USD currency pair
Technical indicators of the currency pair:
Prev Open: 1.13499
Open: 1.13523
% chg. over the last day: +0.11
Day's range: 1.13516 – 1.13982
52 wk range: 1.1299 – 1.2557
On the EUR/USD currency pair, the bullish sentiment is observed. At the moment, quotes are consolidating. The key support and resistance levels are 1.13650 and 1.14000, respectively. Investors continue to evaluate the outcome of the G20 summit. The single currency is tending to recover. We recommend opening positions from the key levels.
Publication of important economic reports from the US and the eurozone is not planned.
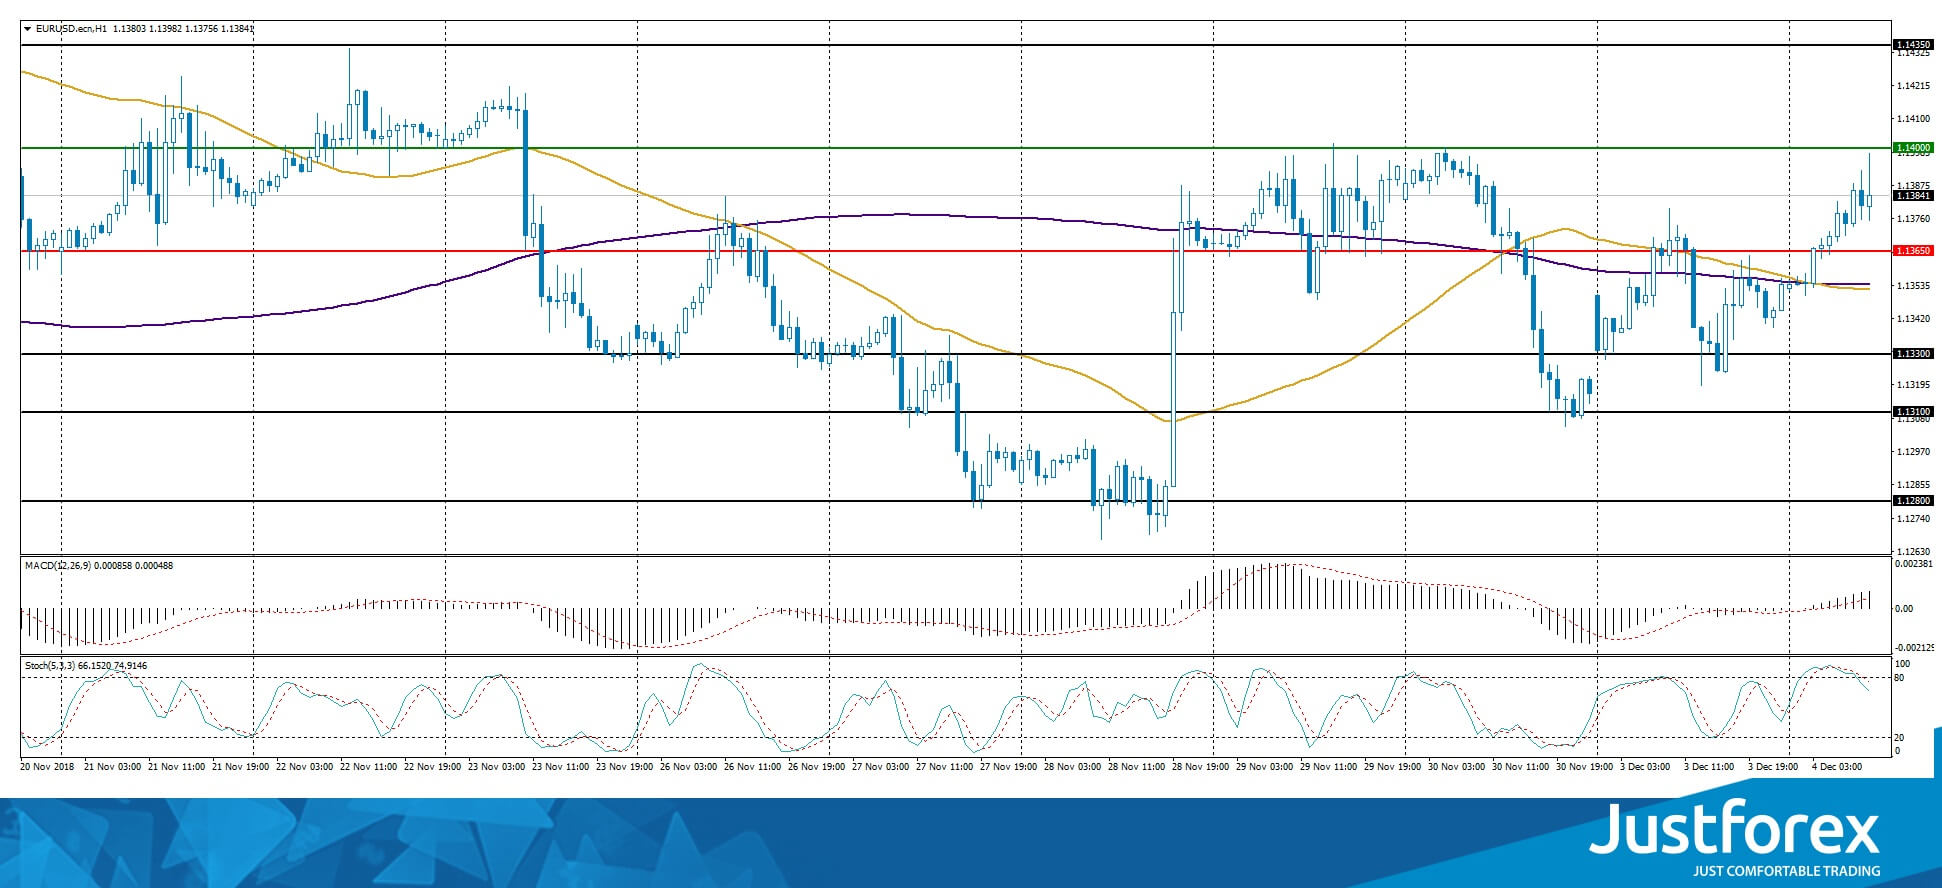
Indicators do not give accurate signals: 50 MA has crossed 200 MA.
The MACD histogram is in the positive zone and above the signal line, which indicates the growth of the EUR/USD quotes.
Stochastic Oscillator has moved from the overbought zone, the %K line is below the %D line, which gives a signal to sell EUR/USD.
Trading recommendations
Support levels: 1.13650, 1.13300, 1.13100
Resistance levels: 1.14000, 1.14350, 1.14500
If the price fixes above the round level of 1.14000, further growth of the EUR/USD currency pair is expected. The movement is tending to 1.14350-1.14500.
An alternative could be a reduction in the EUR/USD quotes to 1.13300-1.13100.
The GBP/USD currency pair
Technical indicators of the currency pair:
Prev Open: 1.27291
Open: 1.27232
% chg. over the last day: -0.21
Day's range: 1.27194 – 1.27868
52 wk range: 1.2662 – 1.4378
The GBP/USD currency pair is traded in the flat. The unidirectional trend is not observed. At the moment, the following key support and resistance levels can be identified: 1.27250 and 1.27750, respectively. Yesterday, positive statistics on economic activity in the UK manufacturing sector was published, which provides additional support to the pound. We recommend opening positions from the key levels. The GBP/USD quotes are tending to grow.
At 11:30 (GMT+2:00) the index of economic activity in the UK construction sector will be published.
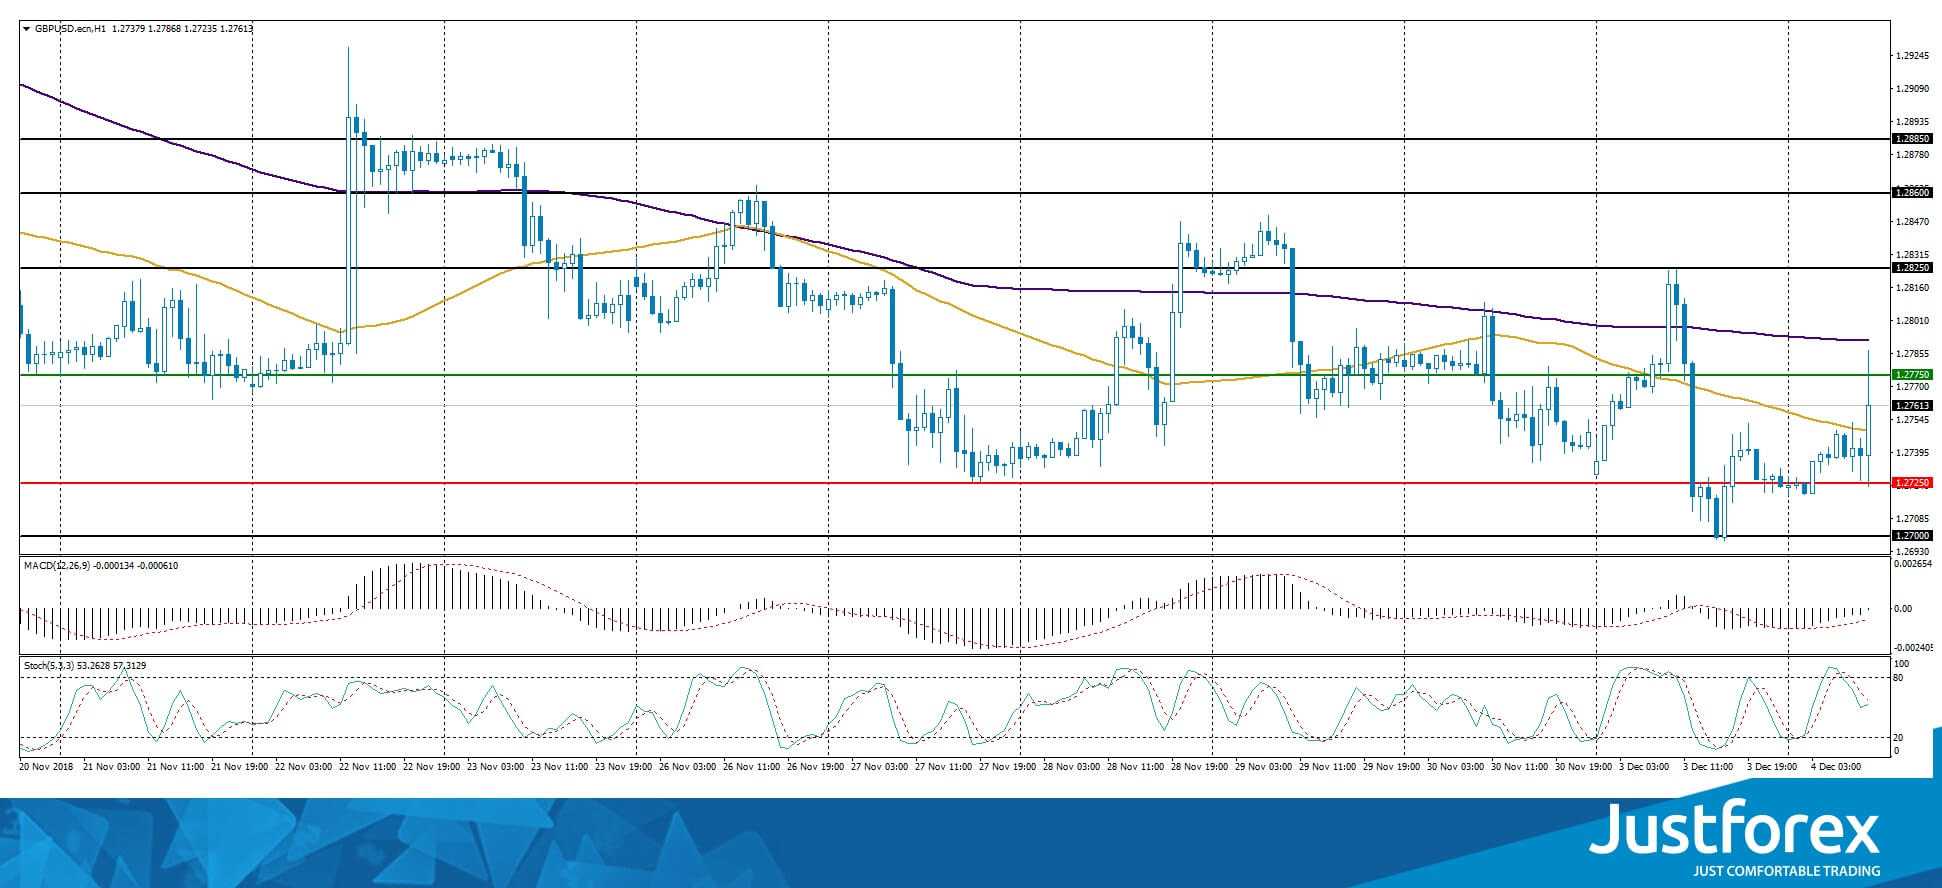
Indicators do not send accurate signals: the price has crossed 50 MA and 200 MA.
The MACD histogram has reached the 0 mark.
Stochastic Oscillator is in the neutral zone, the %K line has crossed the %D line. There are no signals at the moment.
Trading recommendations
Support levels: 1.27250, 1.27000
Resistance levels: 1.27750, 1.28250, 1.28600
If the price fixes above the resistance level of 1.27750, the GBP/USD quotes are expected to grow. The movement is tending to 1.28250-1.28400.
An alternative could be the reduction of the GBP/USD currency pair to the round level of 1.27000.
The USD/CAD currency pair
Technical indicators of the currency pair:
Prev Open: 1.32359
Open: 1.31967
% chg. over the last day: -0.43
Day's range: 1.31693 – 1.32017
52 wk range: 1.2248 – 1.3387
The USD/CAD currency pair is consolidating after aggressive sales during yesterday's trading session. Currently, local support and resistance levels are 1.31650 and 1.31900, respectively. Loonie is supported by a correction in the market of "black gold". The USD/CAD quotes are tending to decline. Positions must be opened from the key levels.
The news feed on the economy of Canada is quite calm.
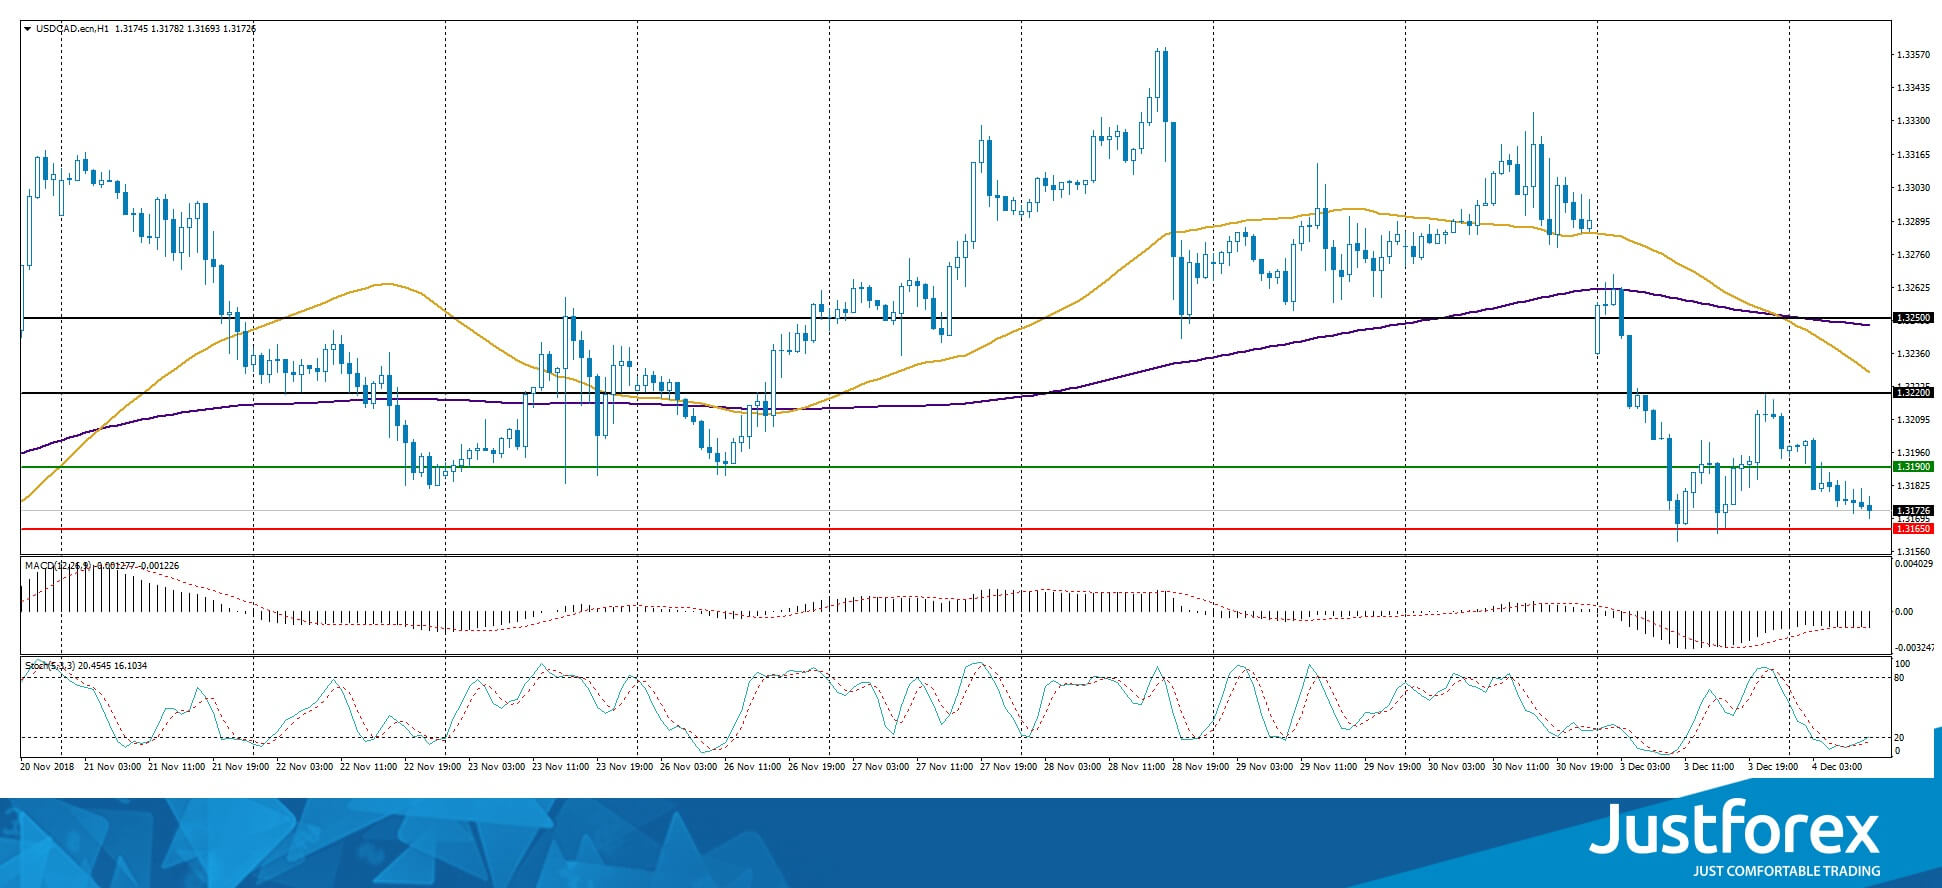
The price has fixed below 50 MA and 200 MA, which indicates the power of sellers.
The MACD histogram is in the negative zone and continues to decline, which gives a strong signal to sell USD/CAD.
The Stochastic Oscillator is in the oversold zone, the %K line has crossed the %D line. There are no signals at the moment.
Trading recommendations
Support levels: 1.31650, 1.31300, 1.31000
Resistance levels: 1.31900, 1.32200, 1.32500
If the price fixes below the support level of 1.31650, a further decline in the USD/CAD quotes is expected. The movement is tending to 1.31300-1.31000.
Alternative option. If the price consolidates above the level of 1.31900, we recommend looking for entry points to the market to open long positions. The movement is tending to 1.32200-1.32400.
The USD/JPY currency pair
Technical indicators of the currency pair:
Prev Open: 113.654
Open: 113.604
% chg. over the last day: -0.16
Day's range: 112.896 – 113.657
52 wk range: 104.56 – 114.74
The USD/JPY currency pair shows a negative trend. Today, the drop in quotes exceeded 70 points. Trading instrument updated local lows. Currently, the key range is 112.900-113.150. The USD/JPY currency pair is tending to decline. We recommend paying attention to the dynamics of the US government bonds yield. Positions must be opened from the key levels.
The news feed on the Japanese economy is calm.
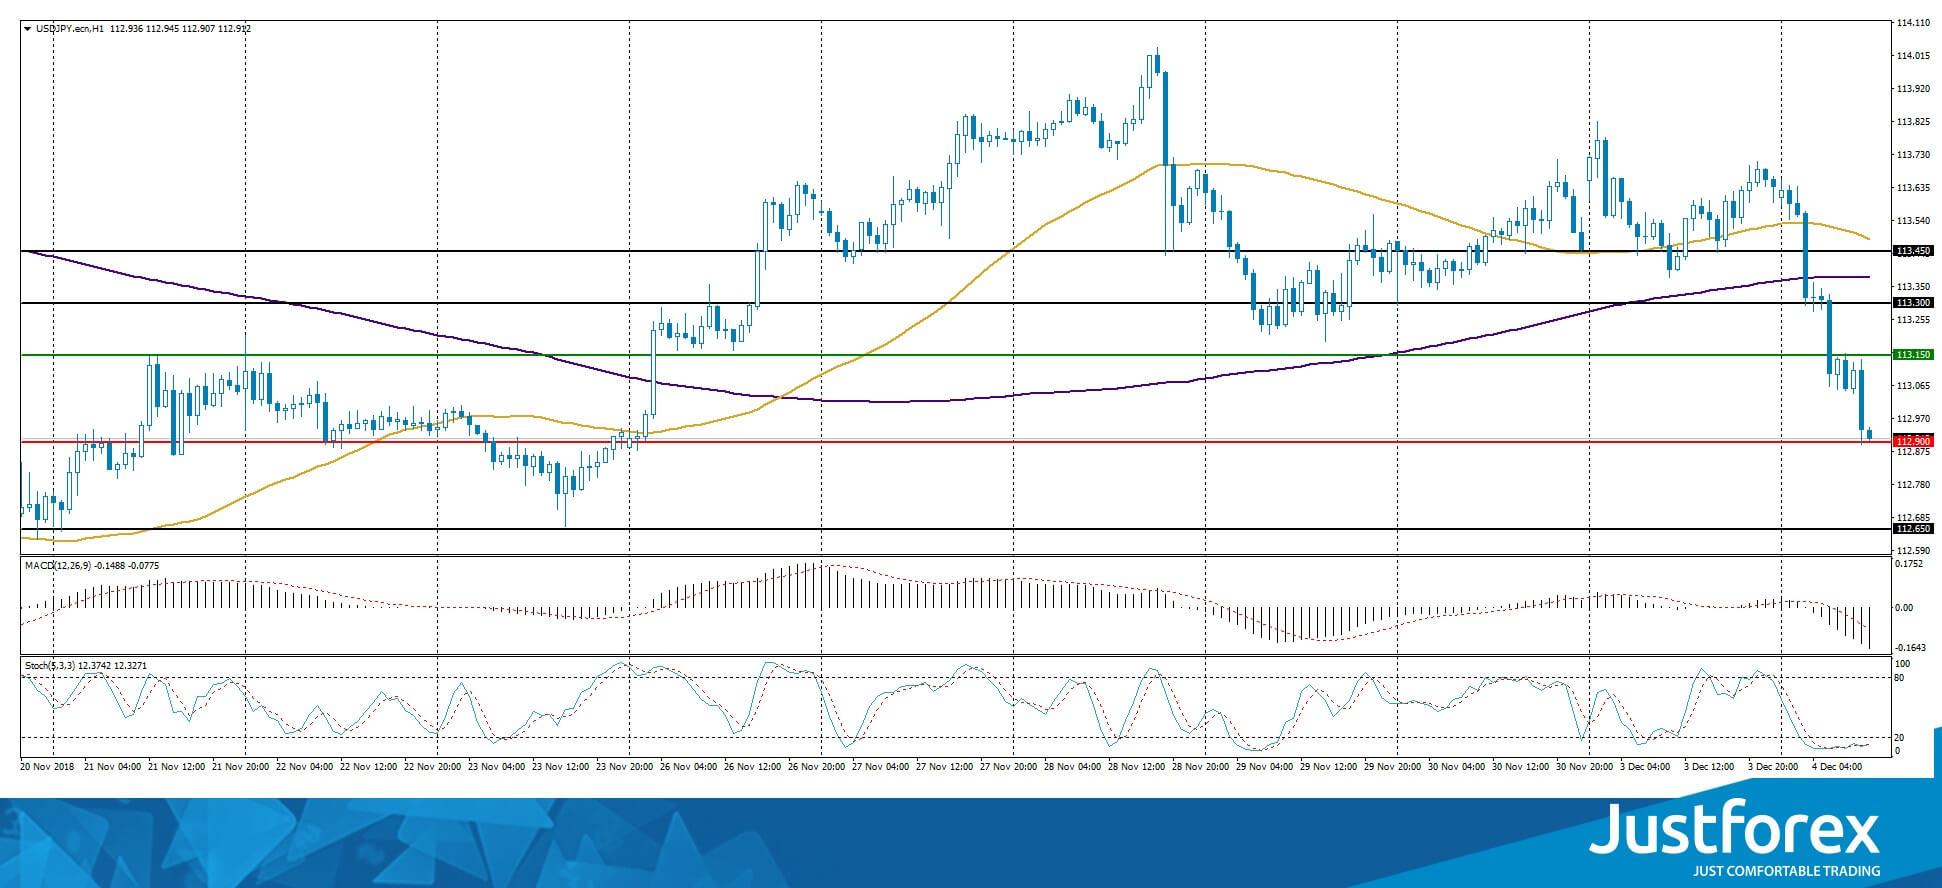
The price has fixed below 50 MA and 200 MA, which indicates the power of the sellers.
The MACD histogram is in the negative zone and below the signal line, which gives a strong signal to sell USD/JPY.
The Stochastic Oscillator is in the oversold zone, the %K line has crossed the %D line. There are no accurate signals.
Trading recommendations
Support levels: 112.900, 112.650
Resistance levels: 113.150, 113.300, 113.450
If the price fixes below the local support of 112.900, a further fall in the USD/JPY currency pair is expected. The movement is tending to 112.650-112.500.
An alternative could be the growth of the USD/JPY quotes to 113.250-113.400.
AUD/JPY 4H Chart: Remains Near Resistance Cluster
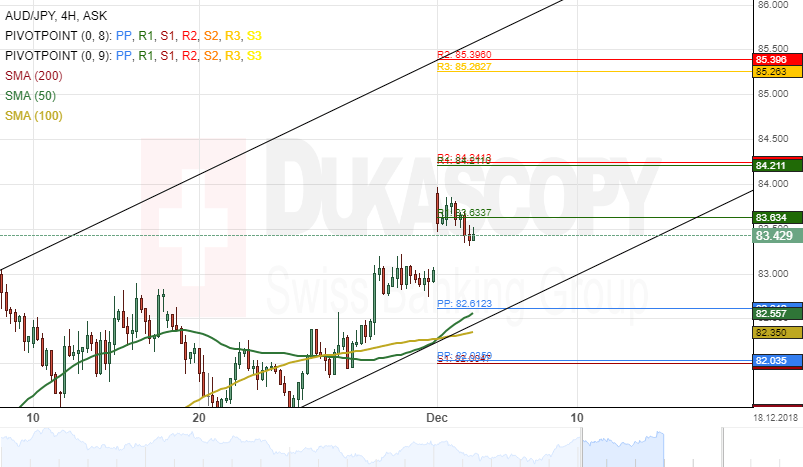
Upside risks have been dominating the Australian Dollar versus the Japanese Yen since October 26, after the currency pair made a U-turn from the lower boundary of a long-term descending channel pattern at 78.67.
The exchange rate was trading near a resistance cluster formed by the combination of the weekly and the monthly PPs at 84.21 during the first part of Tuesday's trading session.
If the pair passes the resistance level, it could aim for the upper boundary of the long-term ascending channel at 85.39 during the following trading sessions.
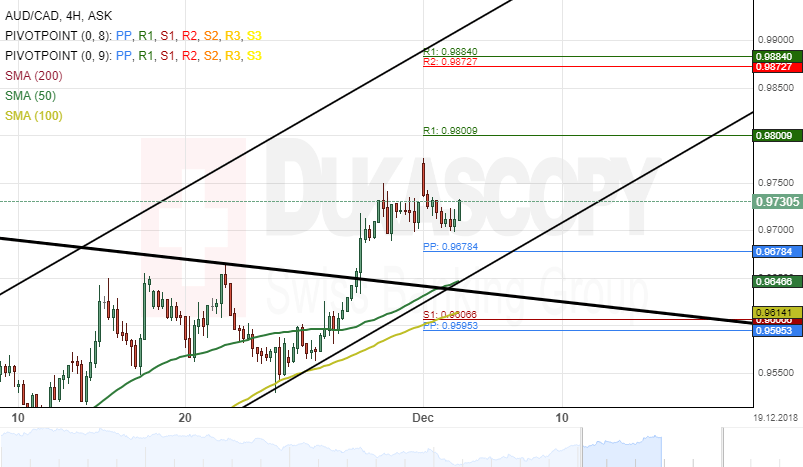
AUD/CAD 4H Chart: Targets At 0.9884
The Australian Dollar has been appreciating in an ascending channel pattern against the Canadian Dollar since October 8 after the currency pair reversed from the bottom border of a dominant descending channel at 0.9100.
The exchange rate broke the dominant descending channel pattern a few days ago. Currently, the pair is trading above a traditional weekly PP at 0.9678.
Given that a breakout had occurred, it is likely that the AUD/CAD currency exchange rate would continue to maintain a five-week ascending channel pattern during the following days.
The pair will likely target the upper boundary of the five weeks ascending channel at 0.9884 within this week.
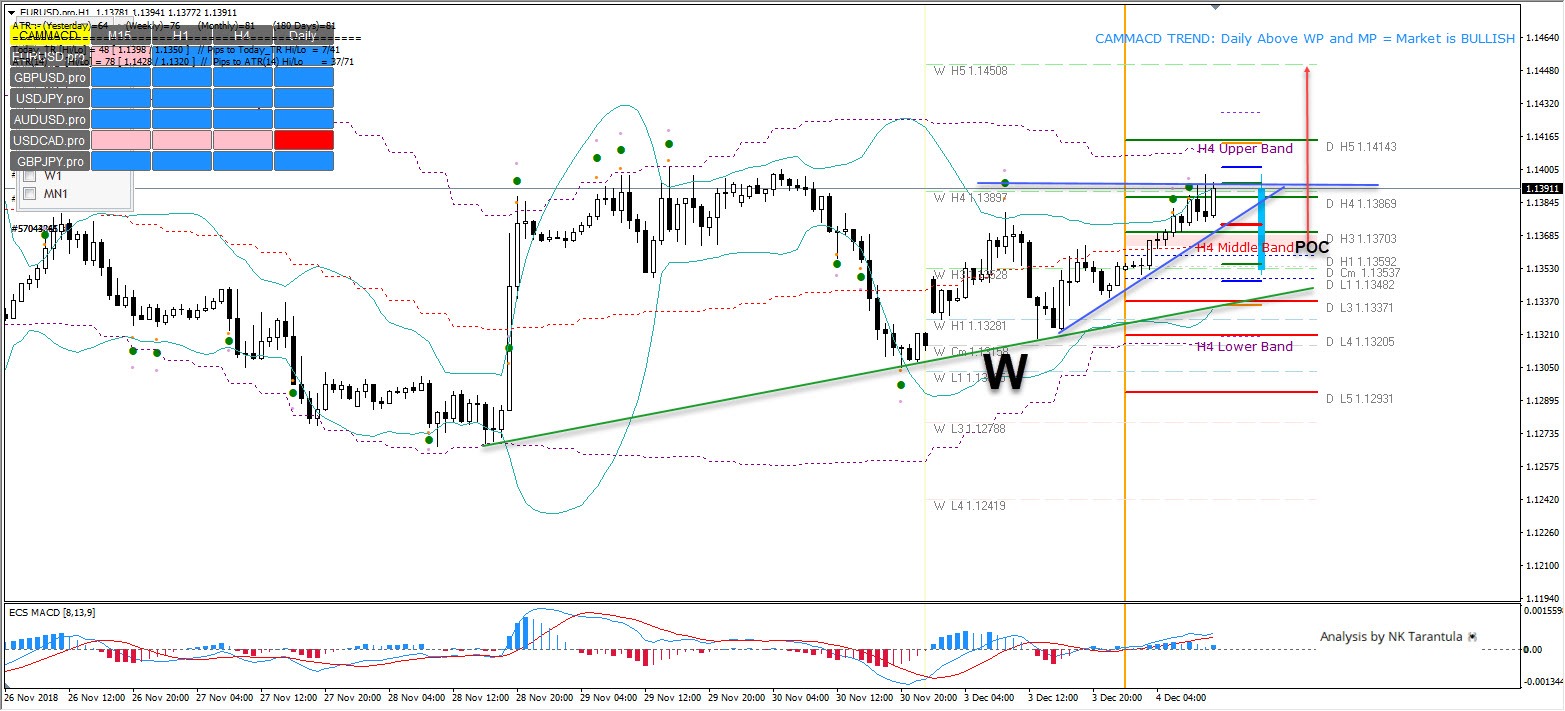
EUR/USD W Pattern Cues For Bullish Break
The EUR/USD is bullish above 1.1395. Pullback towards 1.1370 zone could be corrective and for intraday movement it could be used for buying into dips. Broader picture still shows the range as I explained in my previous analyses, so the targets are 1.1430 and eventually 1.1450 on a strong momentum push and stop triggering. We can also see the W bullish pattern that cues for a continuation to the upside.
Forex Technical Analysis: EUR/USD, USD/JPY, GBP/USD
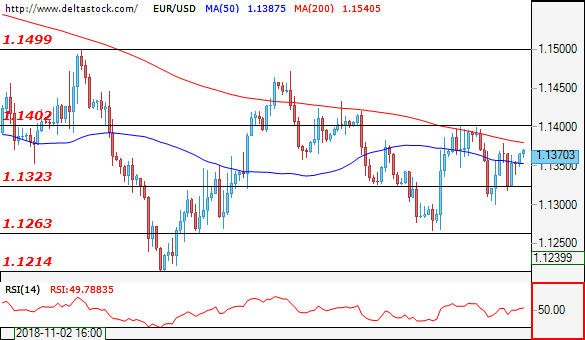
EUR/USD
Current level - 1.1370
We expect the pair to make another attempt to reach 1.14. Breaking this level will open its way toward the next imporant resistance at 1.1470. Initial support in case of an opposite movement is 1.1320.
| Resistance | Support | ||
| intraday | intraweek | intraday | intraweek |
| 1.1360 | 1.1500 | 1.1320 | 1.1200 |
| 1.1420 | 1.1620 | 1.1260 | 1.0850 |
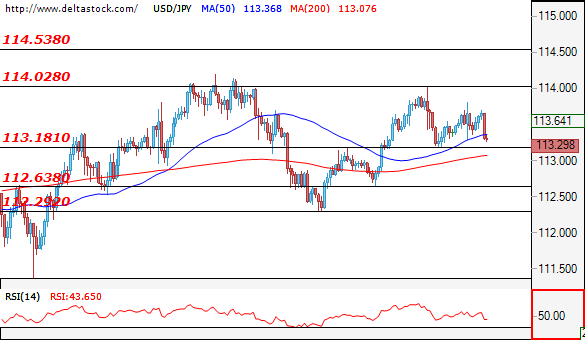
USD/JPY
Current level - 113.29
The pair moves toward a certain test of the the 113.20 support. Breaking below this level will put an end to the range trading of the last few days and will target the next important intraday support at 112.60.
| Resistance | Support | ||
| intraday | intraweek | intraday | intraweek |
| 114.00 | 114.50 | 113.10 | 112.30 |
| 114.20 | 116.20 | 112.60 | 111.60 |
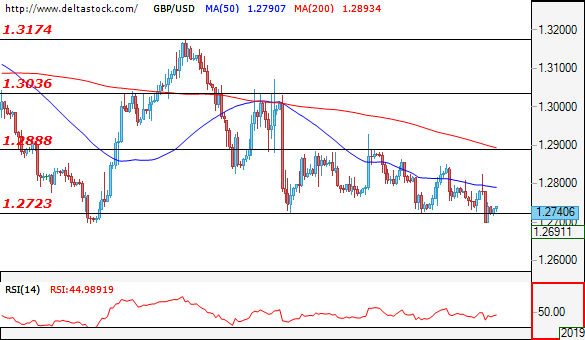
GBP/USD
Current level - 1.2740
The political tensions around the Brexit deal weigh on the pound. We can see a another test and a possible break down of 1.2730 level. This will clear the way to continue the down move to 1.2200 To witness an alternative scenario the pair must break the key resistance at 1.2860 and afterwards 1.3300.
| Resistance | Support | ||
| intraday | intraweek | intraday | intraweek |
| 1.2860 | 1.3250 | 1.2720 | 1.2660 |
| 1.2920 | 1.3440 | 1.2660 | 1.2340 |
Currencies: Dollar Struggles As US Yields Decline Further
Rates: US yield curve sends worrying signal
The US 2yr-5yr and 3yr-5yr yield spreads turned negative for the first time since 2007 with the US 2yr-10yr yield spread setting a new cycle low at 13 bps. The flattening of the curve suggests markets start discounting a turn in the US rate cycle somewhere around 2021. The US 10-yr yield’s break below key support suggests a retracement towards 2.8%.
Currencies: dollar struggles as US yields decline further
Yesterday’s risk rebound failed to give clear directional guidance for USD trading. At the end of the day, the dollar lost only marginal ground. The move continues this morning. A risk-off sentiment doesn’t help the dollar and is counterbalanced by a further decline in US yields. For now, USD weakness prevails despite diffuse signals on global markets
The Sunrise Headlines
- US stock markets opened stronger (>+1%) on the Xi-Trump outcome, but traded sideways afterwards. Asian equities show a reversal of risk sentiment with Japan heavily underperforming, losing over 2%.
- France and Germany renounce EU plans to impose a wider-ranging digital tax on tech companies. Instead both countries agreed to compromise to only tax the European advertising revenues of digital companies at 3%.
- The Reserve Bank of Australia left its policy rate unchanged at a record low of 1.50%. Low income growth and high household debt are reason for caution amid economic strength. Inflation is expected to creep towards target.
- Iranian OPEC Governor Hossein Kazempour Ardebili said that oil prices would further fall unless OPEC and its allies cut output significantly. He added production will need to be reduced by at least 1.4m b/d to prevent oversupply.
- China’s central bank Governor Yi Gang said the bank will keep monetary policy flexible and adjust it appropriately according to changes in China’s economic situation. China’s economic growth has cooled to the weakest pace since 2008.
- US President Trump appoints Trade Representative Robert Lighthizer to lead the negotiations in the China trade talks. Lighthizer is known as a hard-liner and a long-time China trade critic, proving the US will pursue a tough stance.
- Today’s economic calendar contains the Markit/CIPS construction PMI in the UK and the producer inflation for the EMU. BoE Governor Carney defends Brexit scenario’s in Parliament, while Fed’s Williams holds a press briefing
Currencies: Dollar Struggles As US Yields Decline Further
USD in the defensive as global sentiment wobbles
The risk rally in the wake of the US-China trade truce turned out a bit different across markets yesterday. Equities showed good gains, but, the reaction of core bonds and of the dollar was less straightforward. A rise in US and German yields was soon reversed. EUR/USD, a traditional beneficiary of a risk-rally, also opened stronger but couldn’t maintain the early gain and entered an erratic-like trading pattern. The pair closed the day at 1.1354 with no clear directional trend. USD/JPY also showed an indecisive pattern to finish the day at 113.66. EMU data (PMI’s) and the US manufacturing ISM were not too bad or even stronger than expected (ISM), but were no lasting support for yields or the dollar. Overnight, the positive sentiment ebbed further. Asian indices show modest losses with Japan underperforming (-2.0% +). Remarkably, the dollar fails to profit from the risk-off. A decline in US yields (and narrowing of USGerman interest rate differential at the long end of the curve) might be part of the explanation. The further rise of the yuan is alos striking. The dollar is also losing ground against the yen (USD/JPY low 113 area) and against the euro (EUR/USD 1.1375). The Reserve bank of Australia left its policy rate/policy assessment unchanged. AUD/USD is holding in the 0.7375 area. Today, there no data with market moving potential in the US or in Europe. Fed Williams will hold a press briefing. US equity futures suggest that yesterday’s risk rally might already run into resistance. Markets doubt that the US-China trade truce will be a gamechanger for US/global growth goging forward. At least for now, the decline in core yields is weighing more on the dollar and on the likes of the euro and/or the yen. We are not convinced that this trading pattern should last. However, for now, USD sentiment looks fragile. We started the week with a cautious positive EUR/USD. This trend apparently continues today, but we are puzzled on the drivers of the move. For now, we assume the 1.15/1.1621 range top wil hold short-term.
EUR/GBP again developed an erratic like intraday trading pattern. The UK manufacturing PMI was stronger than expected at 53.1, but didn’t help sterling. Persistent political uncertainty ahead of the key Brexit vote next week kept sterling in the defensive. Today, the (potentially tumultuous) debate in parliament will continue. We see no trigger for uncertainty on sterling to easy anytime soon. We continue to avoid sterling long exposure
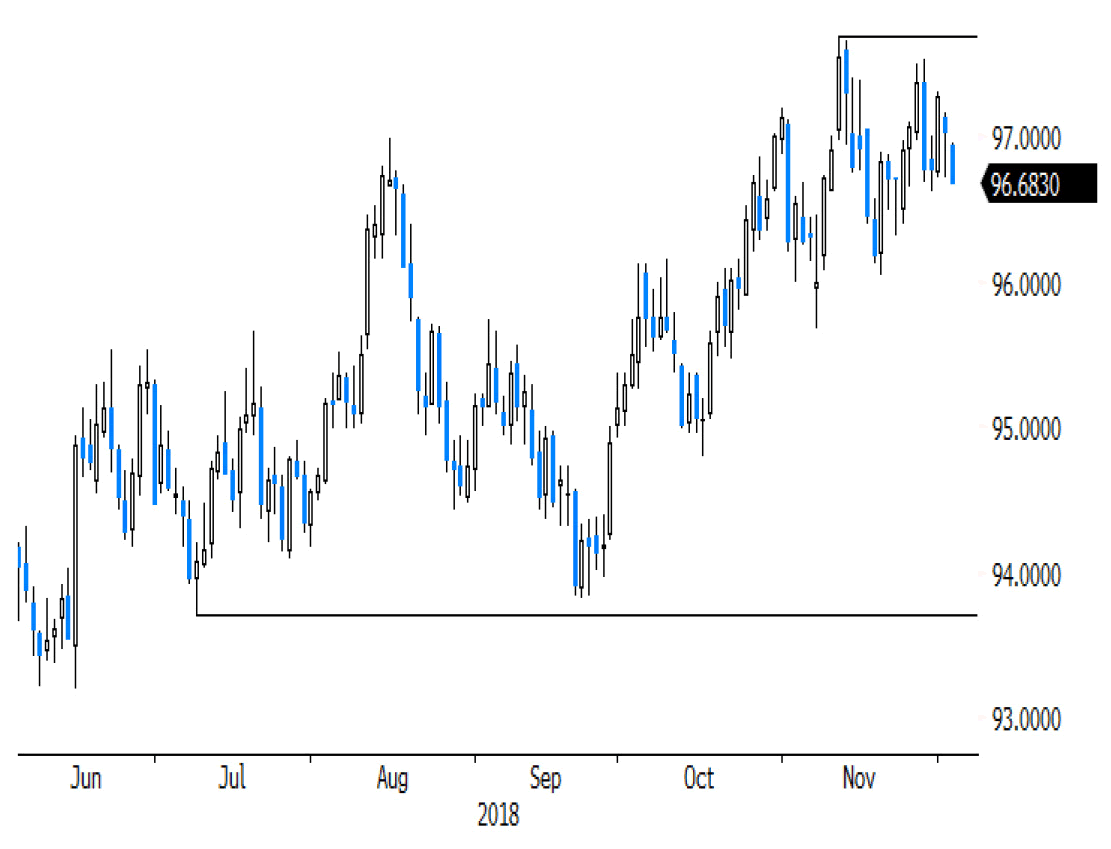
USD (trade-weighted DXY): dollar struggles as sentiment on risk falters and US yields decline