Sample Category Title
USDJPY Bullish Bias Above 113.15 Level
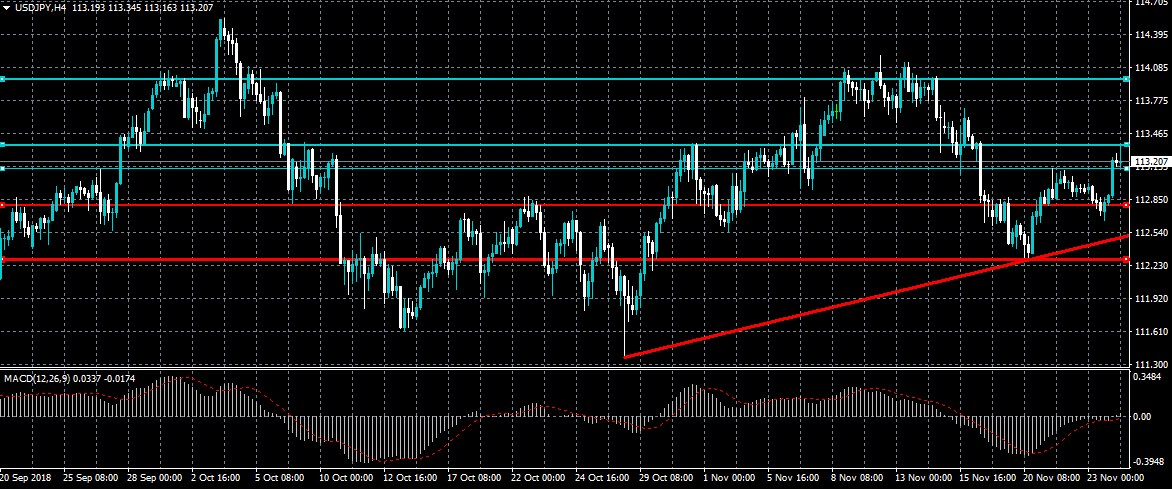
The US dollar has moved higher against the Japanese yen currency in early week trade, following much weaker than expected Japanese Inflation data and an approved appetite for riskier asset classes. The USDJPY is intraday bullish while trading above the 113.15 level, which is a former key resistance level the pair has been struggled to overcome. Traders now await the open of US equity markets following the extended Thanksgiving holiday last week.
The USDJPY pair is intraday bullish while trading above the 113.15 level, key technical resistance is now found at the 113.40 and 114.00 levels.
If the USDJPY pair trades below the 113.15 level, key technical support is now found at the 112.79 and 112.53 levels.
WTI Oil Outlook: Bears Look For Final Break Below Psychological $50 Support After Consolidation
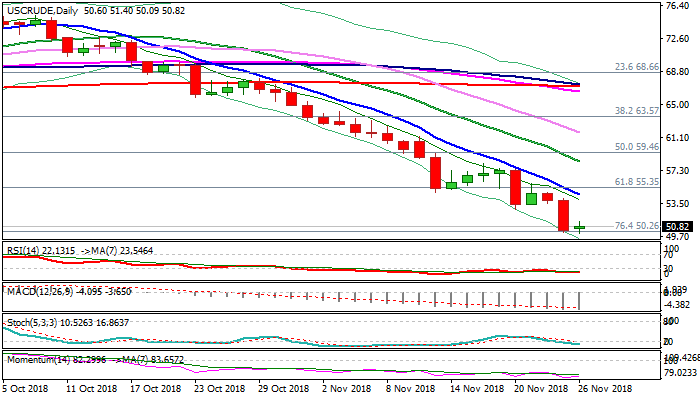
WTI oil ticked higher on Monday, consolidating last Friday's (already named in the markets as ‘black Friday') 6.5% fall. Marginal recovery (0.7% so far) which was slightly above Fibo 23.6% of Friday's $54.09/$50.09 fall, could be seen as consolidative action and more as hesitation at psychological $50 support, approached on Friday's fall to $50.09 low, before bears resume. The sentiment remains very negative and along with firmly bearish techs (WTI contract closed the seventh straight week in red last Friday and also generated bearish signal on close below 200WMA), keeps strong bearish bias in play. Eventual break below $50 pivot would signal further weakness which could test support at $45.57 (31 Aug 2017 low) and risk stretch towards higher base at $42.00 zone. Extended consolidation is expected to hold under broken 200WMA ($52.30) to keep bears intact.
Res: 51.40, 52.56, 54.09, 54.80
Sup: 50.00, 49.10, 46.99, 45.57
Italy To Change Budget Stance Lifts Risk Appetite
Monday November 26: Five things the markets are talking about
Aside from the FAANG share liquidation to the tune of $1Trillion in face value last week, capital markets have been grappling with the expected pace of the Fed rate hikes for 2019.
A December Fed hike has already been priced in, but with weaker U.S data and an ongoing trade war, between the world’s two largest economies, dealers are reducing their bets on a three-cycle hike from the Fed next year. Rate differentials and the liquidation of ‘frothy’ U.S assets has not been a big support for the U.S dollar. Investors will analyse the FOMC minutes to be released mid-week for clues to future policy.
Sterling has been the currency of danger, providing spikes of volatility with lower than usual volumes on Brexit agreements and disagreements. As of today, U.K and EU negotiators have agreed on the text of the deal outlining the future relationship between the U.K. and the European Union. However, PM May’s work is not done yet; she still has to get parliamentarians to sign off on the deal and even her cabinet.
Elsewhere, trade tensions are heightened with the Group of 20 meeting later this week and whether the meeting will provide a venue for China and the U.S to take steps toward resolving some of their trade issues.
While in Europe, Italy remains a cause for concern with the European Commission rejecting its budget proposal and pursuing an excessive deficit procedure (EDP), which could lead to sanctions. Rome is coming under some pressure again as the government continues to show defiance in the face of sanctions and market pressure. There is hope however, earlier this morning, the nation’s Deputy PM Matteo Salvini signalled a new openness to alter the country’s budget deficit target for next year.
Elsewhere, the dollar and Treasuries ticked lower, while oil gained and Bitcoin extended its recent tumble to below $4,000 as cryptocurrencies fell across the board.
On tap: ECB’s Draghi will address the European Parliament’s committee for economic and monetary affairs this morning. Presidents Trump and Xi Jinping plan to meet at the G-20 that starts on Friday. Fed Reserve Vice Chairman Richard Clarida speaks in NY tomorrow and Chair Powell speaks on Wednesday. G20 meeting is to be held in Argentina from Nov 30-Dec 1.
1. Stocks mixed overnight session
Japanese shares rallied overnight to touch a one-week high, with an upcoming World Expo in Osaka lifting the market – they won the bid to host the 2025 World Expo at the weekend. The Nikkei share average ended the session up +0.76%, posting its second session of gains. The broader Topix was up +0.2%.
Down-under, Aussie shares traded lower on Monday by heavy losses for the mining and energy sectors. Australia’s S&P/ASX 200 index closed down -0.78%, after rising +0.4% on Friday. In S. Korea, the Kospi stock index jumped overnight, boosted by gains in chemical and airline stocks on oil rout. The index closed up +1.24%, its biggest gain since Nov 2.
China stocks shed early gains to end lower overnight as investors weighed a number of risks in the upcoming Sino-U.S trade talks, Chinese economy and global oil prices. At close, the Shanghai Composite index was down -0.1%, while the blue-chip CSI300 index was also down -0.1%.
In contrast, stocks in Hong Kong rallied on Monday, on signs of the U.S Fed slowing its pace of hiking interest rates. The Hang Seng index ended +1.73% higher and the Hang Seng China Enterprises index rose +1.3%.
In Europe, regional bourses are trading higher across the board with the majority of indices trading over +1% higher after a positive session in Asia and stronger futures in the U.S. The FTSE MIB outperforms following reports Italy is set to compromise on its budget targets.
U.S stocks are set to open deep in the ‘black’ (+1.25%).
Indices: Stoxx600 +1.3% at 358.4, FTSE +1.2% at 7032, DAX +1.2% at 11325, CAC-40 +1.4% at 5013, IBEX-35 +1.8% at 9071, FTSE MIB +3.0% at 19265, SMI +1.3% at 8962, S&P 500 Futures +1.2%
2. Oil prices claw back some losses after Black Friday, gold unchanged
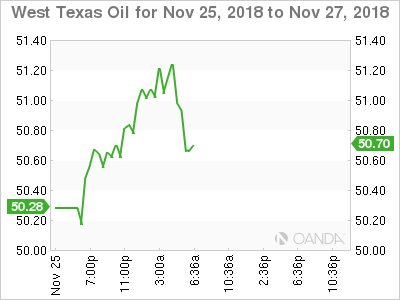
Oil prices have clawed back some of Friday’s -7%+ losses, but Brent is failing to hold above the psychological +$60 per barrel.
Front-month Brent crude oil futures have rallied +96c, or +1.6%, to +$59.76 per barrel, while U.S West Texas Intermediate (WTI) crude futures are up +62c, or +1.2% at +$51.04 per barrel.
Note: China’s Shanghai crude futures overnight fell by -5%, hitting their daily downside-limit.
The downward pressure comes from surging supply and a slowdown in demand growth, which is expected to result in an oil supply overhang by next year.
Market consensus sees oil-demand growth over the next couple of quarters will help balance rising supplies, but demand could structurally slow further into 2019-2020.
In this scenario, OPEC and company will be required to act decisively and quickly with a combined supply cut if they want to avoid a much deeper pull back in oil prices.
The North American crude ‘bears’ continue to see further price downside risks from the growth in U.S shale production as well as the deteriorating economic outlook.
Concerned about an emerging production overhang, OPEC is expected to push for cuts at its December 6 meeting – expectations for a supply cut are in the region of -1M to -1.4M bpd.
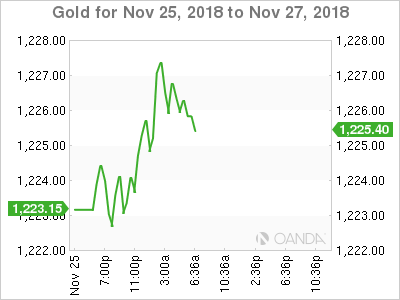
Ahead of the U.S open, gold prices are little changed with the market looking to this week’s G20 meeting for any signs of optimism in the Sino-U.S trade conflict. Spot gold is little changed at +$1,222.36 per ounce, while U.S gold futures are flat at +$1,223.3 per ounce.
3. Italian yields fall as government looks to cave on budget revision
Italian BTP yields fell by over -30 bps to reach over two-month lows overnight after reports that Italy’s governing coalition is bowing to pressure and is planning to reduce next year’s budget deficit target.
Italy is considering reducing its deficit target to as low as +2% of GDP to avoid a disciplinary procedure from Brussels.
Hopes of an agreement have pushed Italy’s 10-year BTP yield down by -22 bps to a two-month low of +3.19%, while its spread over German Bunds is at its tightest in over a month at +284 bps.
Note: BTP/Bund spread was at +335 bps early last week.
Elsewhere, the yield on 10-year Treasuries gained +2 bps to +3.06%, the biggest climb in almost three weeks. In Germany, the 10-year Bund yield has increased +2 bps to +0.36%, while in the U.K the 10-year Gilt yield has gained +2 bps to +1.406%.
4. Dollar unfazed for the moment
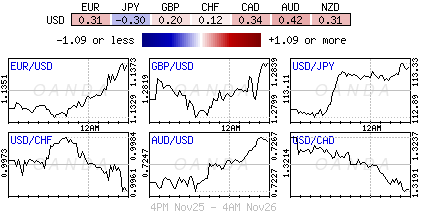
The USD is trading mixed against G7 currency pairs and is expected to take its cue from this weeks FOMC minutes. A percentage of the market believes the Fed minutes could lean towards the ‘dovish’ side after the recent equity volatility.
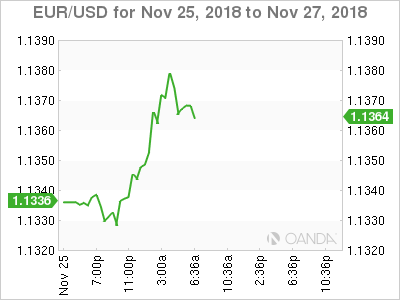
The EUR (€1.1369) has strengthened against G7 currencies overnight, with risk appetite lifted after the E.U and Britain agreed a Brexit deal and signs that Italy is willing to reach a compromise over next year’s budget plans.
Sterling (£1.2844) is better bid this morning after E.U ratified the Brexit withdrawal treaty on the weekend. However, PM Theresa May has reiterated that the next few weeks are crucial for Britain’s future, and the Brexit vote would be one of the most significant votes in Parliament for many years. She stressed that the best Brexit deal was achieved and in the national interest and that there would be no other deal negotiated or a second referendum.
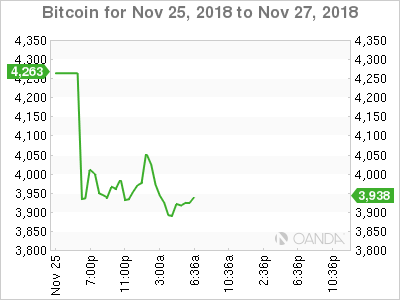
Bitcoin (BTC) has extended its falls this morning to +$3,843, down more than -5% from its overnight high on renewed selling in cryptocurrencies.
5. German IFO expectations fall
Data this morning shows that German business sentiment deteriorated for the third-consecutive month in November, as companies continued to scale back their business outlooks for the next six-months.
According to the Ifo, the business-climate index dropped to 102.0 points from a revised 102.9 points in October, falling short of 102.3 expectations.
Digging deeper, German manufacturers were less satisfied with their current situation, and they also scaled back their business outlook. Nevertheless, more companies reported plans to increase prices.
November’s fall in the Ifo Business Climate Indicator adds to evidence that the German economy is slowing, but suggests that the particular weakness of Q3 will not be repeated at the end of the year.
Note: Current conditions are still well above its long-run average.
EUR/USD – Euro Shrugs Off Soft German Business Climate
EUR/USD has edged higher in the Monday session, erasing much of the losses seen on Friday. Currently, the pair is trading at 1.1369, up 0.29% on the day. On Sunday, European Union leaders formally endorsed the Brexit withdrawal agreement. German Ifo Business Climate dipped to 1o2.3, shy of the estimate of 102.0 points. Later in the day, ECB President Mario Draghi will testify before the European Parliament Economic and Monetary Affairs Committee. There are no U.S. events on the schedule. On Tuesday, the U.S. releases CB Consumer Confidence, which is forecast to dip to 136.2 points.
A milestone of sorts was reached on Sunday, as the 27 EU leaders gave their approval to the Brexit withdrawal agreement, as well as a political declaration on economic relations between Britain and the EU after Brexit. The event was solemn, and EU leaders took pains to warn British parliamentarians that there will the EU will not agree to any further concessions. Dutch Prime Minister summed up the mood in Brussels, saying “there is no Plan B”. The EU has signaled that the deal signed on Sunday is “take it or leave it” – if the U.K. doesn’t sign on, the result will be a hard Brexit. which could be catastrophic for the British economy. Prime Minister May joined the summit on Sunday and again urged British lawmakers to approve the deal, saying it met most of Britain’s demands. Still, May will have an uphill battle pushing the deal through parliament, with the Labor party and a many Conservative MPs set to vote against the deal.
German GDP and PMI reports pointed downwards on Friday, putting pressure on the euro. Final GDP declined 0.2% in the third quarter, in line with expectations. This marked the first decline since 2014 and was identical to Preliminary GDP, which was released last week. Manufacturing PMI fell to 51.6, pointing to a stagnant manufacturing sector. This marked a fourth straight drop in manufacturing activity. Services PMI dropped lower, with a reading of 53.3 points. Both indicators missed their forecasts. The contraction in growth has weak PMIs is bound to raise concerns – is the long German expansion over? German officials attributed the weak GDP releases to new emission standards for German cars, but it’s likely that the drop can also be attributed to a weaker global economy due to the ongoing trade war between the U.S. and China. With no sign that the two super-economies will reach an agreement anytime soon, the eurozone economy could face more headwinds, which in turn could weigh on the euro.
600K Bitcoin Miners Shut Down In Last 2 Weeks, F2Pool Founder Estimates
Between 600,000 and 800,000 bitcoin miners have shut down since mid-November amid declines in price and hashrate across the network, according to the third-largest mining pool.
In an interview with CoinDesk, Mao Shixing, founder of F2pool, said his firm’s estimate takes into account the total network hashrate drop and the average hash power of older mining machines that are having a hard time generating profits.
According to data from blockchain.info, the bitcoin network’s entire hashrate, which captures the aggregated computing power on the world’s first blockchain, has dropped from around 47 million tera hashes per second (TH/s) on Nov. 10 to 41 million on Nov. 24 – an almost 13 percent decline.
Mao explained most miners that may have halted operations are likely those using older models, such as the Antminer T9+ made by Bitmain and AvalonMiner 741 by Canaan Creative. These miners have an average hash power of around 10 TH/s and are estimated to be losing money right now, according to F2pool’s miner revenue index.
In fact, the bitcoin hashrate on F2pool, which now accounts for about 11.4 percent of the total network, has also seen a decline of over 10 percent in recent weeks, Mao said.
“It’s hard to calculate a precise number of miners connected to us that had unplugged. But we saw over tens of thousands of them [shut down] in the past several days based on conversations we had with larger farms that we are in regular contact with,” he said, adding: “This is what’s happening among miners in China.”
The Analytical Overview Of The Main Currency Pairs
The EUR/USD currency pair
Technical indicators of the currency pair:
Prev Open: 1.14404
Open: 1.13396
% chg. over the last day: -0.59
Day's range: 1.13505 – 1.13702
52 wk range: 1.1299 – 1.2557
On Friday, aggressive sales were observed on the EUR/USD currency pair. Drop in quotes exceeded 70 points. At the moment, the euro has recovered most of the losses. Local support and resistance levels are 1.13500 and 1.13850, respectively. Positions should be opened from these marks. We recommend following the current information on the budget process in Italy.
The news feed on 26.11.2018:
German IFO business climate index at 11:00 (GMT+2:00).
We also recommend paying attention to the speech by the ECB President Draghi.
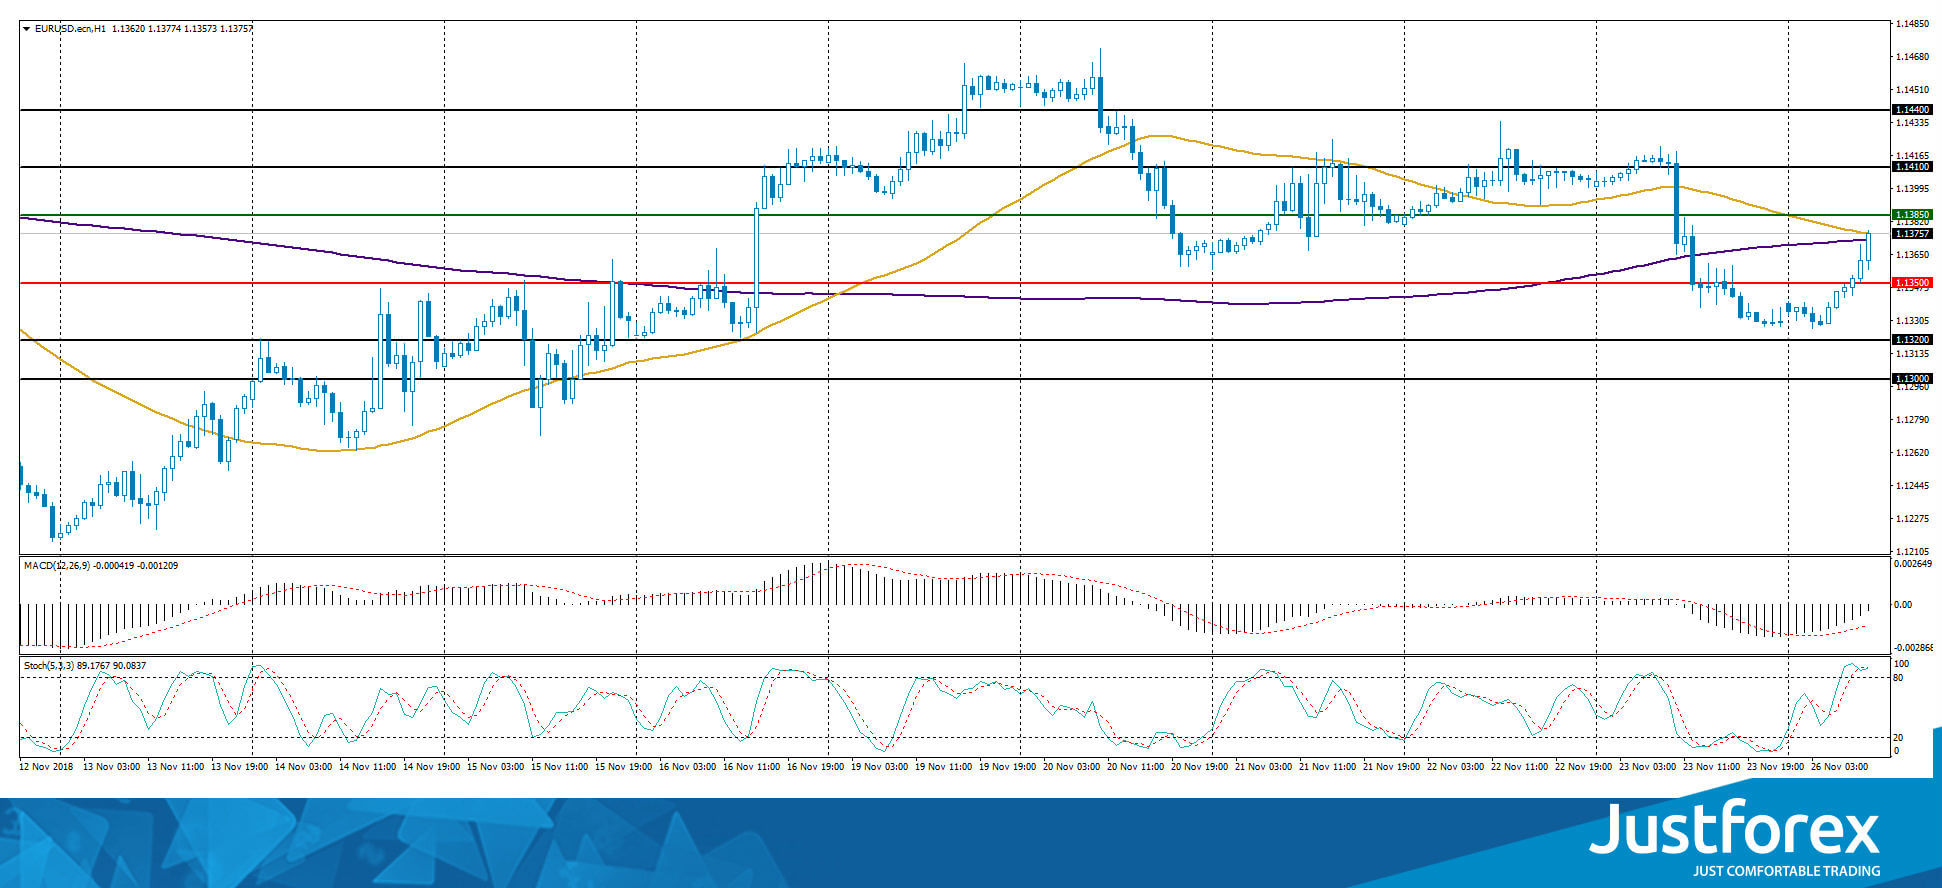
Indicators do not send accurate signals: the price has crossed 50 MA and 200 MA.
The MACD histogram is in the negative zone, but above the signal line, which gives a weak signal to sell EUR/USD.
Stochastic Oscillator is in the overbought zone, the %K line has crossed the %D line. There are no accurate signals.
Trading recommendations
Support levels: 1.13500, 1.13200, 1.13000
Resistance levels: 1.13850, 1.14100, 1.14400
If the price fixes below the support level of 1.13500, a further fall in the EUR/USD quotes is expected. The movement is tending to 1.13200-1.13000.
An alternative may be the EUR/USD currency pair growth to the level of 1.14100-1.14400.
The GBP/USD currency pair
Technical indicators of the currency pair:
Prev Open: 1.28739
Open: 1.28202
% chg. over the last day: -0.50
Day's range: 1.28146 – 1.28438
52 wk range: 1.2662 – 1.4378
On Friday, the bearish sentiment was observed on the GBP/USD currency pair. The decrease in quotes exceeded 70 points. At the moment, investors assess Brexit deal between the EU and the UK. The local support and resistance levels are 1.28150 and 1.28500, respectively. Positions should be opened from these marks.
Today the publication of important economic reports from the UK is not planned. We recommend paying attention to the speech by the Bank of England Governor Carney.
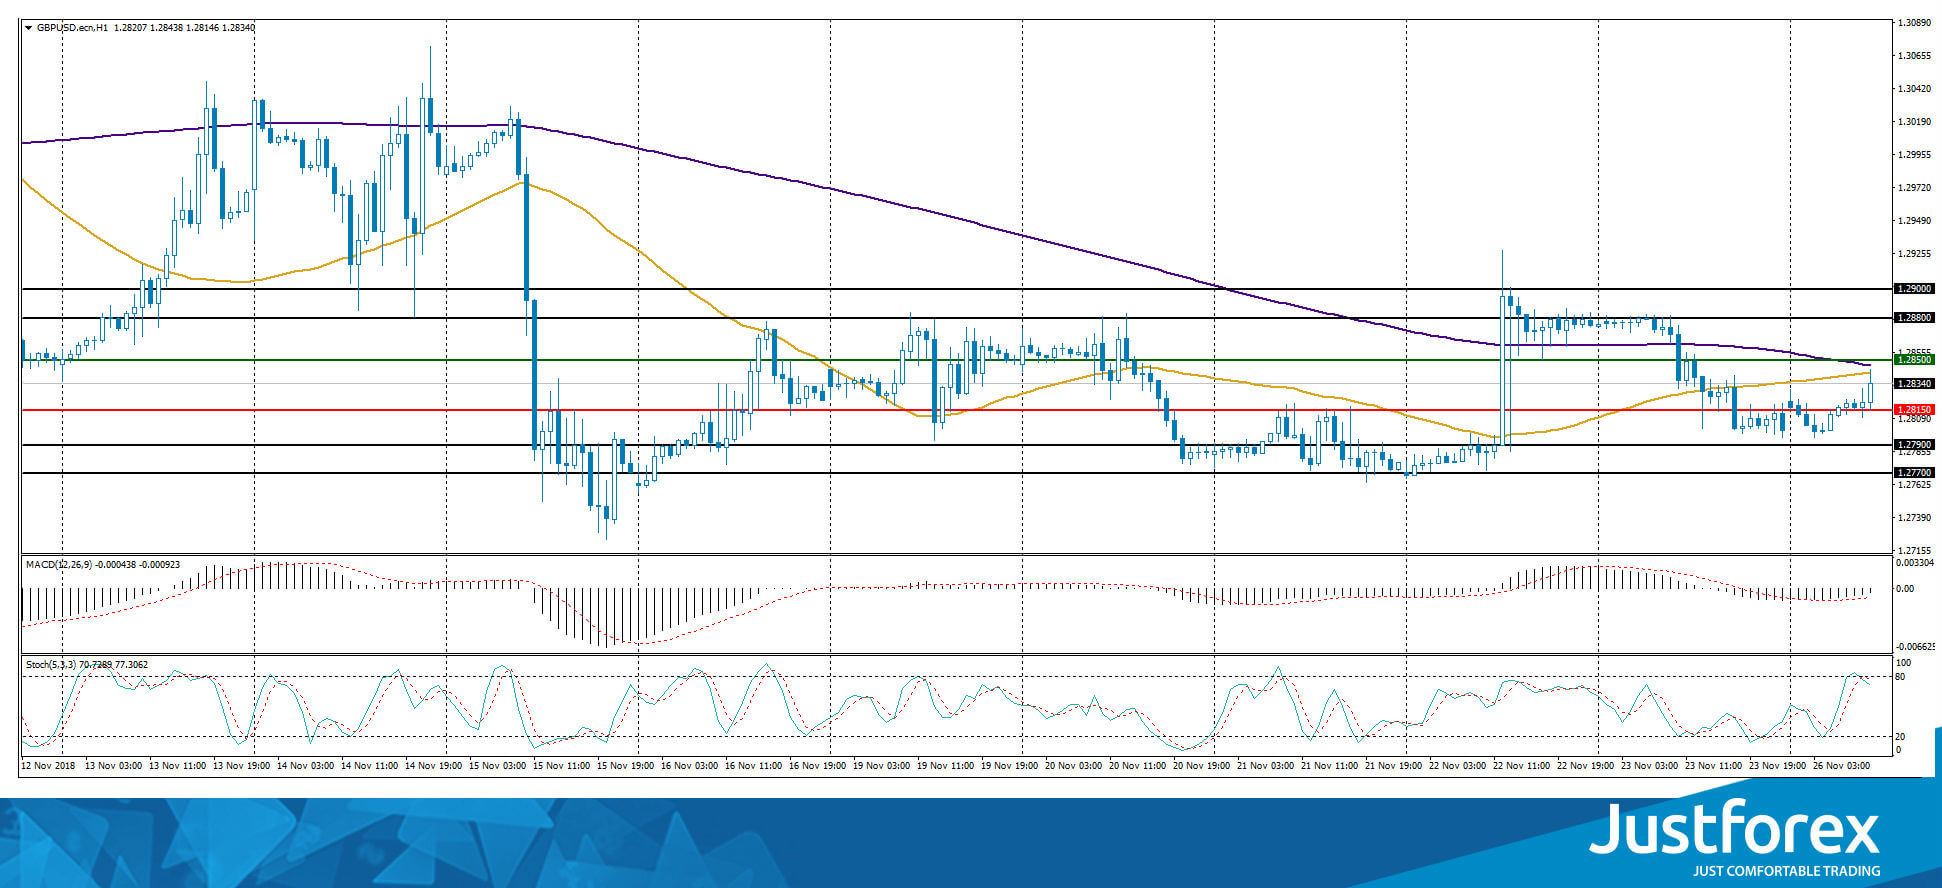
Indicators do not send accurate signals: 50 MA is crossing 200 MA.
The MACD histogram is located near the 0 mark.
Stochastic Oscillator is near the overbought zone, the %K line has crossed the %D line. There are no accurate signals.
Trading recommendations
Support levels: 1.28150, 1.27900, 1.27700
Resistance levels: 1.28500, 1.28800, 1.29000
If the price fixes below the support level of 1.28150, the GBP/USD quotes are expected to fall. The movement is tending to 1.27900-1.27700.
An alternative may be the further growth of the GBP/USD currency pair to 1.28800-1.29000.
The USD/CAD currency pair
Technical indicators of the currency pair:
Prev Open: 1.31866
Open: 1.32209
% chg. over the last day: +0.36
Day's range: 1.31870 – 1.32015
52 wk range: 1.2248 – 1.3387
There is a variety of trends on the USD/CAD currency pair. On Friday, there were ambiguous economic reports on inflation and retail sales in Canada. At the moment, the key support and resistance levels are 1.31800 and 1.32100, respectively. Positions should be opened from these marks. We recommend paying attention to the dynamics of oil prices.
The news feed on the economy of Canada is calm.
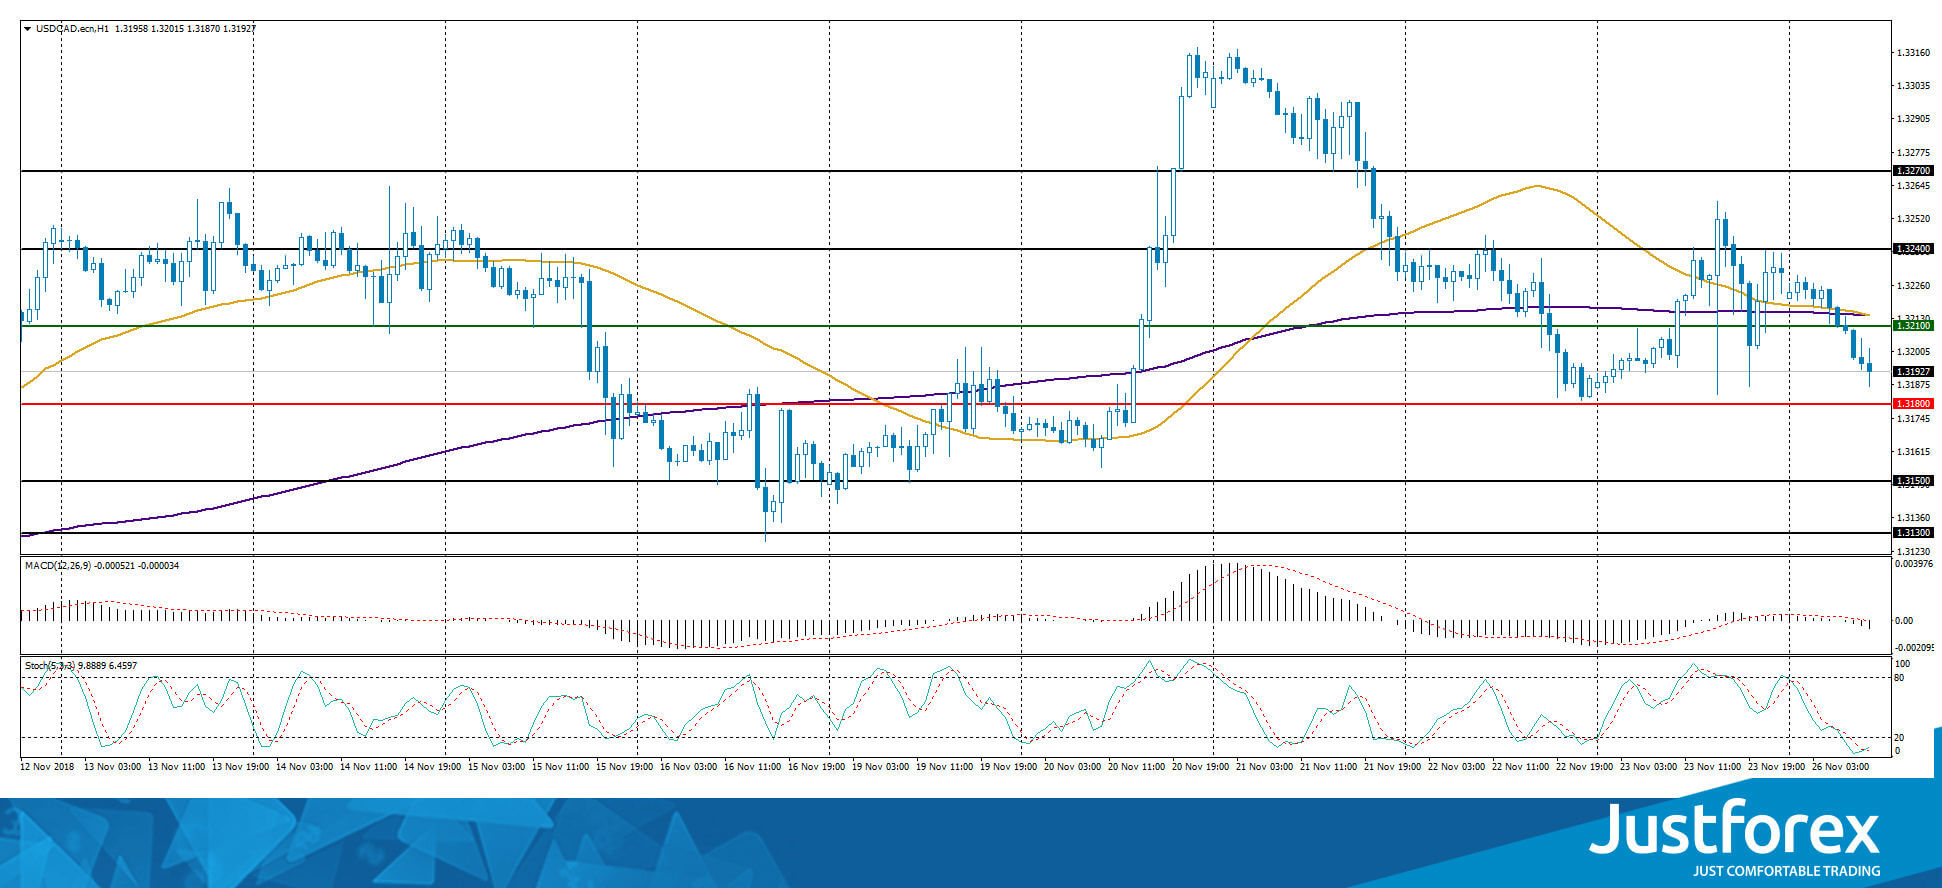
Indicators do not send accurate signals: 50 MA has crossed 200 MA.
The MACD histogram has moved to the negative zone, which gives a signal to sell USD/CAD.
Stochastic Oscillator is in the oversold zone, the %K line has crossed the %D line. There are no signals.
Trading recommendations
Support levels: 1.31800, 1.31500, 1.31300
Resistance levels: 1.32100, 1.32400, 1.32700
If the price fixes above the resistance level of 1.32100, it is necessary to consider purchases of USD/CAD. The movement is tending to 1.32400-1.32700.
Alternative option. If the price fixes below the 1.31800 mark, we recommend looking for entry points to the market to open short positions. The movement is tending to 1.31500-1.31300.
The USD/JPY currency pair
Technical indicators of the currency pair:
Prev Open: 112.939
Open: 112.866
% chg. over the last day: +0.01
Day's range: 113.241 – 113.294
52 wk range: 104.56 – 114.74
The bullish sentiment is observed on the USD/JPY currency pair. At the moment, quotes are consolidating. The local support and resistance levels are 113.150 and 113.350, respectively. We recommend paying attention to the dynamics of the US government bonds yield. Positions should be opened from the key levels. The USD/JPY quotes have the potential for further growth.
Publication of important economic reports from Japan is not planned.
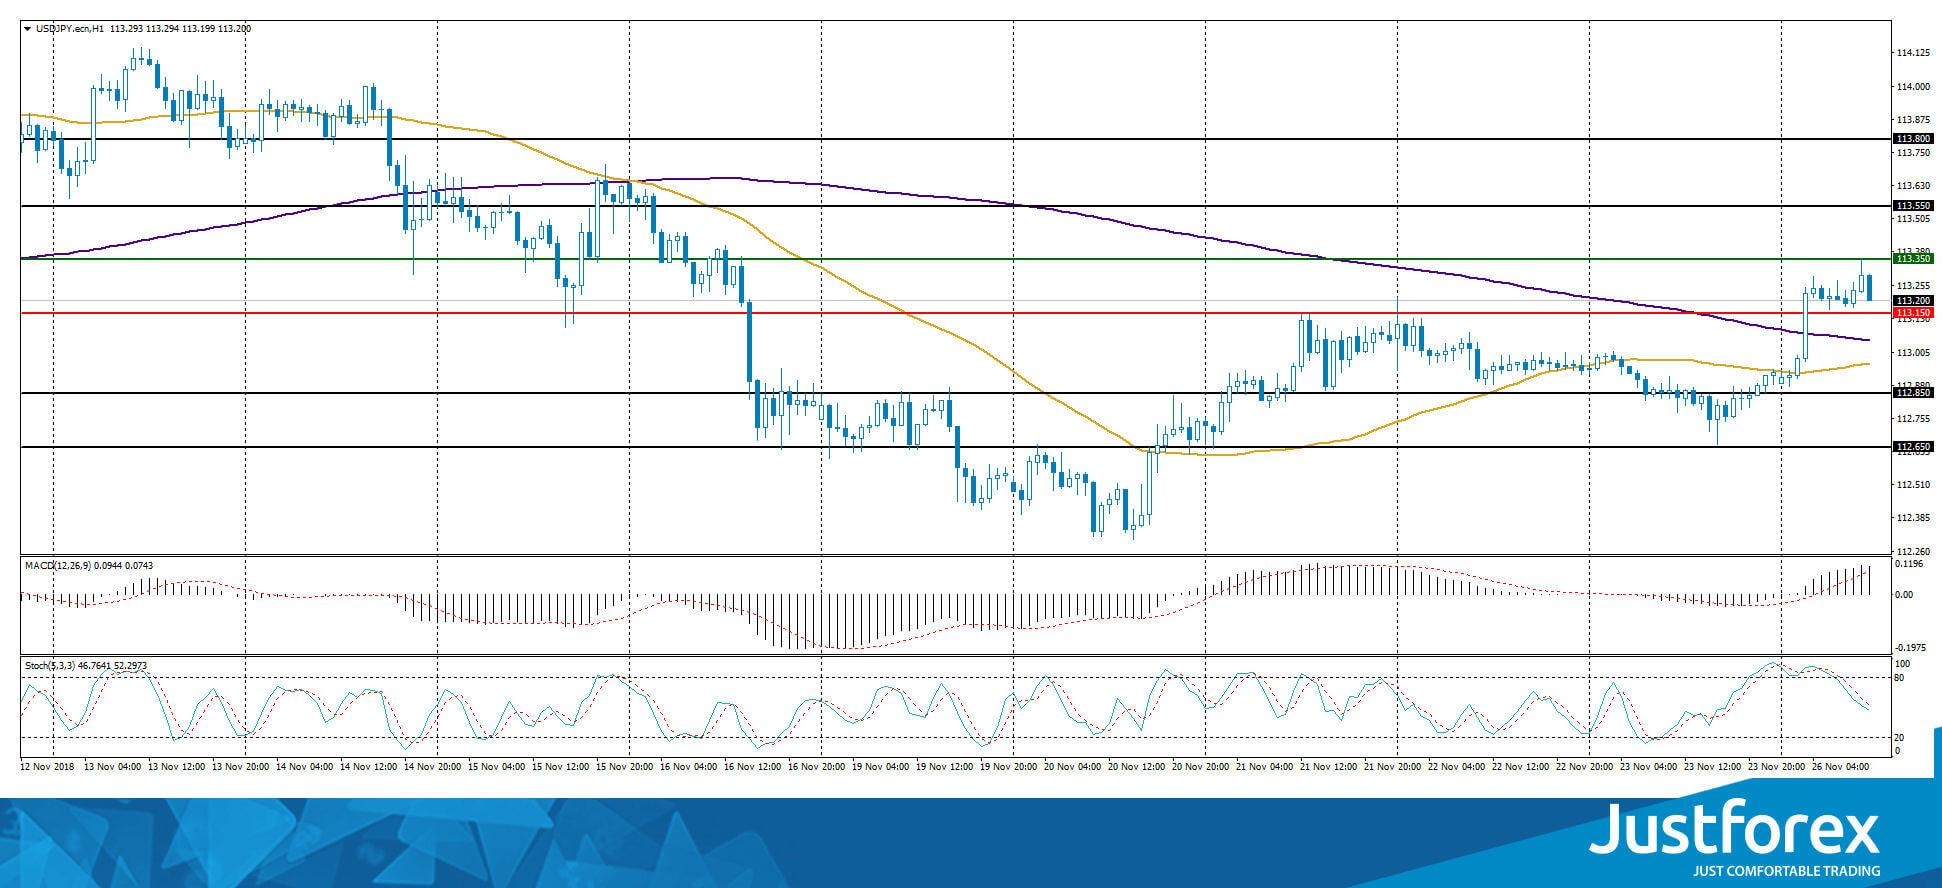
Indicators point to the power of buyers: the price has fixed above 50 MA and 200 MA.
The MACD histogram is in the positive zone, above the signal line, which gives a strong signal to buy USD/JPY.
Stochastic Oscillator is in the neutral zone, the %K line has crossed the %D line. There are no accurate signals.
Trading recommendations
Support levels: 113.150, 112.850, 112.650
Resistance levels: 113.350, 113.550, 113.800
If the price fixes above the resistance of 113.350, further growth of the USD/JPY quotes is expected. The movement is tending to 113.550-113.800.
An alternative may be the USD/JPY currency pair growth to 113.000-112.800.
Brexit Deal In Place But Limited Market Reactions
Brexit Deal in place but limited market reactions
On Sunday, European Union leaders accepted a Brexit deal package from UK Prime Minister May. Currently EU leaders, with the exception of Spain, are backing the deal but time will tell if the political divisiveness doesn’t demolish the current optimism. While Europe stocks are expected to open higher, sterling is relatively unmoved. The lack of market reaction highlights the weariness investors have with the Brexit negotiations. The focus now turns to the 'meaningful vote' on the deal in the UK Parliament. The ramped-up rhetoric has heightened the stakes on the Brexit vote with many politicians risking it all for one direction of another. This creates a dynamic where government has a challenging task ahead of them to convince objectors to accept a less-than-perfect deal (which does not exist). Under scrutiny it’s likely that cracks will appear, weakening the probability of sufficient votes and strengthening fears of a hard Brexit. The Brexit headlines will continue to dominate and hinder the rate from rising. Given the 'noise', negatives on GBP are already priced in. The complexity of the withdrawal deal is sustaining high short-term implied volatility. The GBP/USD trading range will remain constricted between 1.2770 and 1.2900.
Asian and European shares higher amid last Friday's slump
Closing in negative territory during the previous week's trading session - amid growing worries over a potential breakthrough in US-China trade discord and fears of a growth slowdown in Asia - Asian stock markets have been rising higher, despite uncertainties relating to a potential easing of trade tensions as Donald Trump and Xi Jinping meet at the G20 summit. There are hopes of a slowdown in pace of the Fed’s tightening cycles, whose November meeting minutes were published on Thursday, providing a better overview of its stance. The Nikkei 225 has been rising by + 0.76% while the Hong Kong Hang Seng and China mainland respectively advanced by +1.73% and closed flat (-0.07%), with energy shares down due to sharp drop in crude over the last one and a half months. Indeed, it appears that today’s trading session should remain in the green globally. US futures and European markets are rising while positive developments regarding EU members' approval of a transitory Brexit solution and Italy’s complacency relating to its budget expenses (recent publications mention a reduction of 10 – 20 BPS, despite European Commission deficit expectations set at 2.90% for 2019) push European shares above 1% across the board. The Italian FTSE MIB surges as much as 3% in early trading, while the Euro Stoxx 50 rises by +1.42%. Accordingly, we expect Asian shares to head higher following the G20 summit, as a slight relief in US-China trade talks should raise up investor sentiment. USD/CNY, currently trading at 6.9383, is expected to remain directionless - maintained at 6.95.
AUDUSD Outlook: Close Above Fibo Barrier At 0.7269 Would Be Bullish Signal
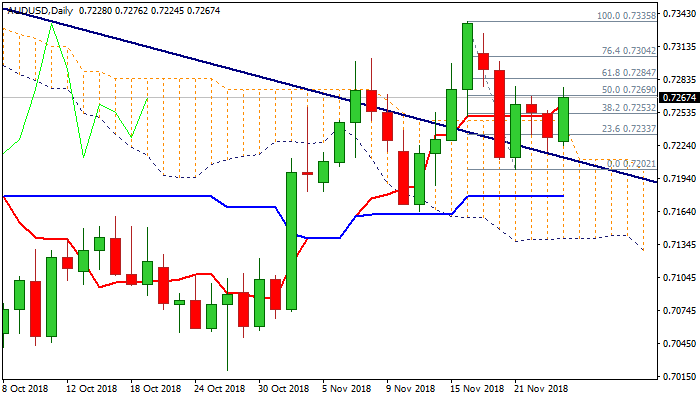
The Australian dollar rallied on Monday and recovered all losses from last Thu/Fri, to retest cracked Fibo barrier at 0.7269 (50% of 0.7335/0.7202 bear-leg. Ability to hold above thick daily cloud would keep hopes for further recovery, with improving daily techs as MA's turn to bullish setup on today's rally and momentum turned sideways just above the midline, after being in steady descend during past sessions. Close above 0.7269 pivot would generate fresh bullish signal and keep immediate focus shifted up. Bulls would then need break above Fibo barriers at 0.7284/0.7304 (61.8% and 76.4% of 0.7335/0.7202) to confirm continuation. The downside would remain vulnerable on another failure to close above 0.7269 pivot, with increased downside risk towards rising 20SMA (0.7226) and cloud top (0.7211) if today's action ends below broken 100SMA (0.7245). Focus turns towards upcoming G20 meeting at the end of the week, where the top event will be meeting between US President Trump and Chinese President Xi. Two presidents are expected to talk about persisting trade problem, after the US announced the raise its current 10% tariff on Chinese goods to 25%. If tariff hike will be postponed after talks this would open way for further negotiations and would ease concerns about global war. Such scenario would improve market sentiment and likely further support Aussie dollar.
Res: 0.7269, 0.7284, 0.7304, 0.7335
Sup: 0.7257, 0.7245, 0.7226, 0.7211
Gold Analysis: Reveals Descending Pattern
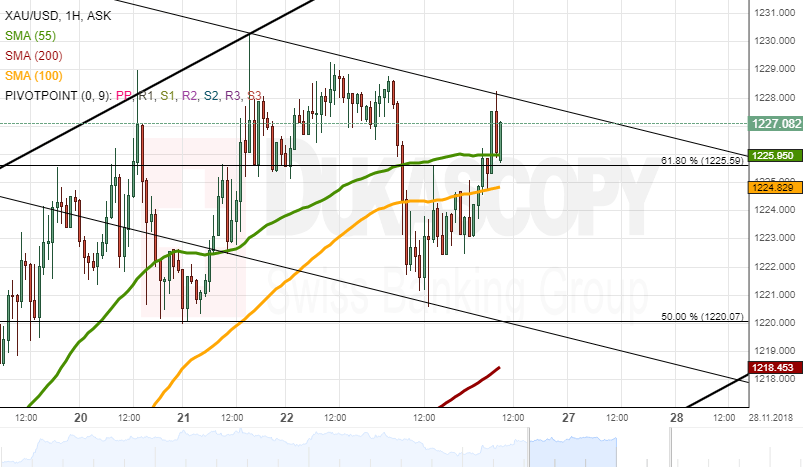
On Monday, Dukascopy Analysts spotted a channel down pattern on the hourly chart of the yellow metal. This pattern represents the rate's expected decline until new year. The decline should occur due to the metal starting a medium term consolidation after the recent gains of almost 30 USD.
Note that the pattern still needs to fully confirm itself. Namely, the commodity price has to pass the support levels of the 61.80% Fibonacci at 1,225.60 and 55-hour simple moving average at 1,225.95.
On the other hand, the pattern might be false. If its upper trend line near 1,228.00 gets broken, the metal will have the range up to the 1,240.00 level free from any technical resistance levels.
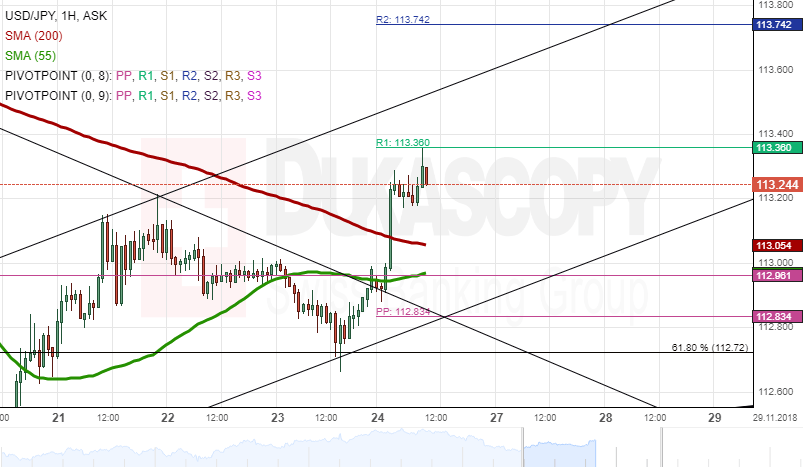
USD/JPY Analysis: Meets Resistance At 113.36
The US Dollar has paused its surge against the Japanese Yen. The pause from a technical perspective was caused by the resistance of the weekly R1, which is located at the 113.36 level.
If the level gets passed, the rate is set to gradually surge up to the next technical level, which is the weekly R2 at 113.74.
On the other hand, after a sudden surge upwards, like the one which occurred on Friday, the currency pair has to consolidate its gains or even experience a pullback. If this becomes reality, the rate will trade sideways or even retrace back down to the 113.00 level