Sample Category Title
NZDJPY Positive Bias Eases; Still Looks Bullish in Medium Term
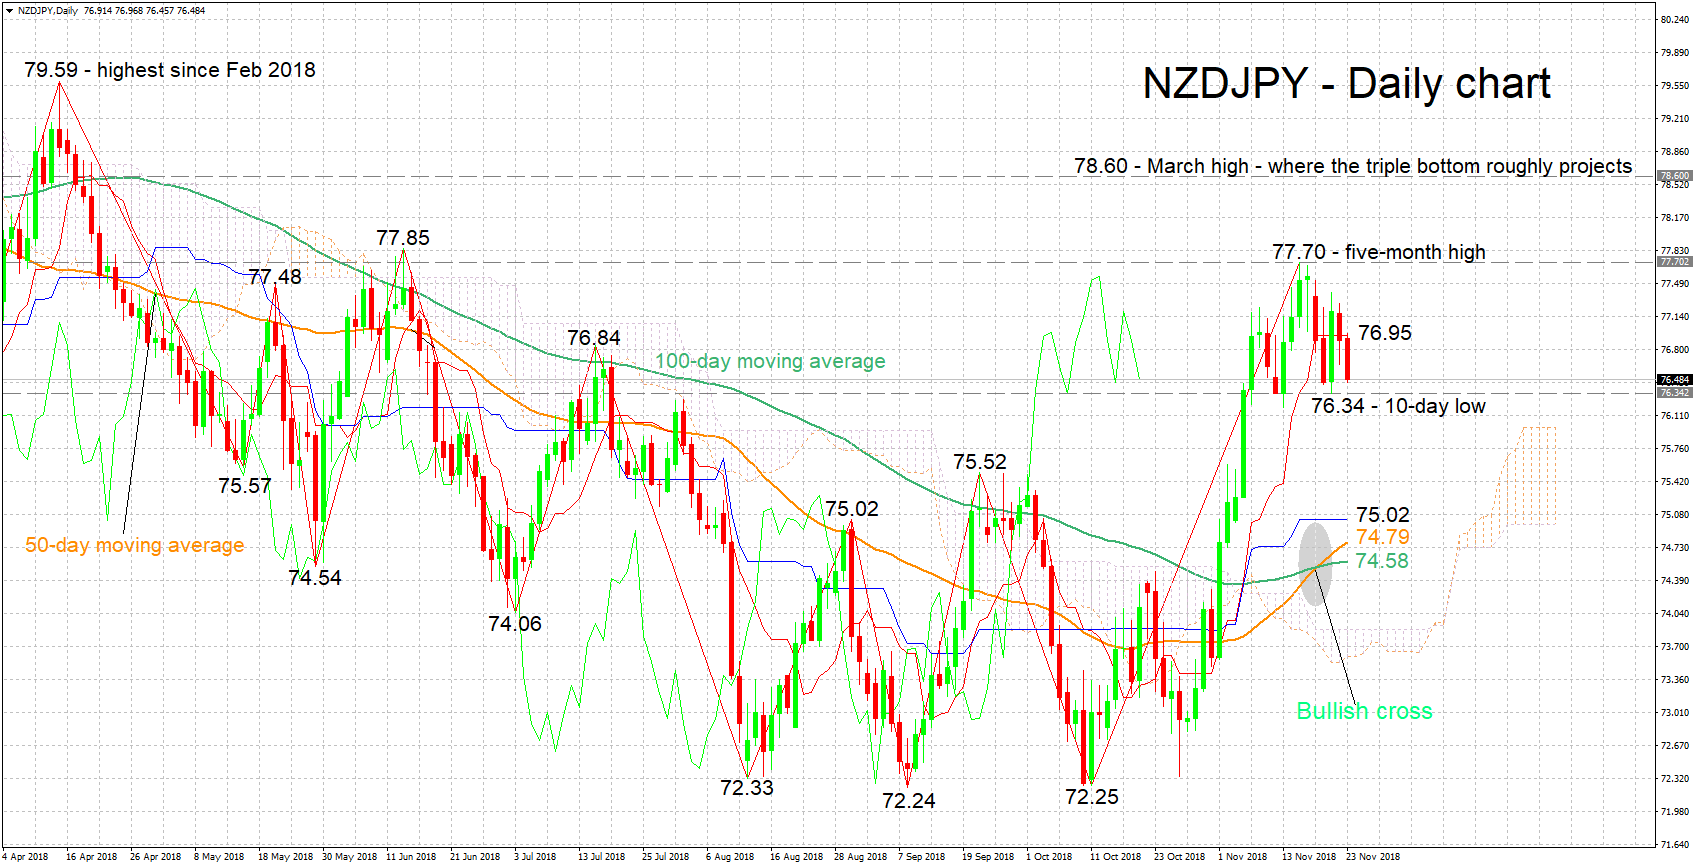
NZDJPY retreated after touching a five-month high of 77.70 last week. Still, the pair’s remarkable recovery after coming close to more than two-year lows in early October remains largely intact.
The Tenkan- and Kijun-sen lines are positively aligned in support of a bullish bias in the short term. However, notice that the two have flatlined, indicating weakening positive momentum.
A move up could meet resistance around the current level of the Tenkan-sen at 76.95; the 76.84 top and the 0.77 handle are also part of the area around this point. Further above, last week’s multi-month high of 77.70 would be eyed, with a couple of peaks from the past at 77.48 and 77.85 also being part of the region around this level. Even higher, the attention would turn to the March high of 78.60, which is also where the triple bottom reversal pattern completed in October approximately projects to.
On the way down, immediate support could occur around the 10-day low of 76.34. Lower, the area around the 75.53 top would come in focus, with steeper losses bringing the region between 75.02 and 74.58 within scope. This area encapsulates the Kijun-sen, a previous peak, and the current levels of the 50- and 100-day moving average lines.
The medium-term picture looks predominantly bullish, with price action taking place above the 50- and 100-day moving average lines, as well as above the Ichimoku cloud. It is of note that the two MAs recently recorded a bullish cross.
To conclude, the short-term bullish bias is looking fragile at the moment, while the medium-term outlook looks positive.
New Trend Could Emerge Sterling And Euro
- Sterling could break its upward trend
- Euro could fall further
Sterling-Dollar
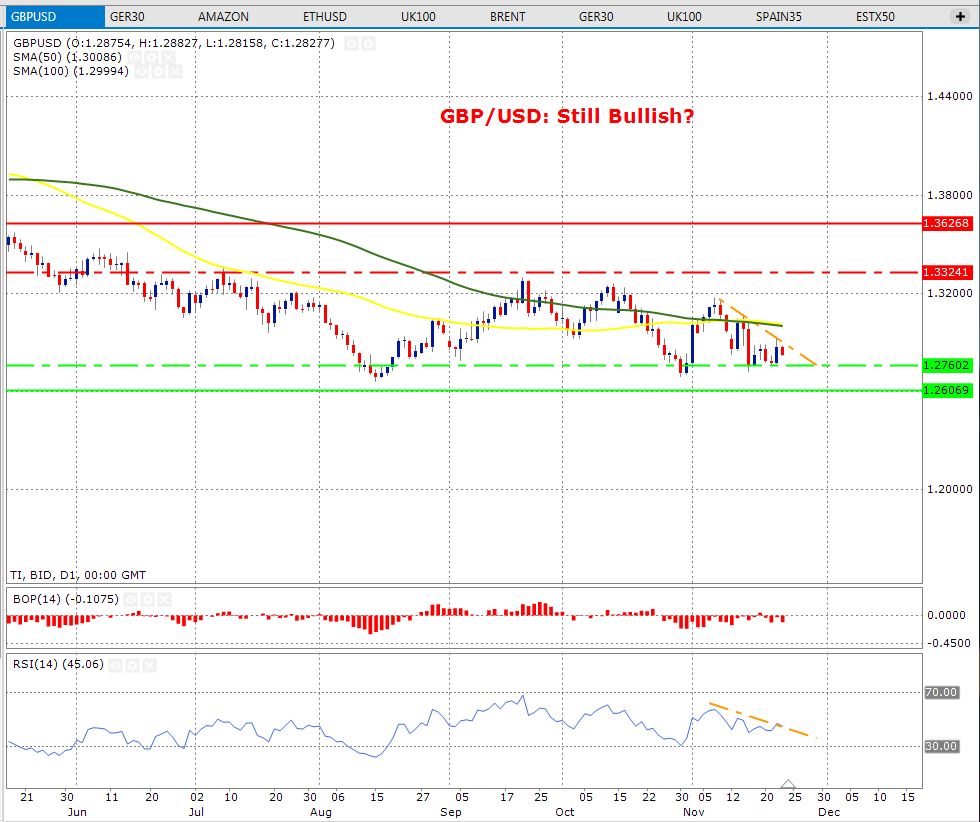
The sterling-dollar pair has failed to break above the downward trend line (shown in orange) on a daily time frame. This confirms that the price is still in a downward trend and as long as the price stays below this line, the bulls do not stand a chance to win this war. Another confirmation of the downward trend comes from the fact that the price is also trading below the 50-day and 100-day moving averages (shown in green and yellow respectively).
We have two support zones shown on the below chart, one of them is shown the dotted green line and the other one with the solid green line. The price has been bouncing off from the dotted support line however, it may be possible that the next time the price comes and tests this level, it may not hold.
The BOP favours the bears as it is trading in the negative territory. Watch out the trend line on the RSI indicator, if the RSI breaks above this, it will confirm bull momentum.
EURO-Dollar
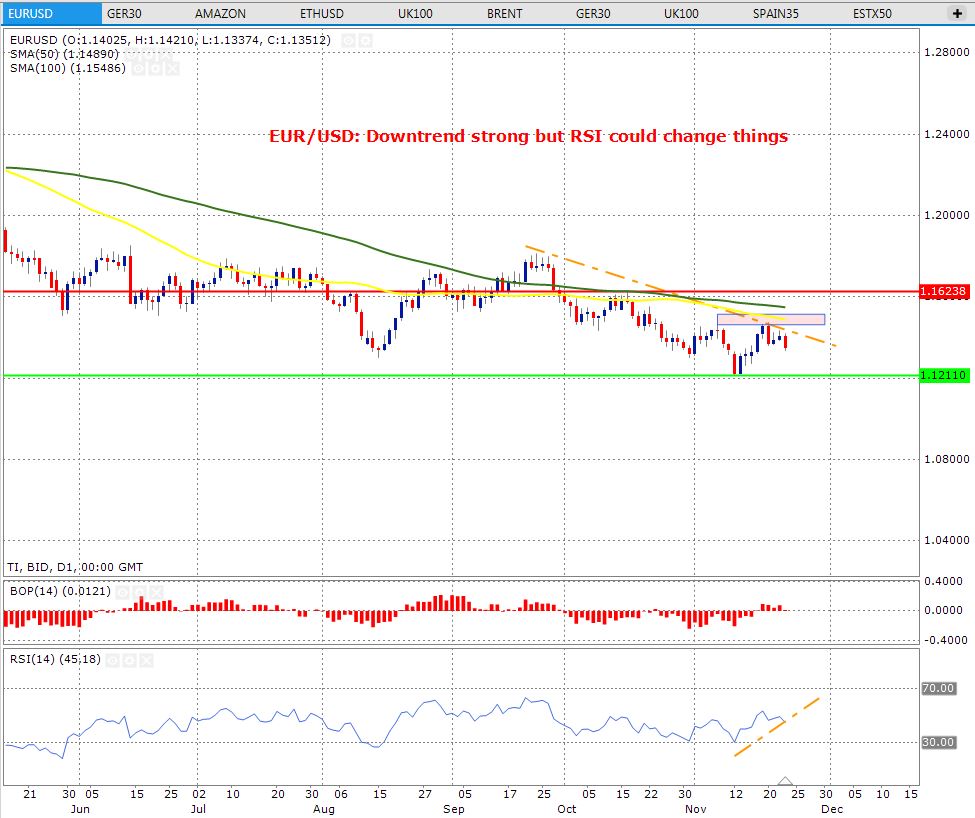
The euro-dollar pair failed to break the minor resistance zone on a daily time frame. The minor resistance zone is shown by the pink rectangle. The price has already tested this level twice and now it is testing the strength of the downward trend line. This is shown in orange. If the price breaks the downward trend line, it is likely that it may be able to break above the minor resistance zone as well.
In terms of trend, the 50-day moving average is trading below the 100-day moving average and this confirms that the downtrend is in play.
Watch out for the RSI, it is testing the upward line and a break of this will confirm weakness.
Risk Sentiment Remains Fragile; Oil Tumbles to One-Year Low
Global risk sentiment has swung back and forth this week as investors dealt with ongoing trade tensions, Brexit-related uncertainty, slowing global growth fears and depressed Oil prices.
The overall market mood remains cautious with investors on guard, and this sentiment continues to be reflected across global equity markets. Asian stocks closed mostly lower today thanks to lingering concerns over the US-China trade dispute while European markets are trading cautiously higher amid positive Brexit developments. With a strong sense of anticipation mounting ahead of the G20 summit next week, Wall Street may trade lower this afternoon as investors stroll to the side lines.
Dollar Index eyes 97.00
The Dollar is staging an impressive rebound against a basket of major currencies with prices trading marginally above 96.85 as of writing.
It seems bulls have shrugged off recent dovish remarks by Federal Reserve officials and speculation over the Fed raising rates slower than expected in 2019. The primary driver behind the Dollar’s appreciation is likely based on confidence over the US economy and the fact that the Fed remains as one of the more hawkish major central banks. With interest rate differentials in favour of the Dollar and safe-haven demand supporting upside gains, the outlook remains fundamentally bullish. In regards to the technical picture, the Dollar Index is bullish on the daily charts with 97.00 acting as the first point of interest.
Oil tumbles to one-year low on oversupply concerns
It has been a brutally bearish trading week for Oil prices with Brent Crude and WTI Oil both crashing to a fresh yearly low this morning thanks to oversupply concerns and global growth fears.
The truth of the matter remains that rising global Crude supply coupled with worrying signs of slowing demand have written a recipe for disaster for the Oil markets. With an appreciating Dollar rubbing salt into the wound, the outlook for Oil prices points to further downside. Although OPEC is expected to cut Oil production at its meeting in early December, Oil bears are clearly unfazed and this continues to be reflected in price action. Focusing on the technical perspective, WTI Oil has scope to depreciate towards $50 a barrel in the near term.
Commodity spotlight - Gold
Gold experienced a heavy depreciation during Friday’s trading session mostly due to an appreciating US Dollar.
The price action witnessed in recent weeks confirms how the Dollar always has the final say in where the yellow metal trades. Although the unfavourable market conditions and geopolitical risk factors have attracted investors towards safe-haven Gold, the precious metal remains governed by King Dollar. When taking a look at the technical picture, there is a strong resistance at $1,228. Sustained weakness below this level could inspire a move back down towards $1,218.
Pound Dips as Brexit Drama Continues
GBP/USD has posted losses in the Friday session. In North American trade, the pair is trading at 1.2832 down 0.34% on the day. It’s a quiet end to the week, with no British events. The U.S will release manufacturing and services PMIs, both minor events.
With the Brexit clock ticking down towards the March deadline, we can expect more volatility from the British pound. The drama continues on Sunday, as Prime Minister May and EU leaders are scheduled to sign a withdrawal agreement in Brussels at a special Brexit summit. Still, uncertainty abounds, as the post-Brexit relationship between the parties remains unclear. Some EU members feel that Britain is getting too sweet a deal, and Spain has warned it could veto the deal unless it has more of a say over any agreement concerning Gibraltar. A solution to the Irish border issue has proved elusive, although everyone seems to agree that a hard border between Ireland and Northern Ireland is not an option.
Back home, Prime Minister May will have an uphill battle pushing the deal through parliament, with the Labor party and many Conservative MPs set to vote against the deal. May has argued that the withdrawal agreement is better than a no-deal scenario, but both sides remain ready for this worst-case possibility. On Friday, German finance minister Olaf Scholz warned that a no-deal Brexit would cause significant economic harm to both sides, adding that Germany was prepared for such an outcome.
Is the U.S. economy headed for a slowdown? The markets have grown accustomed to strong economic numbers from the U.S, but quarterly GDP releases have been softening, and there has even been talk of a recession. This has led to speculation that the Federal Reserve could ease up on its interest rate hikes next year. Only a few weeks ago, there were expectations that the Fed could raise rates each quarter in 2019, but the mood has become more cautious. The U.S.-China trade war has caused a slowdown both economies, and President Trump’s $1.5 trillion tax cut has boosted the economy, but its effect on the economy is fading. A rollback in U.S rate hikes would make the greenback less attractive to investors, which would be bullish for other currencies such as the British pound.
Trade War Between China And The U.S. Will Hit Global Growth
Steep losses in Chinese share markets dented Asian equities on Friday as lingering trade war tensions and weak corporate earnings in Europe added to worries about global growth. With U.S. markets closed overnight for Thanksgiving and Japan on holiday on Friday, early trading lacked direction until the sell-off in China brought on more pain for stock investors in the region.
Shares in Europe, in contrast, are expected to rise Friday. Financial spreadbetters expect London’s FTSE .FTSE, Frankfurt’s DAX .GDAXI and Paris’ CAC .FCHI to advance 0.3 percent each. MSCI’s broadest index of Asia-Pacific shares outside Japan .MIAPJ0000PUS fell 0.23 percent as Chinese blue-chips .CSI300 tumbled 2 percent and the Shanghai Composite index .SSEC lost 2.2 percent.
China’s markets have been mired in a slump as the country’s trade war with the United States has exacerbated worries about slowing growth. Few analysts expect sustained improvement for Chinese shares even if U.S. and Chinese leaders make progress in mending ties at a G20 meeting in Argentina at the end of the month. Seoul’s Kospi .KS11 ended 0.6 percent lower and Taiwan shares .TWII lost 0.5 percent. Hong Kong’s Hang Seng .HSI was down 0.6 percent in afternoon trade.
A draft deal between Britain and the European Union on future relations reached late Thursday did little to lighten the mood. China’s yuan CNY=CFXS fell to 6.9386 per dollar, with trade concerns weighing. The currency has also come under pressure in recent weeks in sympathy with falling Chinese rates, with yields on shorter-term Chinese government bonds below their U.S. counterparts.
In commodities markets, oil prices hit 2018 lows as U.S. inventories rose to their highest level since December, adding to concerns about a global crude glut. U.S. crude CLc1 was trading down 2.5 percent at $53.24 after coming within 5 cents of an October 2017 low reached earlier in the week. Brent crude LCOc1 futures hit their lowest since December 2017 at $61.52 per barrel, and were last down 1.2 percent at $61.85 a barrel.
WTI Oil Outlook: Oil Hit New 2018 Low On Friday
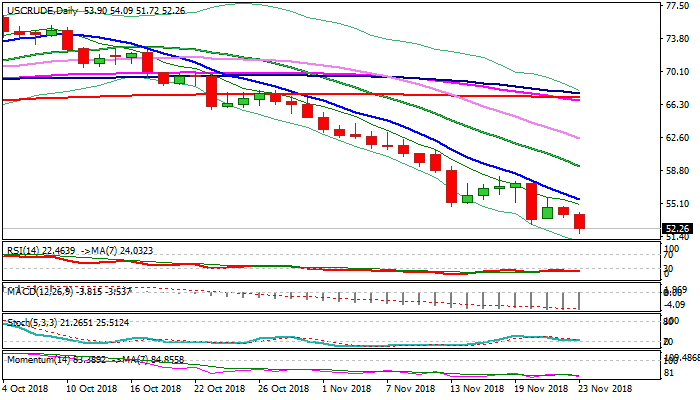
WTI oil remains in a free fall and fresh bearish acceleration on Friday hit new 2018 low at $51.72 (the lowest in thirteen months).
Fears of oversupply in oil market as forecasts for 2019 show the supply is going to exceed demand and global growth slowdown which could also strongly impact demand, are the key factors that keep oil prices under strong pressure.
WTI contract was down 5% in Asia and half of the European session, with mild recovery to be expected on oversold techs and week-end profit-taking.
Bears so far showed little reaction on signals that OPEC and Russia may start reducing the output in order to balance oil market.
Overall bearish outlook is expected to remain intact while the price holds below falling 10SMA ($55.54) and would keep in focus targets at $50.26/00 (Fibo 76.4% of $42.04/$76.88 / psychological support).
Break and close above 10SMA would sideline immediate downside risk, but stronger signals of correction would require extension and close above falling 20SMA ($59.31) and psychological $60.00 barrier.
Res: 54.09, 54.80, 55.53, 57.43
Sup: 51.72, 51.00, 50.26, 50.00
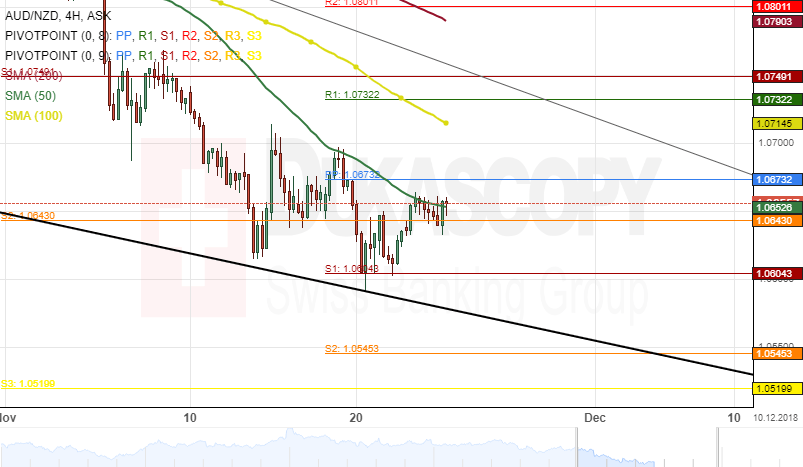
AUD/NZD 4H Chart: Decline Continues
The Australian Dollar has been trading in several descending channels against the New Zealand Dollar. The most important of the channel pattern is a three-month descending channel which was formed on August 9 and has guided the currency pair to a seven-month low at 1.0604.
The exchange rate was trading near the lower boundary of the three months descending channel pattern at 1.0643 during the morning hours of Friday's session.
Given that the three SMAs is above the price level, it is likely that the overall downwards movement might continue during the following trading sessions.
The potential target for the currency exchange rate will be at a support level formed by the weekly S2 at 1.0545.
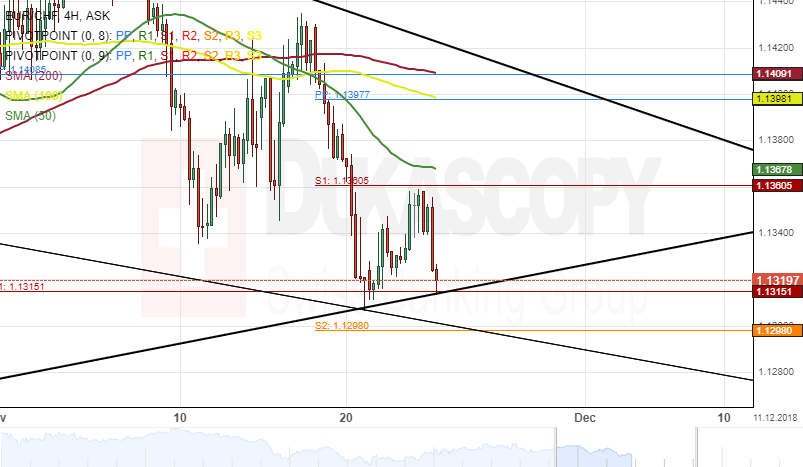
EUR/CHF 4H Chart: Bearish Sentiment Likely To Continue
The common European currency is trading in several channels patterns against the Swiss Franc. The most important of the pattern is the two-month ascending channel formed on September 12.
During the past week, the price level has surpassed the three SMAs and has reached the lower boundary of the two months ascending channel pattern at 1.1298.
Given that the 50-, 100-, and 200-hour simple moving averages are above the current price level, this could suggest that the decline of the EUR/CHF currency exchange rate will continue during the following trading sessions.
Canadian Inflation And Retail Sales Due As Loonie Tests Trendline
Canada's latest inflation and retail sales figures will hit the markets on Friday at 1330 GMT. Investors appear rather confident the BoC will raise rates again in January, and an overall strong set of prints could solidify such expectations further, perhaps helping the battered loonie to recover some lost ground. That said, until oil prices stabilize, any rebounds in the loonie may remain short-lived.
Canadian inflation as gauged by the Consumer Price Index (CPI) is expected to have risen by 2.2% on an annual basis in October, the same pace as previously. Underlying measures of inflation – core, trimmed mean, and weighted CPIs – will also be released, though no forecast is available for any of these. Meanwhile, retail sales are forecast to have grown by 0.1% on a monthly basis in September, a rebound following a 0.1% drop in August. Excluding automobiles and parts that tend to be highly volatile, “core” retail sales are projected to have bounced by 0.3% m/m, after contradicting 0.4% previously.
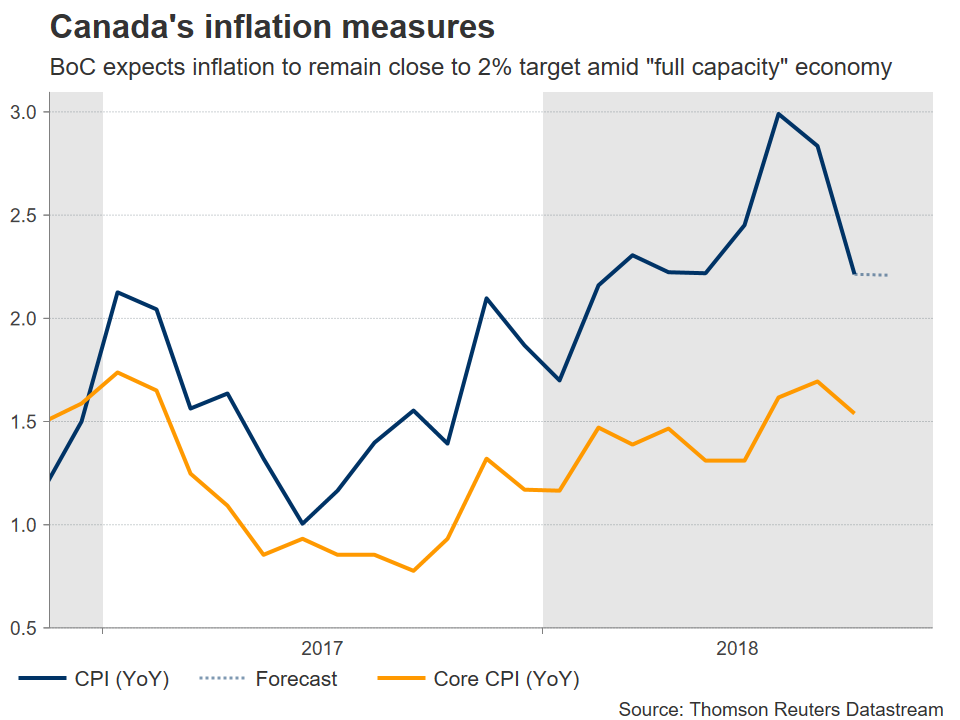
The Bank of Canada (BoC) assumed a more confident tone when it raised rates at its latest gathering in October, dropping a reference that future hikes will be gradual, as the US-Canada trade agreement alleviated uncertainty and brightened the outlook for the domestic economy. Investors currently expect the BoC to stand pat when it meets again in December, assigning a mere 22% probability for a 25bps rate increase at that meeting, according to implied odds derived from Canada's overnight index swaps. That said, market participants appear much more confident such action will occur at the January gathering, where a hike is currently priced in with a 75% likelihood.
An overall strong set of data that enhances further the case for a January rate increase could help the loonie to recover. Looking at dollar/loonie technically, a downside move that causes the pair to break below the uptrend line drawn from the lows of October 1 could encounter support near the 1.3125 zone, which halted the drop on November 16. A downside break could open the way for the 1.3050 area; notice that the 50-day simple moving average (SMA) is not far above, at 1.3059. Even lower, buy orders may be found near the October 24 low, at 1.2965.
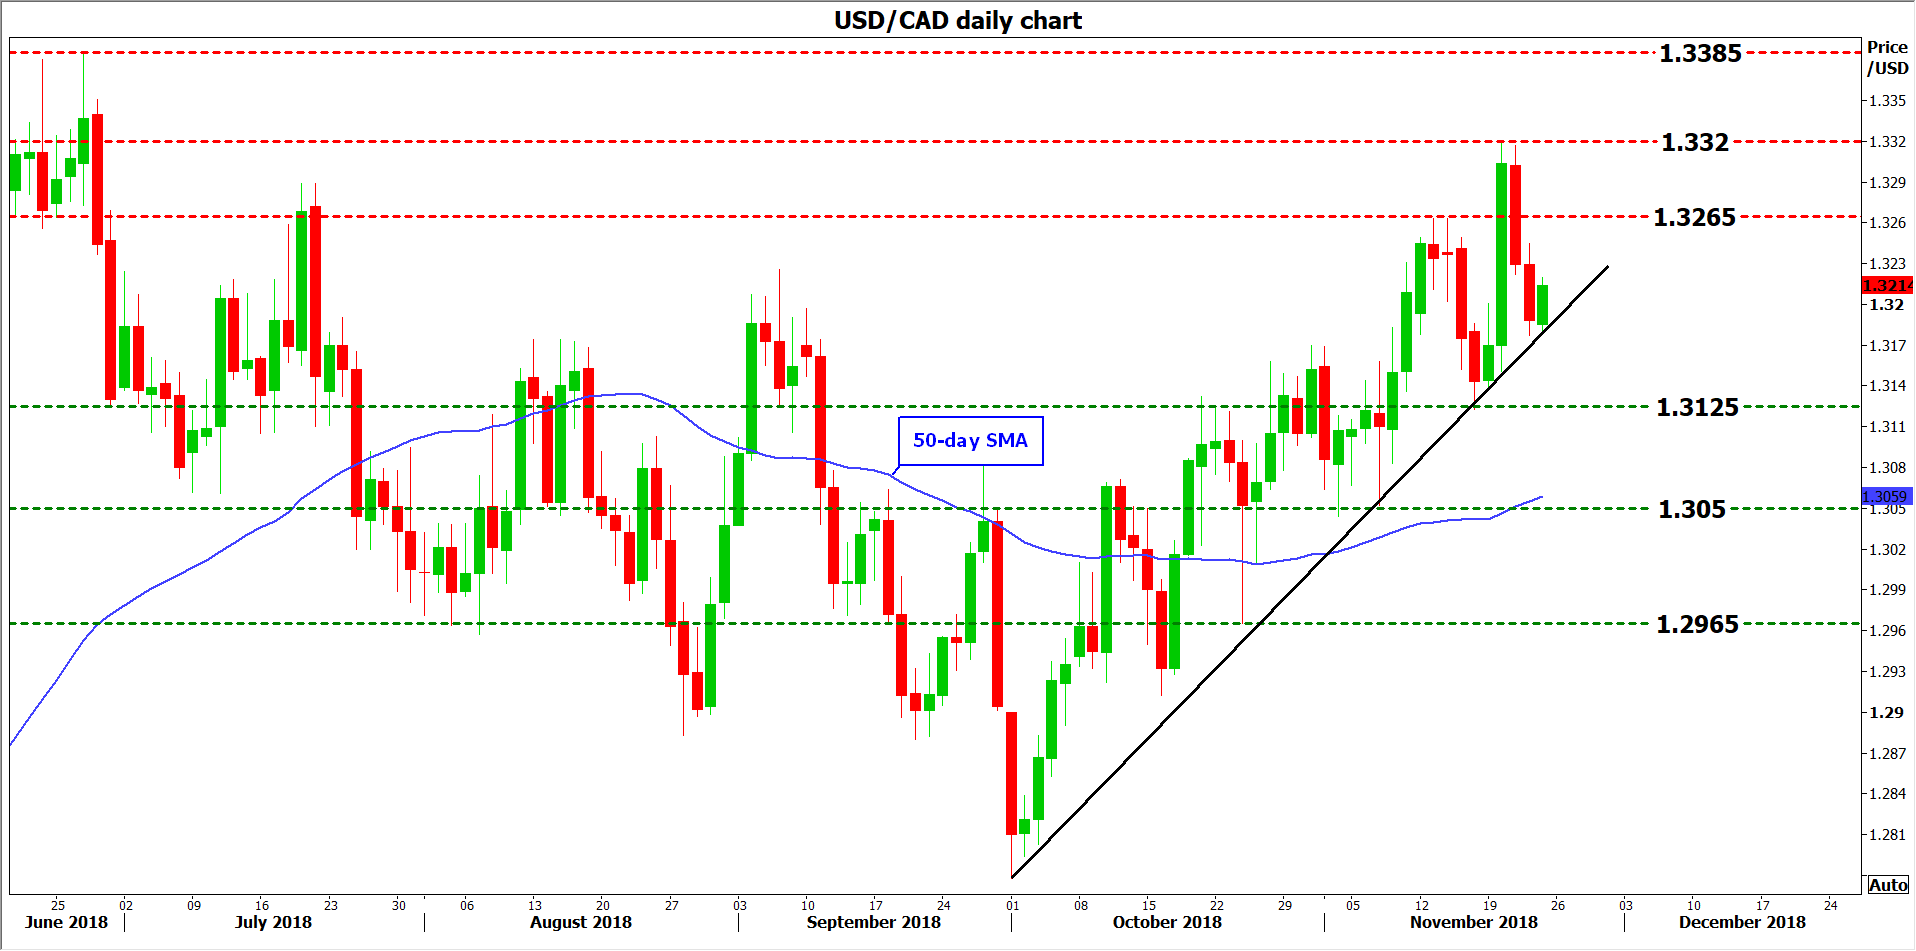
On the flipside, disappointing figures that scale back expectations for a near-term BoC move could bring the loonie under renewed selling interest. In such a case, resistance to advances in dollar/loonie may come at 1.3265, the hurdle that capped the surge on November 13. An upside break could see scope for a test of the November 20 peak at 1.3320. Higher still, the June high of 1.3385 would increasingly come into view.
In the bigger picture, besides monetary policy considerations, the performance of oil prices will also be a major determinant for the loonie; recall that Canada is a major oil producing economy. Indeed, one of the biggest factors behind the currency's latest underperformance has been the collapse in crude prices, and as long as it continues, any rebounds in the loonie – on the back of encouraging data for instance – could remain relatively short-lived.
London Gas Oil Futures Plunge To 8-Month Low, Bearish Bias In Short Term
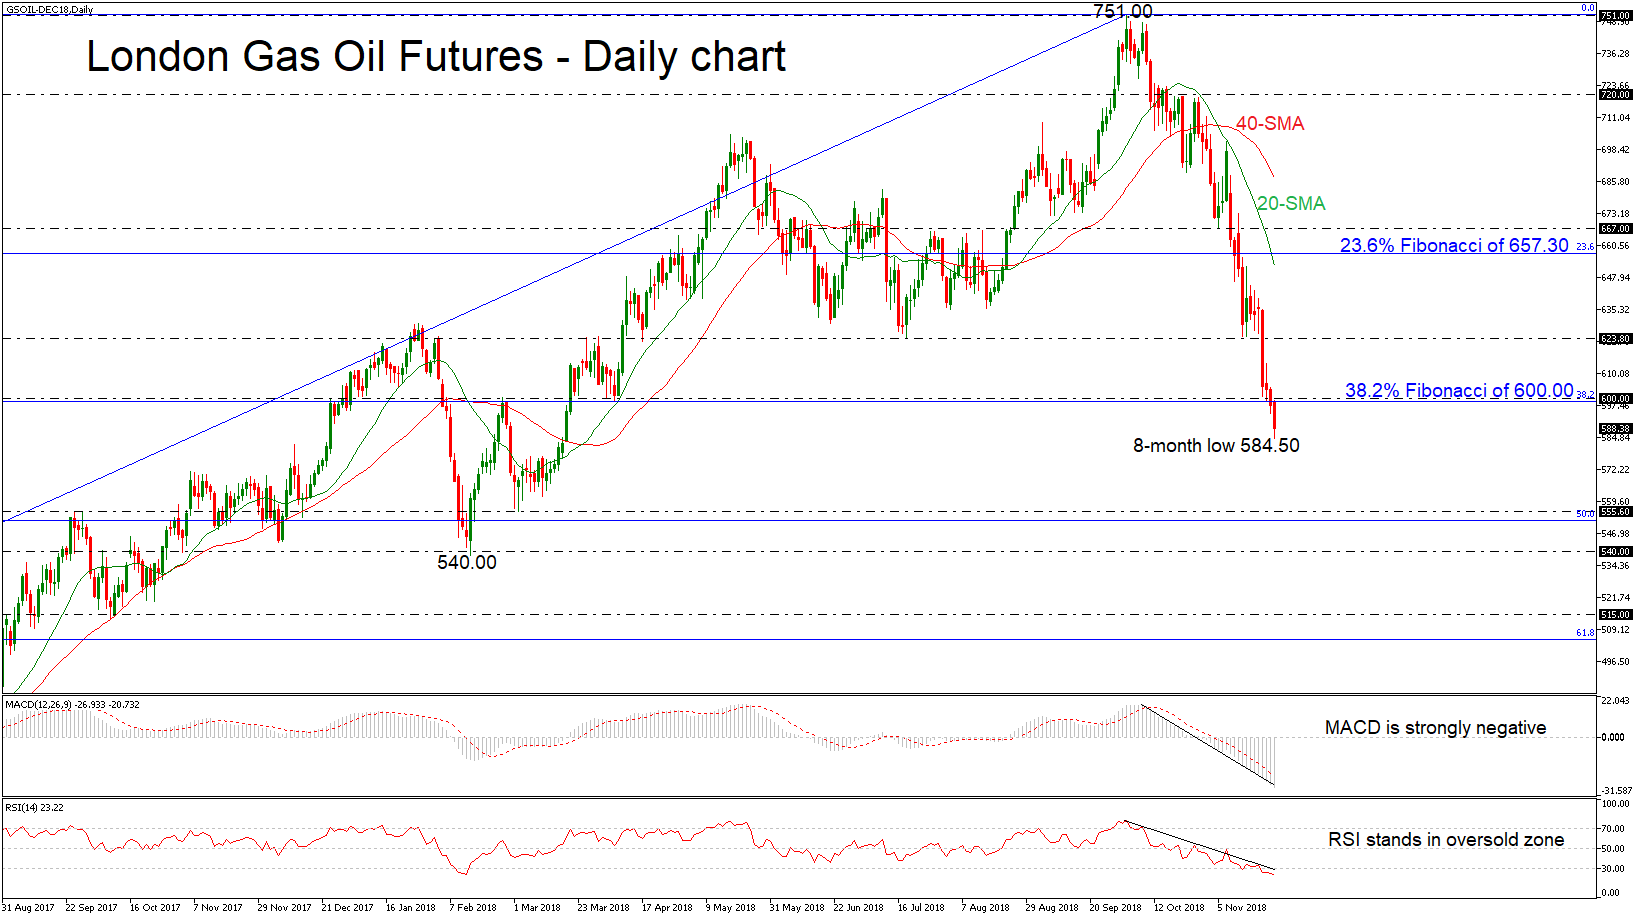
London Gas oil futures have been underperforming in the past six days, breaking below the 38.2% Fibonacci retracement level of the upleg from 352.63 to 751.00, around the 600.00 handle, recording a fresh eight-month low of 584.50.
Momentum indicators are endorsing the sharp bearish movement as the MACD is strengthening its negative momentum in the negative area and the RSI holds below the oversold zone.
The next target to the downside is the 555.60 support, which stands near the 50.0% Fibonacci mark. Falling below this area would help traders to move towards the 540.00 hurdle.
Upside moves are likely to find resistance at 600.00 before climbing until the 623.80 barrier. Clearing this key level would see additional gains towards the 23.6% Fibonacci mark of 657.30, standing slightly above 20-day simple moving average (SMA).
Concluding, the price seems to be strongly negative in the short-term, however, looking at the long-term view, it has been facing a bullish structure since July 2016.