Sample Category Title
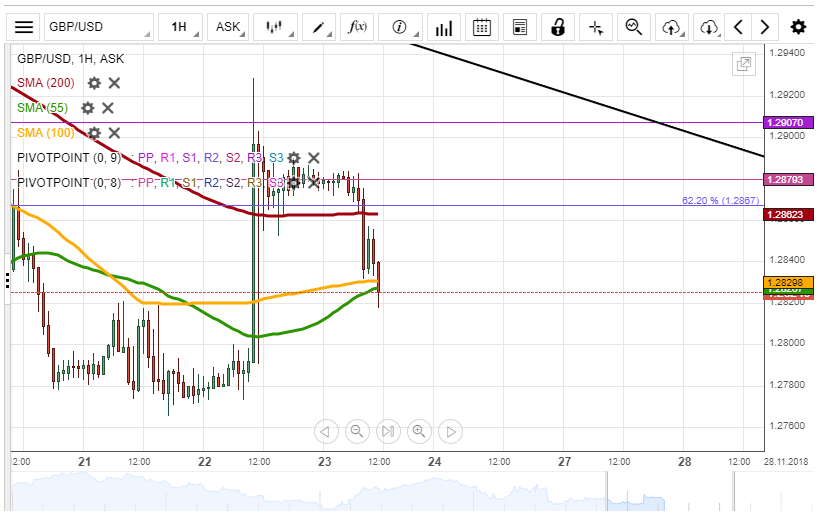
GBP/USD Trades Between SMAs
During Thursday's trading session, the currency exchange rate appreciated by 139 pips or 1.07% to end the trading session at the 1.2874 mark. On Friday morning, the British Pound was trading between the 200-hour and the 100-hour simple moving averages at the 1.2852 mark.
In regards to the near-term future, in all likelihood, the British Pound will trade upwards to break the 62.20% Fibonacci retracement level at 1.2867 to trade at the 1.2900 level. The 55-hour and the 100-hour simple moving averages will support the surge during the trading session on Friday.
However, the 200-hour SMA together with the resistance of the 62.20% Fibo could retrace the British Pound to trade downside to the 1.2800 level.
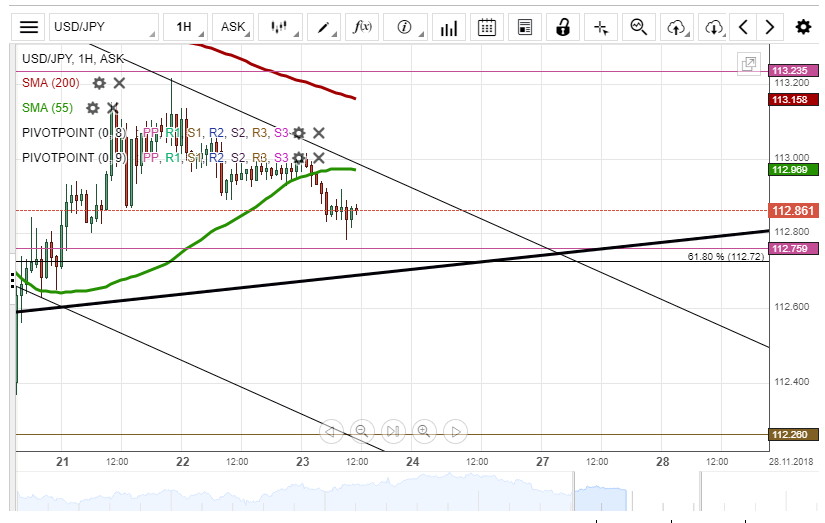
USD/JPY Will Move Downwards
During Thursday's trading session, the currency exchange rate was testing the monthly pivot point at 112.96 to end the trading session at the 112.96 mark. During Friday morning hours, the US Dollar was supported by the 100-hour simple moving average to trade at the 112.81 mark.
In regards to the near-term future, the US Dollar will move downwards to meet the large ascending pattern line at the 112.72 mark. Afterwards, most likely, the US Dollar will trade sideways to stay at the 112.60 level during the trading session.
However, the US Dollar could pass through the supports of the large ascending pattern line and the 61.80 % Fibo at 112.72 to move downwards to trade at 112.40.
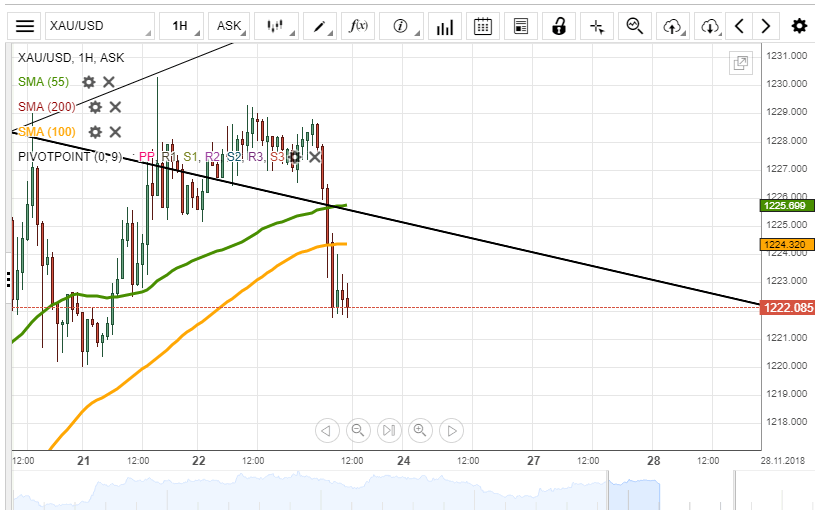
XAU/USD Trade At Small Pattern
During Thursday's trading session, the yellow metal was trading above the resistance of the descending small pattern line at 1,228.00 level to end the trading session at the 1,226.88 mark. On Friday morning, the gold depreciated by 694 pips or 0.57% to trade inside the small descending pattern at the 1,223.37 mark.
In regards to the near-term future, most likely, the gold will trade sideways to stay at the 1,220.00 level during the day. The 100-hour simple moving average will not allow the yellow metal to surge on Friday.
On the other side, the yellow metal could break the resistance of the small descending pattern line at 1,225.00 level to trade at the 1,226.00 level
European update: Euro pressured by weak PMI, Aussie and Kiwi tumble as Chinese stocks dive
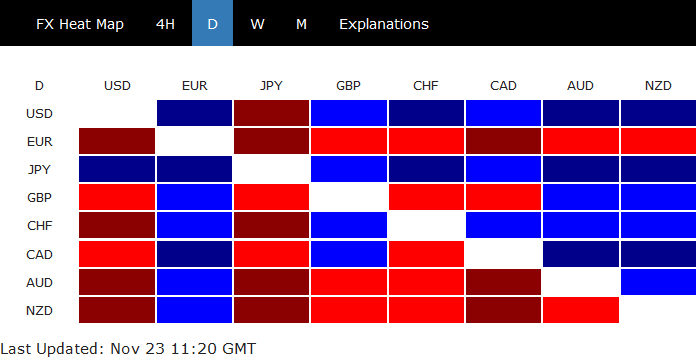
Euro, New Zealand and Australian Dollars are the weakest ones for today so far, for different reasons. Euro is clearly weighed down by weak PMI data. Eurozone PMI composite dropped to 47-month low of 52.4. Markit also suggested that the weakness in Q3 may not be a just a blip. And, risks to growth outlook have beome increasingly skewed to the downside. EUR/USD's break of 1.1358 minor support would bring send the pair back to 1.1215 low next.
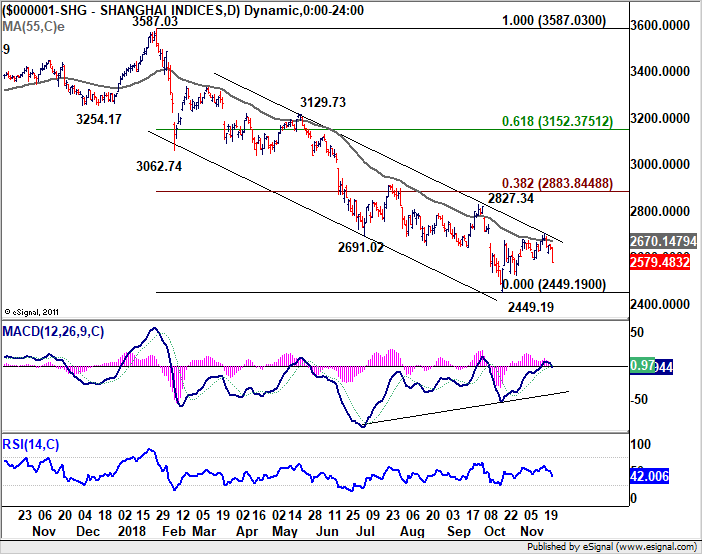
Aussie and Kiwi are, on the other hand, pressured by selloff in Chinese stocks. The China Shanghai SSE dropped -2.49% to 2579.48. Looking at the SSE daily chart, the rejection from 55 day EMA and medium term falling channel resistance could now set the stage for a retest on 2449.19 low at least.
Staying in the currency markets, for now, Yen and Dollar are the strongest ones.
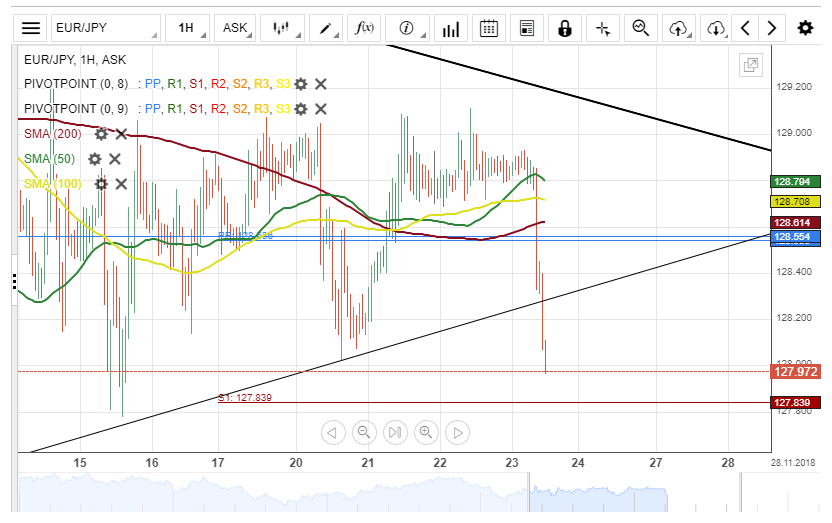
EUR/JPY Strong Bearish Sentiment Today
The common European currency traded sideways against the Japanese Yen on Thursday. The currency pair trading range during the previous session was between 129.08 and 128.68.
Friday's trading session begins with a strong bearish momentum, and by the middle of the day, the exchange rate has depreciated by about 58 base points.
Technical indicators on the daily time frame suggest that the decline for the currency exchange rate is likely to continue within this session.
If the decline continues, a possible breakout through the lower boundary of an uptrend line is likely today.
AUD/USD To Trade Sideways
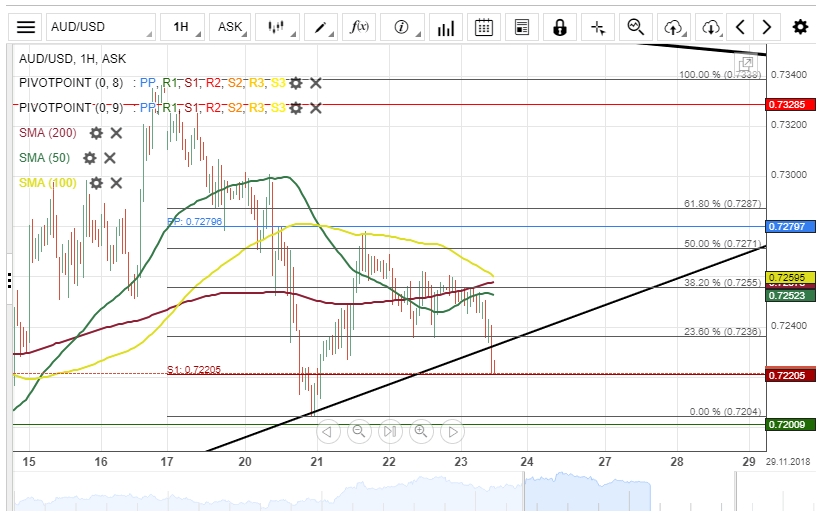
The Australian Dollar traded with low volatility against the US Dollar on Thursday. The currency pair was moving along the 50– and 200-hour SMAs during Thursday's trading session.
The exchange rate was bouncing between the 38.20 % and 23.60% Fibonacci retracement level during the morning hours of Friday's session. This retracement can be measured by connecting the November 16 high level at 0.7340 and the low mark of 0.7204.
It is likely that the currency exchange rate will continue bouncing between yesterday's trading range within this session, as technical indicators flash mixed signals.
USD/CAD Tests Resistance Clusters
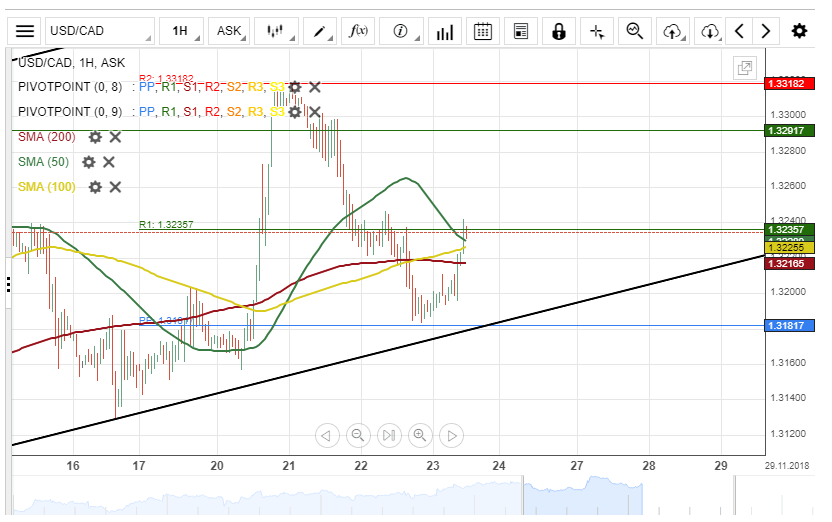
The US Dollar depreciated about 65 base points against the Canadian Dollar on Thursday. The decline was temporarily stopped by weekly PP at 1.3181.
The exchange rate was trading near a resistance cluster formed by the 100– and 200-hour SMAs during the first part of Friday's session.
If this cluster holds, the currency exchange rate will continue its bearish movement within this session.
On the other hand, if the rate passes the resistance cluster as mentioned earlier, the next target for bullish traders will be near the monthly pivot point at 1.3291 today.
NZD/USD Bearish Sentiment Today
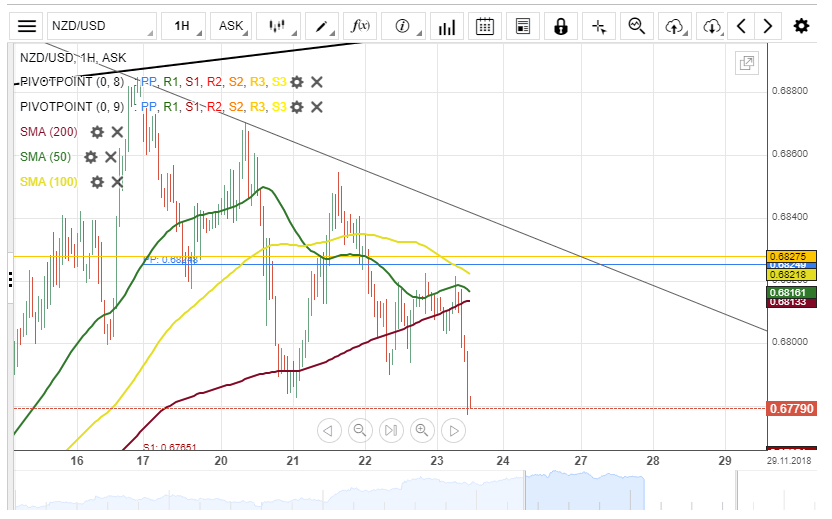
The New Zealand Dollar depreciated about 45 base points against the US Dollar on Thursday.
Friday's session begins with a bearish sentiment, and by the middle of the day, the currency pair has dropped about 30 base points of its values.
Given that the three SMAs is above the current price level, it is likely that the decline could continue during the following trading session.
Furthermore, technical indicators flash bearish signals on the 4(H) time frame today.
USD/CAD – Canadian Dollar Edges Lower Ahead Of Canadian CPI, Retail Sales
The Canadian dollar has edged lower in the Friday session, erasing the gains seen on Thursday. Currently, USD/CAD is trading at 1.3237, up 0.34% on the day. On the release front, Canada releases key consumer inflation and spending data. CPI is expected to post a small gain of 0.1%, after two straight declines. Core retail sales is forecast to gain 0.3% and retail sales is expected at 0.1%. The U.S. will release services and manufacturing PMI reports.
A tumultuous week on global stock markets caused plenty of jitters for investors. That translated into bad news for the Canadian dollar, as risk appetite waned. The Canadian currency was down as much as 1.3% earlier this week, but has recovered some of these losses after stock markets reversed directions and moved higher. The rout was triggered by a sharp drop in technology stocks, as the ongoing tariff war between the U.S. and China has put a damper on global growth. The stakes are high, as the markets hope for a breakthrough at the G20 summit in Argentina next week, when President Trump meets with Chinese leader Xi Jinping. If the two leaders can lower trade tensions between the U.S. and China, the Canadian dollar could respond with gains.
The markets have grown accustomed to strong economic numbers from the U.S, but quarterly GDP reports point to a slowdown, and there has even been talk of a recession. This has led to speculation that the Federal Reserve could ease up on its interest rate hikes next year. Only a few weeks ago, there were expectations that the Fed could raise rates each quarter in 2019, but the mood has become more cautious. The U.S.-China trade war has caused a slowdown both economies, and President Trump’s $1.5 trillion tax cut has boosted the economy, but its effect on the economy is fading. A rollback in U.S rate hikes would make the greenback less attractive to investors, which would be good news for the Canadian dollar.
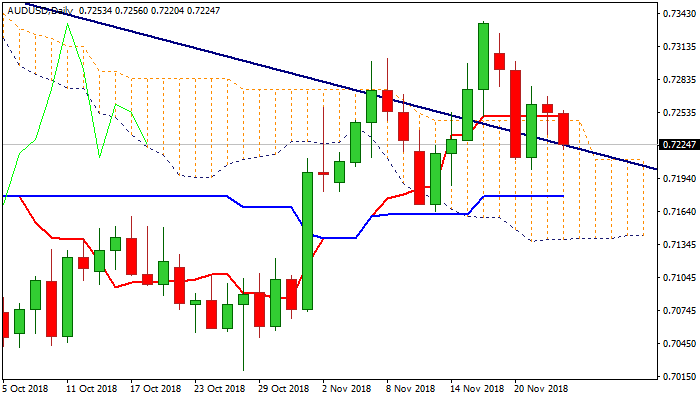
AUDUSD Outlook: Fresh Bearish Acceleration Could Extend On Break Below Pivotal Supports At 0.7215/02
The Australian dollar fell on Friday, driven by strong fall in China's stocks on rising concerns over China's growth and doubts whether US President Trump and China's Xi could reach the deal and prevent the escalation of persisting trade conflict in their next week's meeting. Thursday's close in red and Friday's extension lower which returned to daily cloud (cloud top lays at 0.7247) weakened near-term structure. Studies on lower timeframes turned to full bearish mode while momentum on daily chart is heading south and about to break into negative territory, adding to negative outlook. Fresh bears pressure key support at 0.7215/02 (Fibo 38.2% of 0.7020/0.7335, reinforced by rising 20SMA/21 Nov trough), with break and weekly close below, to risk deeper fall and unmask supports at 0.7174/64 (55SMA/13 Nov higher low). Broken daily Tenkan-sen (0.7250) is expected to cap upticks.
Res: 0.7250, 0.7277, 0.7300, 0.7335
Sup: 0.7215, 0.7202, 0.7174, 0.7164