

Sample Category Title
USTR: China has not fundamentally altered its unfair practices
The US Trade Representative released an update on Section 301 IP investigation on China yesterday. Less than two weeks ahead of the Trump-Xi meeting as sideline of G20 summit in Argentina, USTR is piling more pressure on China for reforms. In short, the report complained that "China has not fundamentally altered its unfair, unreasonable, and market-distorting practices that were the subject of the March 2018 report on our Section 301 investigation."
The report also noted that "despite repeated U.S. engagement efforts and international admonishments of its trade technology transfer policies, China did not respond constructively and failed to take any substantive actions to address U.S. concerns." And, China, "made clear – both in public statements and in government-to-government communications – that it would not change its policies in response to the initial Section 301 action." The report also said "China largely denied there were problems with respect to its policies involving technology transfer and intellectual property".
EUR/JPY Approaching Next Crucial Break
Key Highlights
- The Euro found support near 127.50 and recovered recently against the Japanese Yen.
- There is a major breakout pattern formed with resistance at 128.85 on the 4-hours chart of EUR/JPY.
- The US Housing Starts Change came in at +1.5% in Oct 2018, better than the +0.5% forecast.
- Today, the US Durable Goods Orders for Oct 2018 will be released, which is forecasted to decline 2.5%.
EURJPY Technical Analysis
After a major decline, the Euro found support near 127.50 against the Japanese Yen. The EUR/JPY pair recovered above 128.00 and 128.50, but it faced a strong resistance near the 129.00 zone.
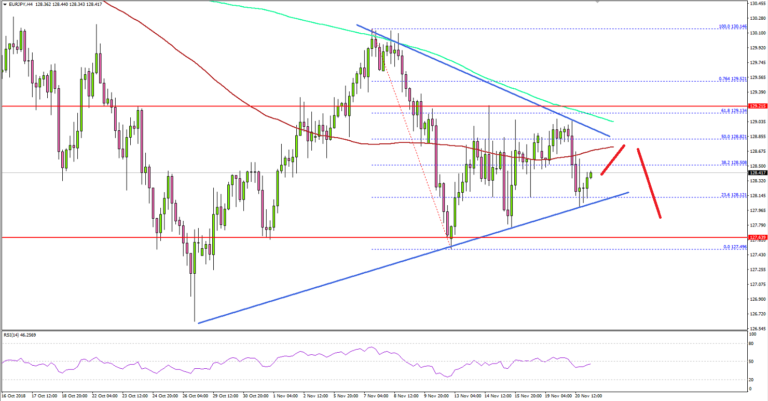
Looking at the 4-hours chart, the pair gained traction above the 128.00 resistance and traded above the 100 simple moving average (red, 4-hours). The upside move was positive since the pair broke the key 128.80 resistance.
There was also a break below the 50% Fib retracement level of the last decline from the 130.14 high to 127.49 low. However, the upside move was capped by 129.00 and a connecting bearish trend line.
At the outset, it seems like there is a major breakout pattern formed with resistance at 128.85 on the same chart. Therefore, the pair could either break above 129.00 or decline towards 127.50 in the near term.
Above 129.00, the pair could trade towards 129.50 and the 76.4% Fib retracement level of the last decline from the 130.14 high to 127.49 low. Above 129.50, buyers could push the pair towards 130.00.
Alternatively, if the pair fails to clear the 129.00 resistance, it could decline back towards the 127.50 support area. Further below 127.50, the next major main support is near the 126.80 level.
Looking at major pairs, EUR/USD struggled to clear the 1.1450-70 resistance area and GBP/USD is still trading below the key 1.2900 resistance area.
Economic Releases to Watch Today
- US Initial Jobless Claims – Forecast 2153K, versus 216K previous.
- US Existing Home Sales for Oct 2018 (MoM) – Forecast +1.0% versus -3.4% previous.
- US Durable Goods Orders for Oct 2018 – Forecast -2.5% versus +0.8% previous.
GOLD Turns Lower On Price Failure, Threatens Further Weakness
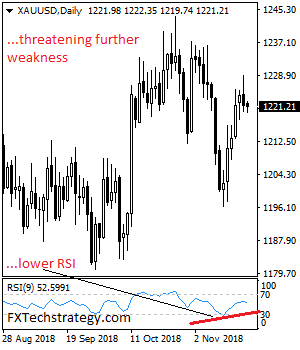
GOLD turns lower on price failure as it threatens further weakness. On the downside, support comes in at the 1,210.00 level where a break will turn attention to the 1,200.00 level. Further down, a cut through here will open the door for a move lower towards the 1,190.00 level. Below here if seen could trigger further downside pressure targeting the 1,180.00 level. Conversely, resistance resides at the 1,230.00 level where a break will aim at the 1,240.00 level. A turn above there will expose the 1,250.00 level. Further out, resistance stands at the 1,260.00 level. All in all, GOLD looks to weaken further lower.
Daily Markets Broadcast
Wall Street tumbles further
All US indices declined yesterday, led by continued weakness in the tech sector, disappointing earnings warnings from the retail sector while a collapse in oil prices to one-year lows pressured the energy sector.
US30USD Weekly Chart
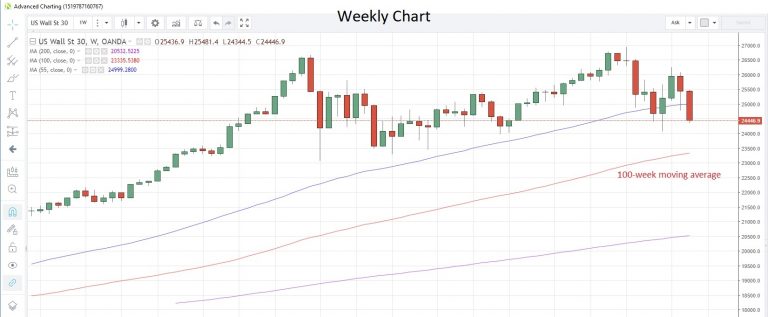
The US30 fell the most in more than a month yesterday, pressured by weakness across the tech, retail and energy sectors
The two-day drop has so far failed to take out last month’s low. The 100-week moving average is at 23,335
US October durable goods orders are due today. The ex-transportation reading is expected to expand 0.4% following a 0.1% gain in September.
DE30EUR Monthly Chart
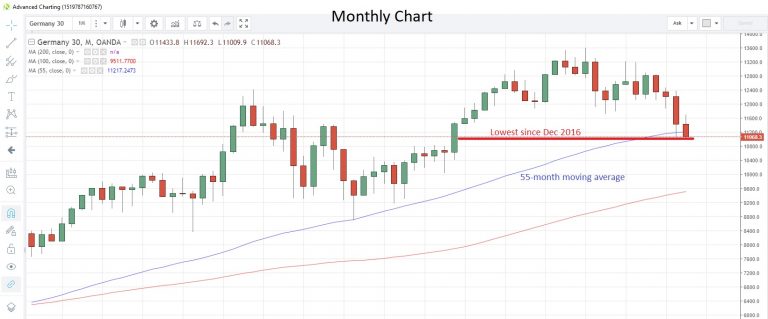
The Germany30 index fell for a third straight day, echoing the mood on Wall Street
The index hit the lowest level in almost two years and looks poised to sustain the breach below the 55-month moving average at 11,217
The EU Commission’s response to the Italian budget draft is due today. Italy’s Deputy PM said he is open to discussions on the budget, and might agree to some cuts, but wants to keep proposed reforms in place.
WTICOUSD Weekly Chart
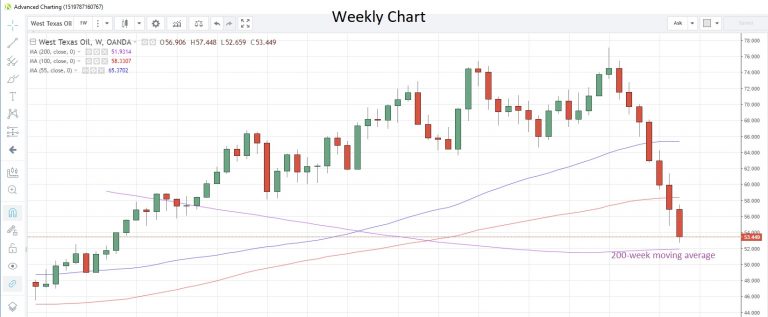
WTI crashed below $53 per barrel for the first time in a year on concerns that planned OPEC production cuts would not be enough to stem a global glut amid an expected weakening in demand
WTI could test the 200-week moving average support at $51.93
EIA crude oil stocks for the week ended Nov 16 are due today. Last week saw a build of 10.27 million barrels, the most since Feb 2017. Another strong increase would pressure oil prices further.
A Crude Session For Oil
Oil markets
Whatever the semblance of support was at $55 WTI, was sliced through like a hot knife through butter as a brutal combination of events continues to weigh on prices.
At the heart of the matter is the lack of market respect for OPEC rhetoric regarding deep production cuts that have been completely ignored as the market now question if the projected reduction would be entirely sufficient to rebalance markets given the expected glut in Q1.
But mercilessly for the producer, the oil gusher came to a halt as, after a run of 6 consecutive weeks of builds, the American Petroleum Institute (API) reported a surprise crude oil inventory draw, while inventories in Cushing climbed at a much slower pace than expected.
But beyond the obvious OPEC machinations, the most brutal time of today’s sell-off concurred with risk assets melting on the back of a global economic slowdown which has now broadened to include the United States after the Federal Reserve Board raised concerns about a possible economic downturn in 2019. But let’s face China’s economic outlook remain weak with the US-China trade war looking more likely to freeze over than thaw at this stage.
On the position side of the equation, the buy only community is being dwarfed by the systematic fund types that continue to increase short positions. The COT has been a sharp indicator for future price movements and tough to ignore.
So, in the back of vigorous global supplies, a stronger USD weighing on prices slowing EM demand plus the flat-out denomination effect along with Iran sanction waivers have put Oil Bulls in a world of pain who are now left praying for harsh Northern Hemisphere winter to drive prices higher.
Global equities
Global equity futures were flashing red on tech sector concerns, but this is a Macro train wreck unfolding in front of us. Trade war disarray post-APEC summit notwithstanding, but with Federal Reserve Board suggesting Trump administration fiscal stimulus will fade in 2019, there was no place to go but down for equities. It’s no longer a desynchronized global slow down but rather an expanding global growth sinkhole.
Also, investors are deeply concerned that Technology could be the US administration’s new battleground which would make trade wars look like a game of axis and allies as US administration is reportedly laying the groundwork for technology sector trade controls.
Currency markets
G-10 Currency markets are looking decidedly risk off as EURUSD dropped in fast order following on EURJPY heels on a nasty convergence of market agitator which continue to weigh on technology stocks and has the rest of equities complex joining the melt. The dollar gained momentum across the board as haven appeal kicked in.
Gold market
While the strong USD dented gold appeal, there is more than enough risk aversion permeating every pocket of the markets to keep a bid under gold prices. The Feds are on a dovish tack, this itself should offer good support for gold.
Eco Data 11/21/18
[php_everywhere instance="1"]
Today’s top mover: Failed double bottom in AUD/JPY? 81.24 a key level to watch
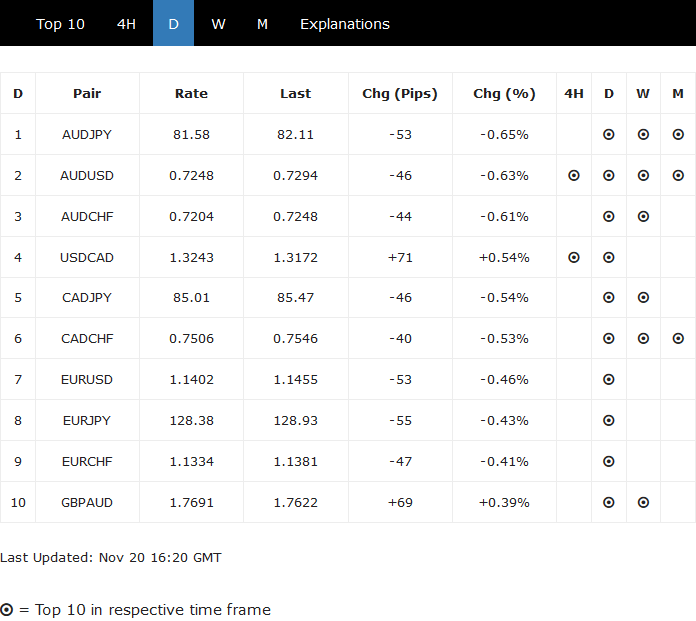
At the time of writing, AUD/JPY is the top mover for today. But it's actually a very tight race. Rightfully, in a day when risk aversion dominates, AUD/JPY's weakness is natural.
To put it into perspective, DOW hit as low as 24421.05 in initial trading. After a weak recovery, it's down -1.92% at 24539. It looks like DOW could have a take on 24000 handle before the week ends.
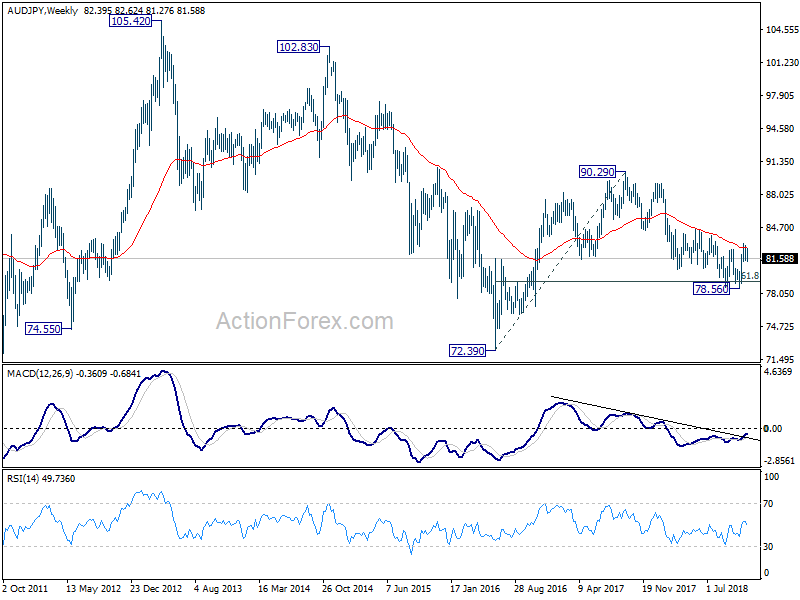
AUD/JPY's failure to sustain above 38.2% retracement of 90.29 to 78.65 at 83.02 raises serious doubt over the bullish scenario as discussed in a prior post here. If AUD/JPY has completed a double bottom reversal pattern (78.67, 78.56), the move after taking out 82.50 should be powerful. That's not what we've seen. And, focus is now back on 81.24 minor support. Break should confirm the rejection by 83.02 fibonacci level. Also, that would mark rejection by 55 week EMA. And, medium term bearishness would be retained and retest of 78.56 low should be seen next.
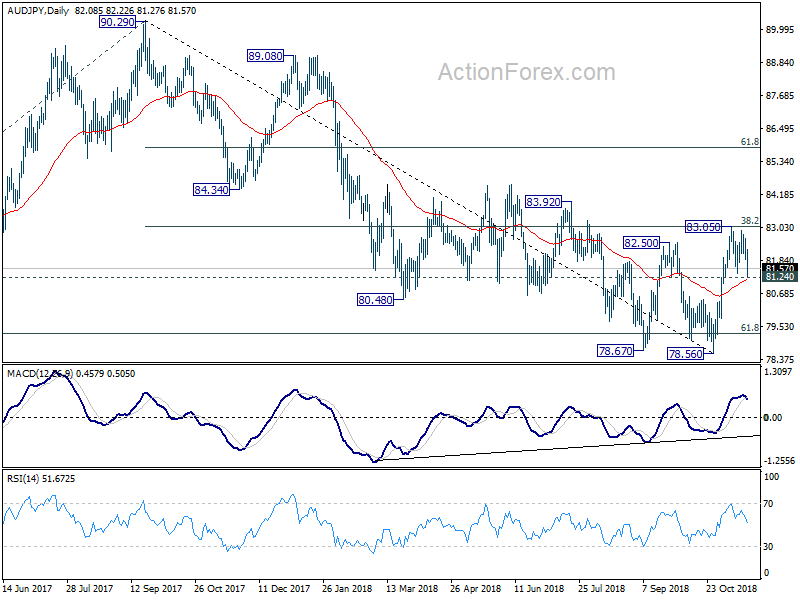
However, if AUD/JPY can defend 81.24 minor support. Firm break of 83.02 should confirm medium term reversal. Further rise should at least be seen to 61.8% retracement of 90.29 to 78.65 at 85.79. We'll see how it goes within a day or two, or even within hours.
Japanese Yen Subdued, US Housing Reports Match Estimates
The Japanese yen has ticked lower in the Tuesday session. In North American trade, USD/JPY is trading at 112.55, up 0.07% on the day. On the release front, market forecasts were on the button with U.S. construction numbers. Building Permits improved to 1.26 million and Housing Permits climbed to 1.23 million, as both indicators matched the forecasts. Later in the day, Japanese All Industries Activity is expected to post a sharp decline of 0.8 percent.
The ongoing trade dispute between the U.S. and China shows no signs of being resolved anytime soon, and the crisis is expected to have a negative impact on the economies of both countries. This does not bode well for the Japanese economy, which is heavily reliant on exports to both countries. An Asia-Pacific Economic Cooperation summit in Papua New Guinea ended in discord on Sunday, with leaders unable to agree on a final communique. U.S Vice President Mike Pence, who headed the U.S. delegation, was blunt in his remarks, saying that China would have to drastically change its trade practices before the U.S. would remove current tariffs on $250 billion in Chinese goods.
The Bank of Japan has no plans to alter its ultra-accommodative monetary policy, as inflation remains well below the BoJ target of around 2 percent. However, there have been negative side effects to this stance, primarily the toll on bank profits, which has raised concerns that banks might take excessive risks in order to recoup lost profits. BoJ Governor Haruhiko Kuroda addressed this issue on Monday, warning that risk management steps were needed in order to maintain the stability of the financial system and ensure that borrowing costs did not climb sharply.
WTI Hits New One-Year Low on Fresh Bearish Acceleration
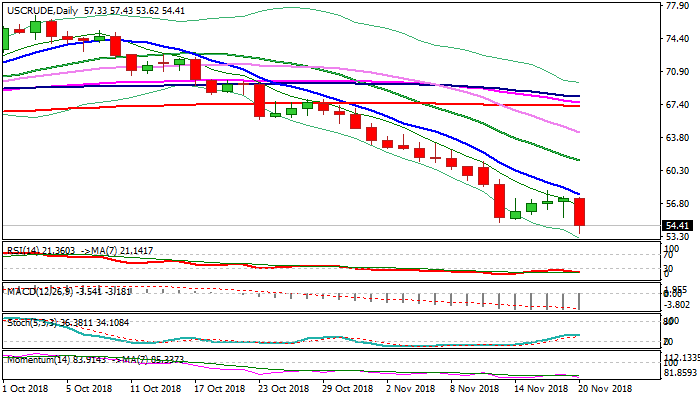
WTI oil price fell to the session low at $53.62 (the lowest since Oct 2017) in steep bearish acceleration in early US session trading on Tuesday.
US stocks were sharply lower on opening, pressured by poor forecasts from retailers and concerns in tech sector, causing turmoil in the markets.
The dollar was up against its major counterparts, sending commodity prices lower.
Crude price was already vulnerable after recovery attempts stalled and sentiment further soured on stronger greenback.
The oil remains under strong pressure on strong sell-off, driven by rising concerns about global oversupply and persisting US/China trade tensions which could escalate and dampen global demand for the energies.
Completion of near-term $54.74/$58.14 corrective phase signals continuation of larger downtrend, as oil price is on track to generate strong bearish signal on eventual close below key Fibo support at $55.35 (61.8% of $42.04/$76.88), which could open way towards psychological $50 support.
Res: 55.35; 57.43; 57.80; 59.33
Sup: 53.62; 52.84; 51.98; 50.26
Japanese Inflation to Hold Steady in October as BoJ Frets about Banks’ Profits
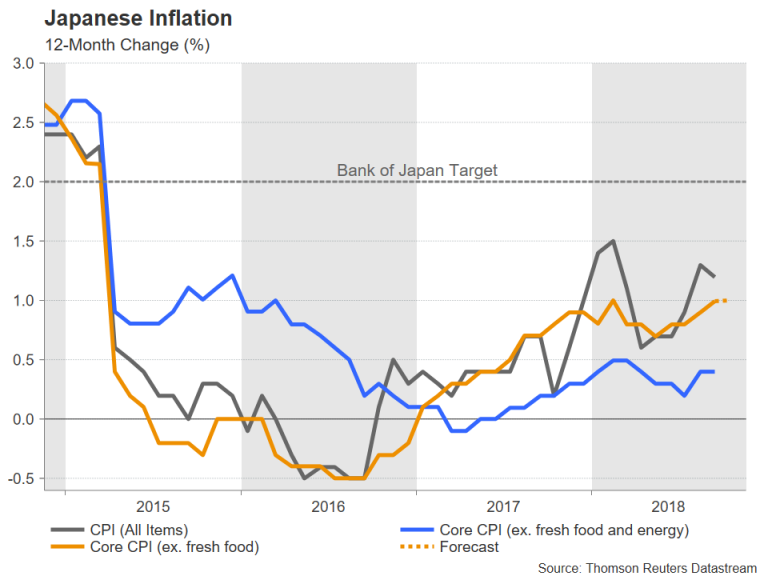
Inflation numbers are due out of Japan on Thursday (Wednesday, 23:30 GMT), with the core CPI rate anticipated to have held steady in October. But as the annual rate of inflation creeps up towards the Bank of Japan’s 2% target at a snail’s pace, the central bank is growing increasingly uneasy about the impact of its negative interest rate policy on the country’s financial system.
There’s likely to be little encouraging news on the inflation front for policymakers on Thursday as the consumer price index excluding fresh food prices is expected to remain unchanged at 1.0% year-on-year for October. While this particular measure of core inflation is what the BoJ officially targets, the Bank also keeps a close watch on the so-called ‘core-core’ rate, which excludes energy prices in addition to fresh foods. The ‘core-core’ rate stood at just 0.4% y/y in September, highlighting the non-existence of underlying prices pressures in the Japanese economy after years of ultra-loose monetary policy.
The Bank of Japan insists that it has no plans to exit from its unconventional massive stimulus program until inflation has reached its 2% goal. However, the Governor, Haruhiko Kuroda, and other BoJ board members have recently become more vocal about the possible negative impacts on the banking system from a protracted period of easy monetary policy and negative interest rates. Speaking in Tokyo on Monday, Kuroda warned that declining profits by banks could lead to risk taking, which would endanger the entire financial system. He cited prolonged low interest rates and a falling population as factors that are hurting regional banks’ core profitability.
The remarks suggest the BoJ may not necessarily wait for inflation to rise to 2% before lifting its benchmark rate out of negative territory if it sees its policies destabilising the banking system. The BoJ already moved to make its policies more sustainable back in July by widening the band that long-term yields can fluctuate around its target of 0%.
The yen firmed slightly after Kuroda’s comments but a bigger driver for the yen this past week has been safe-haven flows related to Brexit, Italian budget woes, trade tensions and a weakening dollar on the back of emerging expectations that the Fed may slow down its pace of rate increases. Any reaction therefore on Thursday to the CPI data will likely be fairly muted.
A positive surprise in the inflation numbers could drag dollar/yen further down, with immediate support likely to come from the 23.6% Fibonacci retracement level of the downleg from 114.54 to 111.36, around 112.10. A dip below this level would deepen the current bearish bias for the pair and turn the focus on the October 6-week low of 111.36.
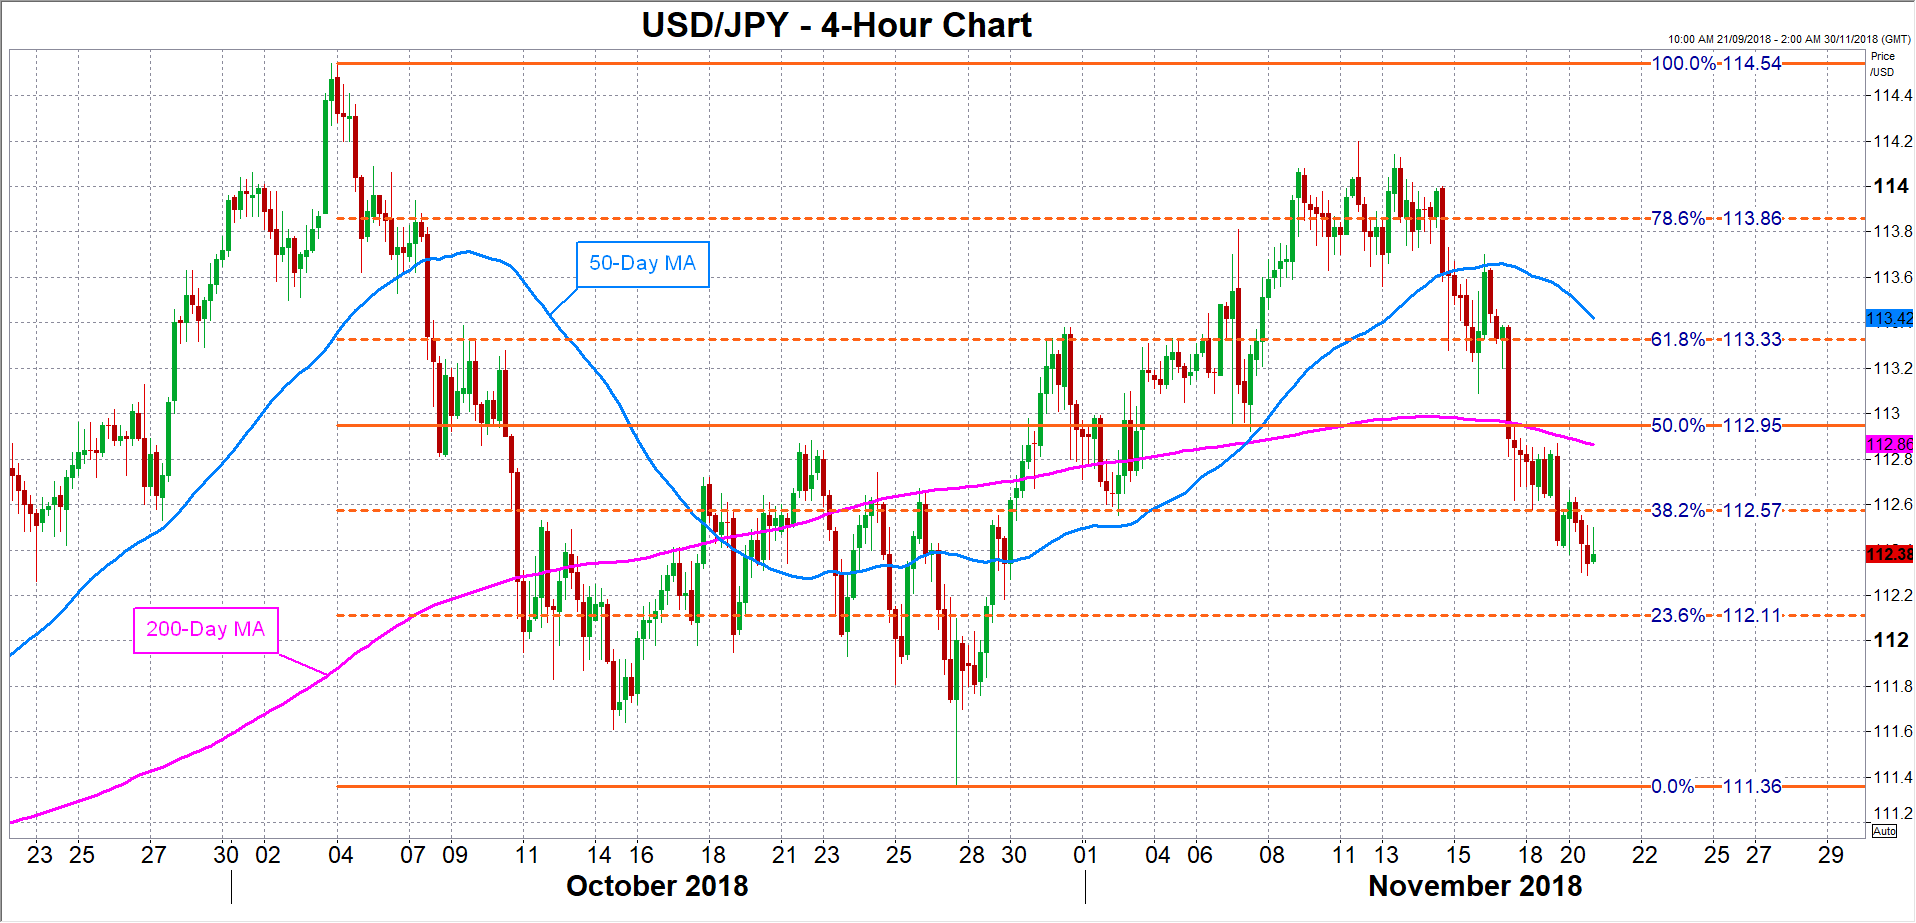
However, a shift in risk sentiment and another lacklustre CPI print could help dollar/yen move away from 3-week lows. The nearest hurdle on the upside is the 38.2% Fibonacci level at 112.57. Clearing this resistance could open the way for the 50% Fibonacci at 112.95. But the bearish pressure is unlikely to disappear unless the pair manages to break above the 61.8% Fibonacci at 113.33.