

Sample Category Title
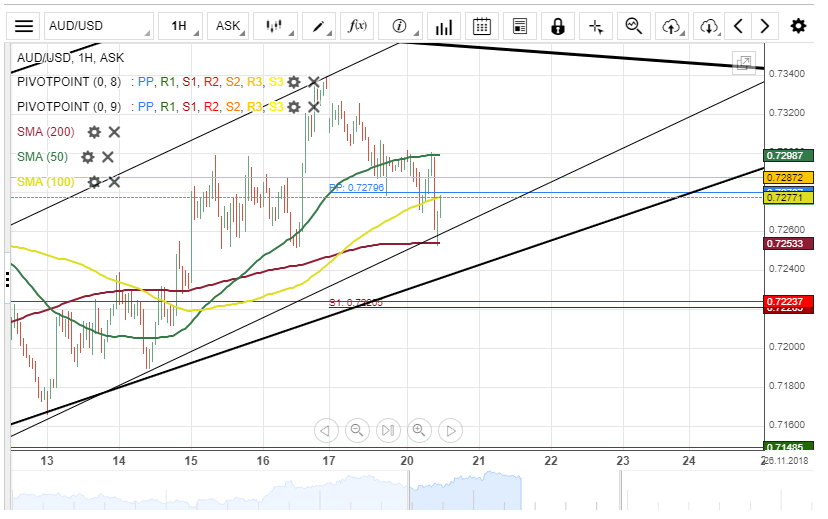
AUD/USD Breaches SMAs
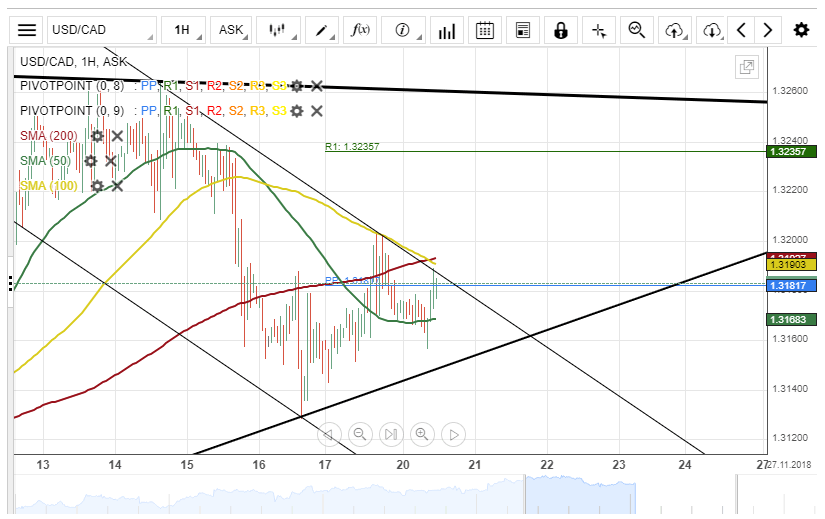
The US Dollar appreciated about 67 base points against the Canadian Dollar on Monday. The surge was temporary stopped by a resistance level formed by the 100-hour simple moving average at 1.3200.
The exchange rate was located near the upper boundary of a descending channel pattern at 1.3181 and could be set for a breakout.
If this breakout occurs, the USD/CAD currency pair will target a resistance level formed by the weekly R1 at 1.3235.
However, it is important to note that a resistance cluster formed by the combination of the 100– and 200-hour SMAs at 1.3190 could hinder the rate from hitting target today.
USD/CAD Bullish Potential Today
The US Dollar appreciated about 67 base points against the Canadian Dollar on Monday. The surge was temporary stopped by a resistance level formed by the 100-hour simple moving average at 1.3200.
The exchange rate was located near the upper boundary of a descending channel pattern at 1.3181 and could be set for a breakout.
If this breakout occurs, the USD/CAD currency pair will target a resistance level formed by the weekly R1 at 1.3235.
However, it is important to note that a resistance cluster formed by the combination of the 100– and 200-hour SMAs at 1.3190 could hinder the rate from hitting target today.
NZD/USD Potential Reversal
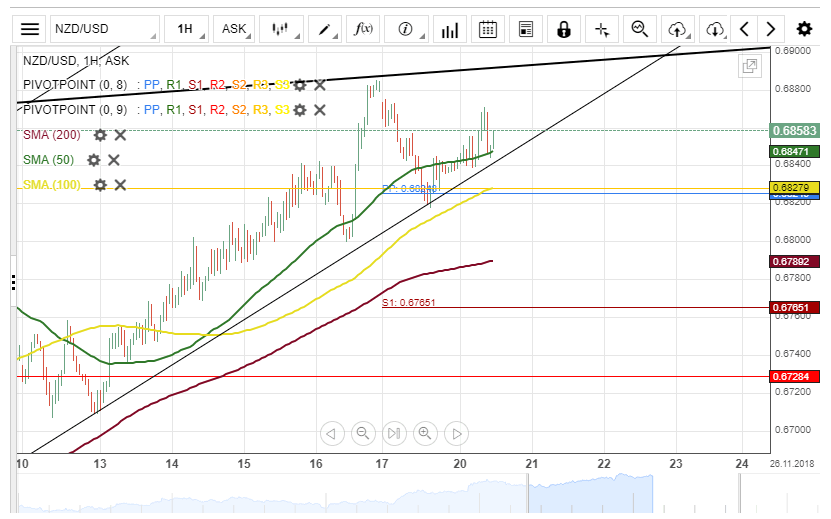
The New Zealand Dollar depreciated about 57 base points against the US Dollar on Monday. The decline was stopped by a support cluster formed by the weekly and the monthly PPs at 0.6827.
Everything being equal, it is likely that the currency exchange rate continues trading in a three-week ascending channel pattern during the following trading session.
Technical indicators the 4(H) and the daily time frames suggest that the NZD/USD currency pair could end today with a bullish momentum.
The potential target for the pair will be near the upper boundary of a triangle-likely formation at 0.6900.
EUR/USD Trades At 1.1420
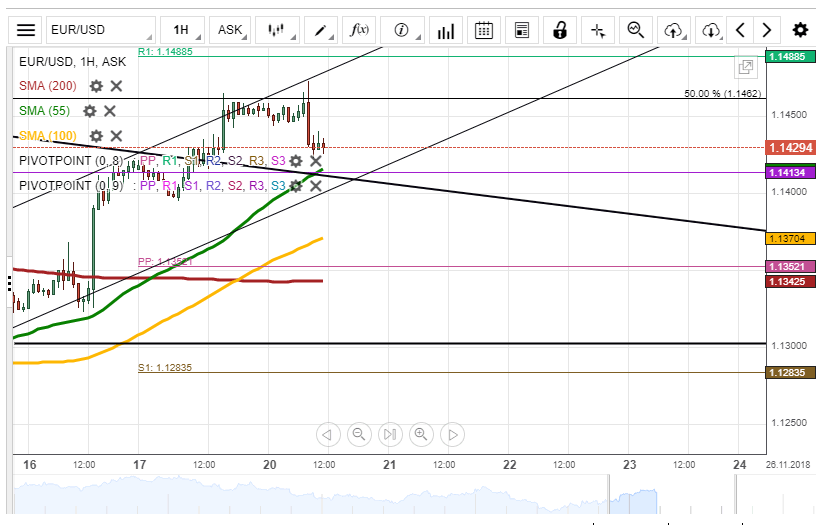
During Monday's trading session, the European Single Currency was moving sideways to end the trading session at the 1.1448 mark. On Tuesday morning, the currency exchange rate depreciated by 0.38% to trade at the 1.1434 mark.
In regards to the near-term future, most likely, the currency exchange rate will be trading sideways to stay at the 1.1440 level during the day. The 55-hour simple moving average will catch up the rate to give additional support for the rate.
On the other side, the European Single Currency could break the resistance of the 50.00% Fibo at the 1.1462 mark to surge towards the weekly R1 at the 1.1488 mark.
GBP/USD Trades Between SMAs
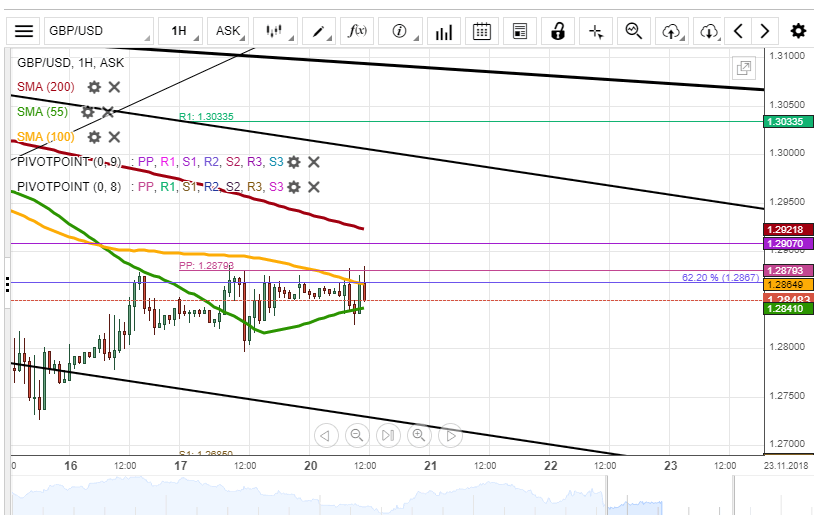
During Monday's trading session, the currency exchange rate was trading sideways to end the trading session at the 1.2849 mark. On Tuesday morning, the British pound was located between the 55-hour and the 100-hour simple moving averages to trade at the 1.2830 mark.
In regards to the near-term future, most likely, the British Pound will keep moving sideways at the 1.2800 level due to the resistance of the most technical indicators which will not allow the rate to surge upwards during the trading session on Tuesday.
On the other side, the British Pound could depreciate against the US Dollar to trade near the bottom boundary of the descending medium pattern line at 1.2700 level.
USD/JPY Pierces Dominant Pattern Line
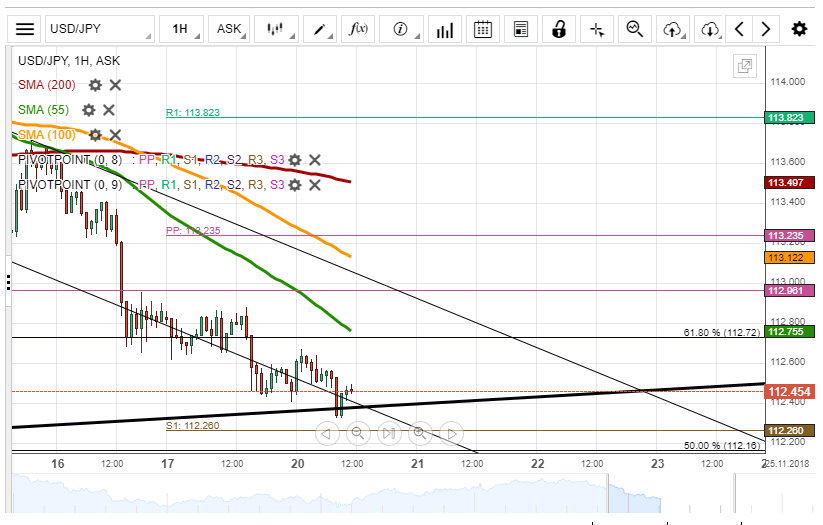
During Monday's trading session, the currency exchange rate depreciated 28 pips or 0.25% to end the trading session at the 112.43 mark. On Tuesday morning, the US Dollar was piercing the bottom boundary of the dominant ascending pattern to trade at the 112.41 mark.
In regards to the near-term future, most likely, the US Dollar will depreciate towards the 50.00% Fibonacci retracement level at the 112.16 level during the day.
On the other side, the dominant pattern line at the 112.40 could retrace the rate to trade sideways at the 112.40 level.
XAU/USD Supported By 55-Hour SMA
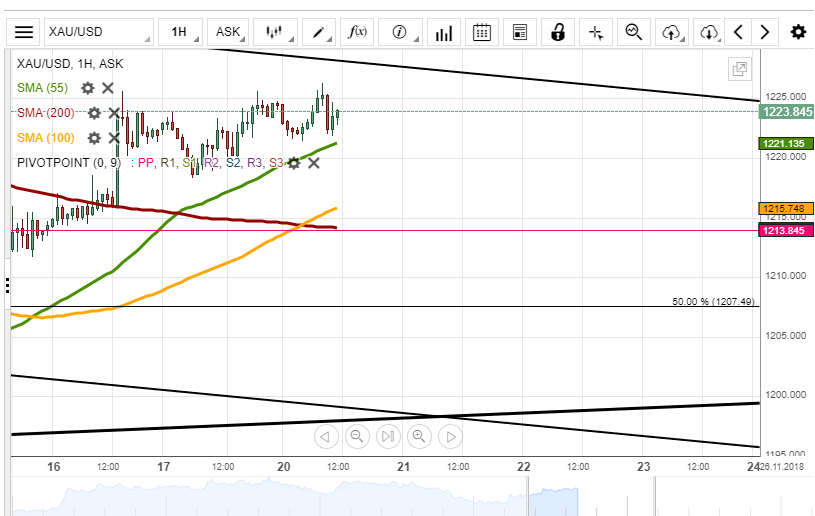
During Monday's trading session, the yellow metal was surging towards the descending medium pattern line at the 1,226.00 level to end the trading session at the 1,222.68 mark. On Tuesday morning, the gold was supported by the 55-hour simple moving average to trade at the 1,223.45 mark.
In regards to the near-term future, most likely, the gold will keep surging upwards to the medium pattern line at 1,226.00 level to trade at the 1,224.00 level during the trading session on Tuesday.
However, the rate could depreciate to pass through the support of the 55-hour simple moving average to trade at the 1,216.00 level on Tuesday.
GER 30 Index Extends Losses To Eye 2-Year Low
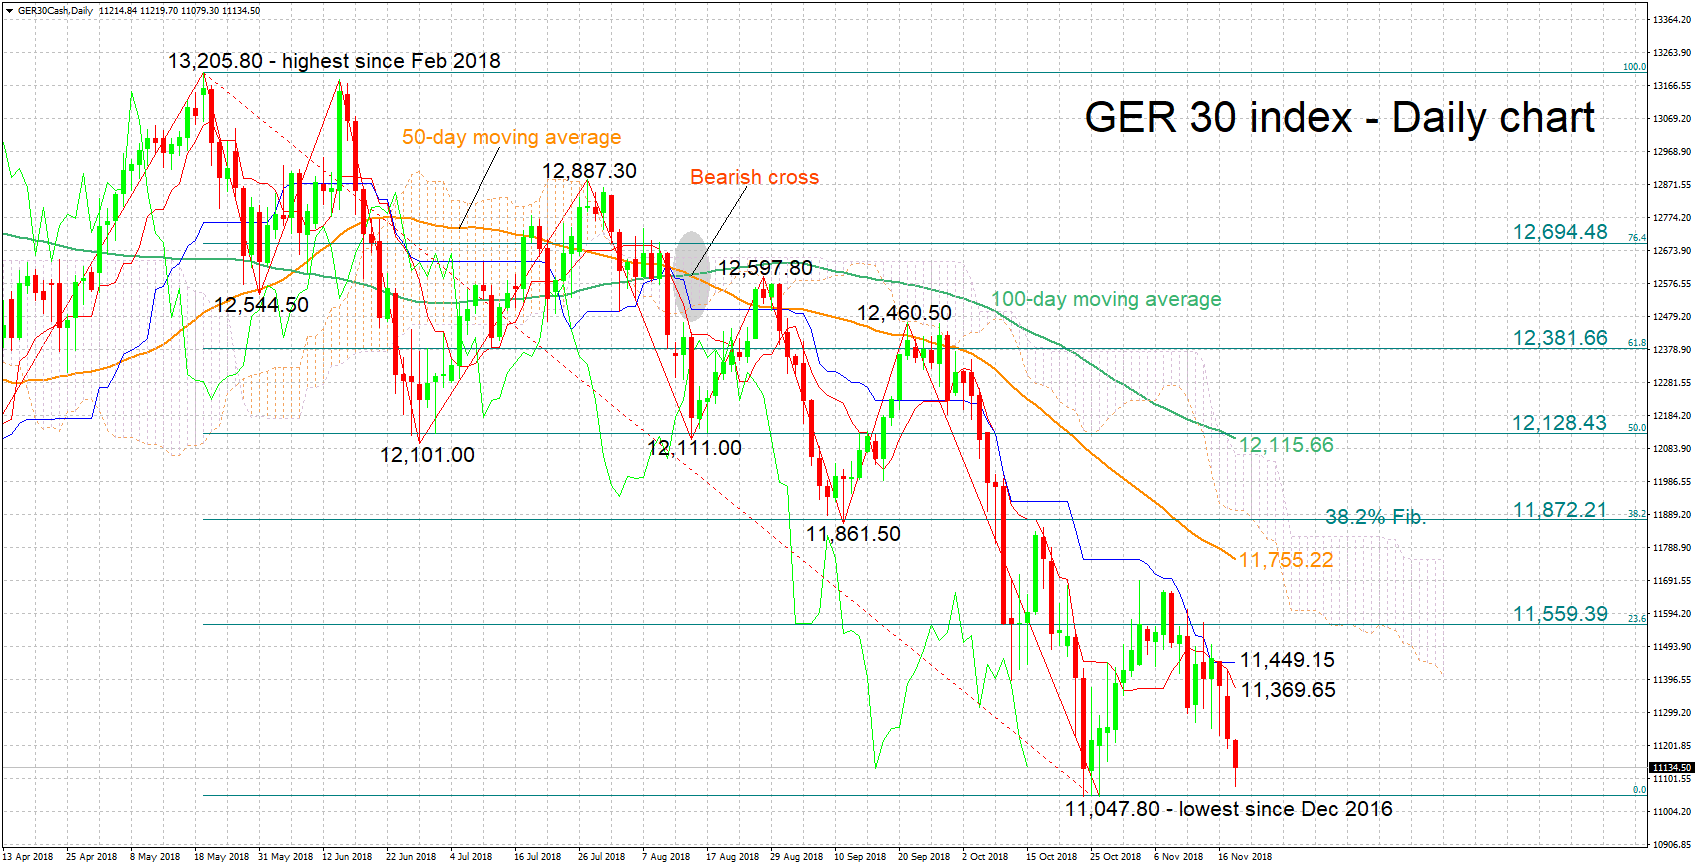
The Germany 30 index is declining for the third straight day and is currently trading not far above its lowest since December 2016 of 11,047.80 hit in late October.
The Tenkan- and Kijun-sen lines are negatively aligned in support of a bearish bias in the short term.
Additional declines may find support around the near two-year nadir of 11,047.80; the area around this also encapsulates the 11,000 mark that may be of psychological significance. Below, the zone around 10,800 that halted advances numerous times in 2016 could act as support. Even lower, the region around 10,500 which was congested in 2016 may be of importance.
On the upside, resistance could occur around the current levels of the Tenkan- and Kijun-sen lines at 11,369.65 and 11,449.15 respectively. Further above, a barrier may be found around 11,559.39, the 23.6% Fibonacci retracement level of the downleg from 13,205.80 to 11,047.80. More bullish movement would bring the current level of the 50-day moving average line at 11,755.22 within scope.
The medium-term picture is clearly bearish: the index is in a downtrend, recording lower highs and lower lows. Additionally, price action is taking place below the 50- and 100-day MAs, as well as below the Ichimoku cloud.
Overall, both the short- and medium-term outlooks appear negative at the moment. For perspective, the index is down by 16.5% in 2018.
Markets Red On US-China Rivalry
Swiss export growth highest since 2016
Swiss exports have been growing fast, thanks to a rebound in Swiss exporting industries. Key support for the recovery are chemical and pharma products, which reached CHF 9 billion in exports for October, adding CHF 937 million of trade surplus. In total, the trade balance is estimated at CHF 2.6 billion in October (exports: CHF 18.90 billion; imports: 16.2 billion; September's trade balance: CHF 1.27 billion). The growth of demand in Swiss products by largest trading partners increased by +7.60% (CHF 774 million) in Europe, +3% (CHF 126 million) in Asia and decreased by -0.5 % (CHF -17 million) in North America. Accordingly, Swiss exports are expected to remain positive by the end of the year, as consumer demand is expected to rise at year-end. Total sight and domestic deposits remain stable at CHF 577.3 billion and CHF 474.4 billion respectively. USD/CHF is currently trading at 0.9926, declining by -0.13% (year-to-date: +1.81%) since last week and heading along 0.9910 short-term.
Markets red on US-China rivalry
President Xi Jinping's meeting in Manila, Philippines, the first Chinese state visit in the region in 13 years, is expected to tighten the relationship between the Pacific neighbors. After their first meeting last week in Papua New Guinea, Chinese and Philippine leaders will sign investment deals in infrastructure worth USD billions, including investment in the former US Clark military base, to make it a modern city.
The recovery in US equities last week was unsustained, led by a sharp drop in tech stocks among which Apple (-3.96%) and the tech stock index Nasdaq closing at -3.03%. The S&P 500 and the Dow Jones Industrial Average also remained negative at -1.66% and -1.56% respectively. Asian shares endured the same fate, with Japanese Nikkei 225 down -1.09%, Nissan shares down -5.45%. Chinese markets have been facing a sharp drop with China mainland down -2.31% and Hong Kong Hang Seng -2.02%. European equities remain in the red across the board. The DAX leads the drop with a decline of -1.08% while the Euro STOXX 50 remains at -0.84%. Risk-off sentiment dominates the marketplace.
Markets On Shaky Ground As FAANG Stocks Sit In Bear Market Territory
Markets on shaky ground as FAANG stocks sit in bear market territory
A sea of red across equity markets suggest we’re heading for another turbulent session as investors come to terms with another sell-off on Monday and an increasingly wobbly tech sector.
With FAANG stocks now all in bear market territory and not yet coming to the rescue of the rest of the market, investors have been left wondering if this is going to get messy or whether Black Friday has come a little early in stock markets. There still appears to be a lot of underlying anxiety in the markets which may prolong the current sell-off a little longer, with trade wars, US interest rates, Brexit and the Italian budget standoff all being significant headwinds.
A number of these could subside in the coming weeks, which may put investors at ease a little, although of course that assumes worst case scenarios in each don’t materialise which particularly in the case of Brexit, they could. This could lay the groundwork for the fabled Santa rally as we enter the final weeks of the year.
Sky no longer the limit for bitcoin, ground below looking increasingly unsteady
Volatility has returned to the crypto space after months of increasingly tighter ranges and relatively sparse news flow. Unfortunately, contrary to last year, the news that’s flowing is mostly bad and while the size of the moves are rather familiar, the price action is in the opposite direction. As we quite often see in this space, negative news is rarely confined to a particular instrument and once the Bitcoin domino falls, the rest quickly follow.
To be honest, this has been building for some time. Enthusiasts may have looked at bitcoin’s ability to hold above $6,000 as a sign of a market bottoming but the warning signs were there each time it failed to make a new high on a rebound – most notably in March, May, July and even September. The bitcoin cash fork came at an opportune time as the volatility had been squeezed out of the market and the result if the sharp sell-off we’re now seeing. It’s always difficult to say were the market could stabilise again in such a wild market but $3,000 looks an interesting level. This time last year, the sky was the limit for bitcoin and all the altcoins that piggybacked a ride, this year the ground below is looking very unsteady.
Oil slips after brief reprieve
Oil prices are on the decline again on Tuesday following a brief bounce that failed to generate any real upside momentum. The prospect of a production cut at the next OPEC+ meeting in a couple of weeks following a recommendation from the JMMC hasn’t managed to reverse the trend as of yet, with traders potentially weighing up recent comments from participants against the inventory and output data and deciding the bullish case isn’t strong enough.
Brent and WTI continue to find support around $65 and $55, respectively, although I wouldn’t write off the possibility of another drop in both to around $60 and $50 ahead of the meeting. Despite the sometimes mixed messages we’ve had of late, I think members will want to avoid a repeat of the moves in recent years and will step up to stabilise output with another cut. Whether that will be enough to have the desired effect will depend on the size of it.