Sample Category Title
WTI crude oil resumes recent free fall
WTI crude oil's recent free fall resumes today by taking out 54.84 low and reaches as low as 53.65 so far. Near term outlook will now stay bearish as long as 58.04 resistance holds even in case of recovery.
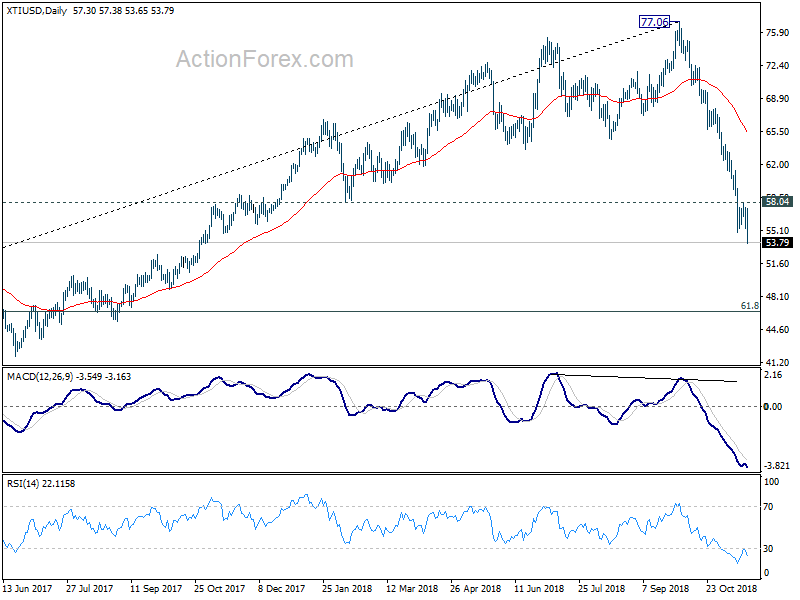
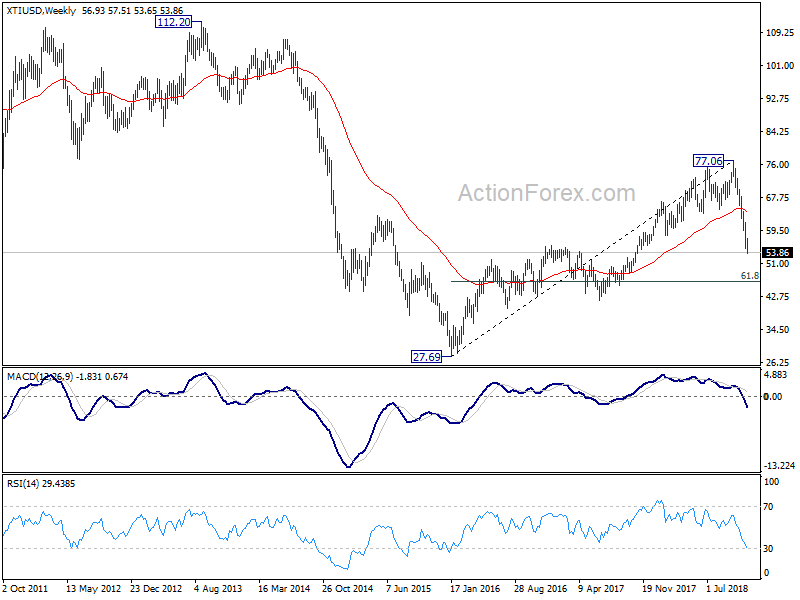
Fall from 77.06 is at least correcting the up trend from 27.69 to 77.06. Based on current momentum, it could indeed be an impulsive move rather than a corrective move. In either case, deeper decline should be seen to 61.8% retracement of 27.69 to 77.06 at 46.54 in medium term.
Also, a net effect in the currency markets is a drag on the Canadian Dollar.
USD/CAD Mid-Day Outlook
Daily Pivots: (S1) 1.3141; (P) 1.3171; (R1) 1.3203; More...
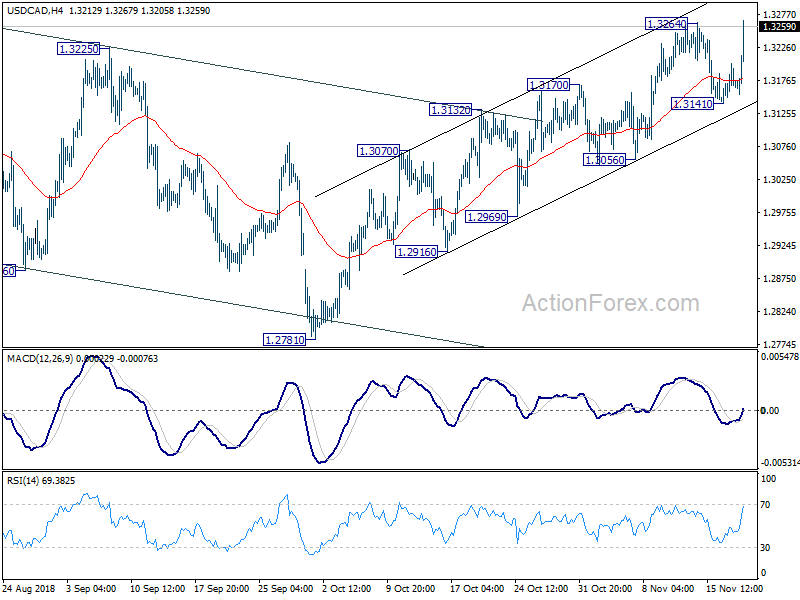
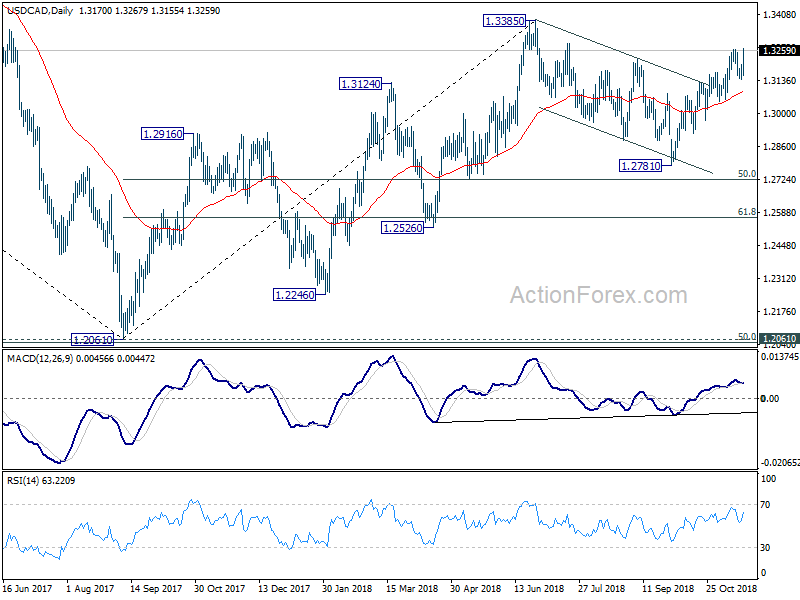
USD/CAD's strong rise and breach for 1.3264 suggests resumption of recent rise from 1.2781. Intraday bias is back on the upside for 1.3385 resistance next. On the downside, break of 1.3141 support is needed to indicate short term topping. Otherwise, outlook will remain bullish in case of retreat.
In the bigger picture, current development revives the case that corrective fall from 1.3385 has completed at 1.2781 already. And whole up trend from 1.2061 (2016 low) is ready to resume. Break of 1.3385 will target 61.8% retracement of 1.4689 (2016 high) to 1.2061 at 1.3685. This will now be the favored case as long as 1.2781 support holds.
US Durable Goods Orders Next on the Dollar’s Radar
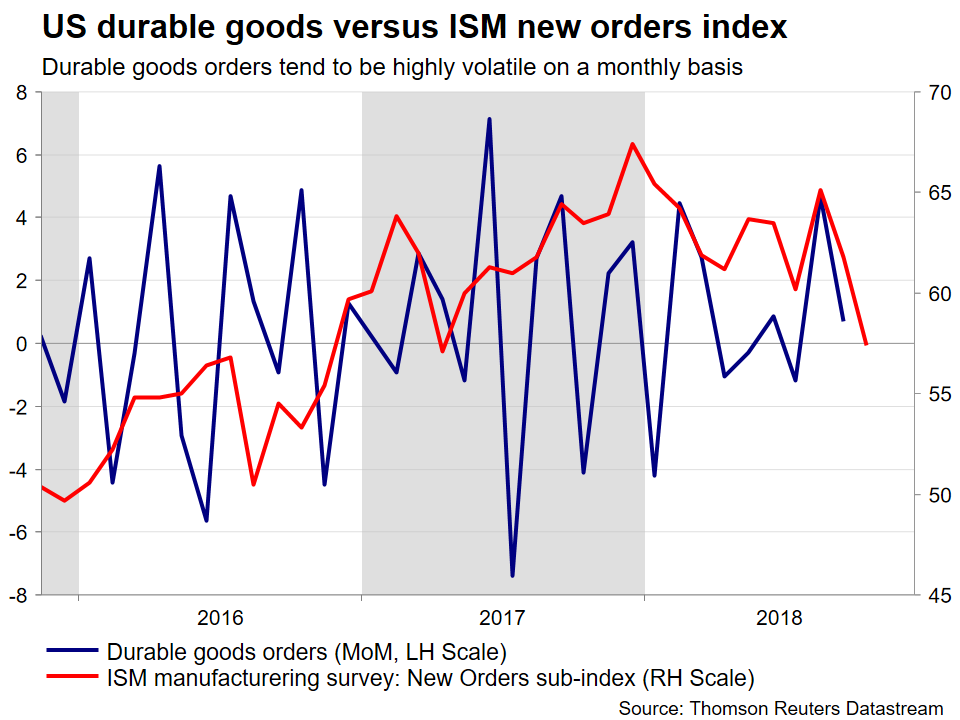
The highlight on the US economic calendar this week will be durable goods orders for October, due out on Wednesday at 1330 GMT. Forecasts point to a decline in monthly terms. While that is not surprising considering how volatile these data are, such prints would still be a bad omen for Q4 GDP, and may thus help to extend the dollar’s latest pullback.
US durable goods orders – which are considered a proxy for capital spending and investment – are projected to have contracted by 2.5% in October on a monthly basis, a turnaround after growing by 0.7% in September. Excluding transportation equipment, “core” durable goods are expected to have risen by 0.4%, after posting no growth in the previous month. Hence, most of the softness in the headline number may be owed to weakness in items such as airplanes, which tend to be highly volatile from month to month. The forecast for the headline print is supported by a notable decline in the New Orders sub-index of the ISM manufacturing PMI for October.
While an overall soft set of data is unlikely to prove a game-changer for either the dollar or the outlook for the US economy, it would still be an ominous sign for GDP growth in Q4. Models like the Atlanta Fed GDPNow and the New York Fed Nowcast currently estimate Q4 growth at an annualized pace of 2.8% and 2.6% respectively, which reflects a sharp slowdown from recent quarters, enhancing the narrative the US economy is set to lose steam as the fiscal stimulus begins to wear off. Should this week’s data reaffirm this narrative, then the dollar could extend its latest losses as investors become increasingly skeptical on whether the Fed will raise rates as fast as it currently projects in 2019.
In the bigger picture, the dollar’s performance will also depend to a large degree on how trade tensions between the US and China play out. Specifically, will the two superpowers hint at a “truce” as has been speculated lately? If so, that could weigh on the dollar as safe-haven bets are unwound; recall that the US currency attracted defensive inflows as tensions flared up earlier in the year.
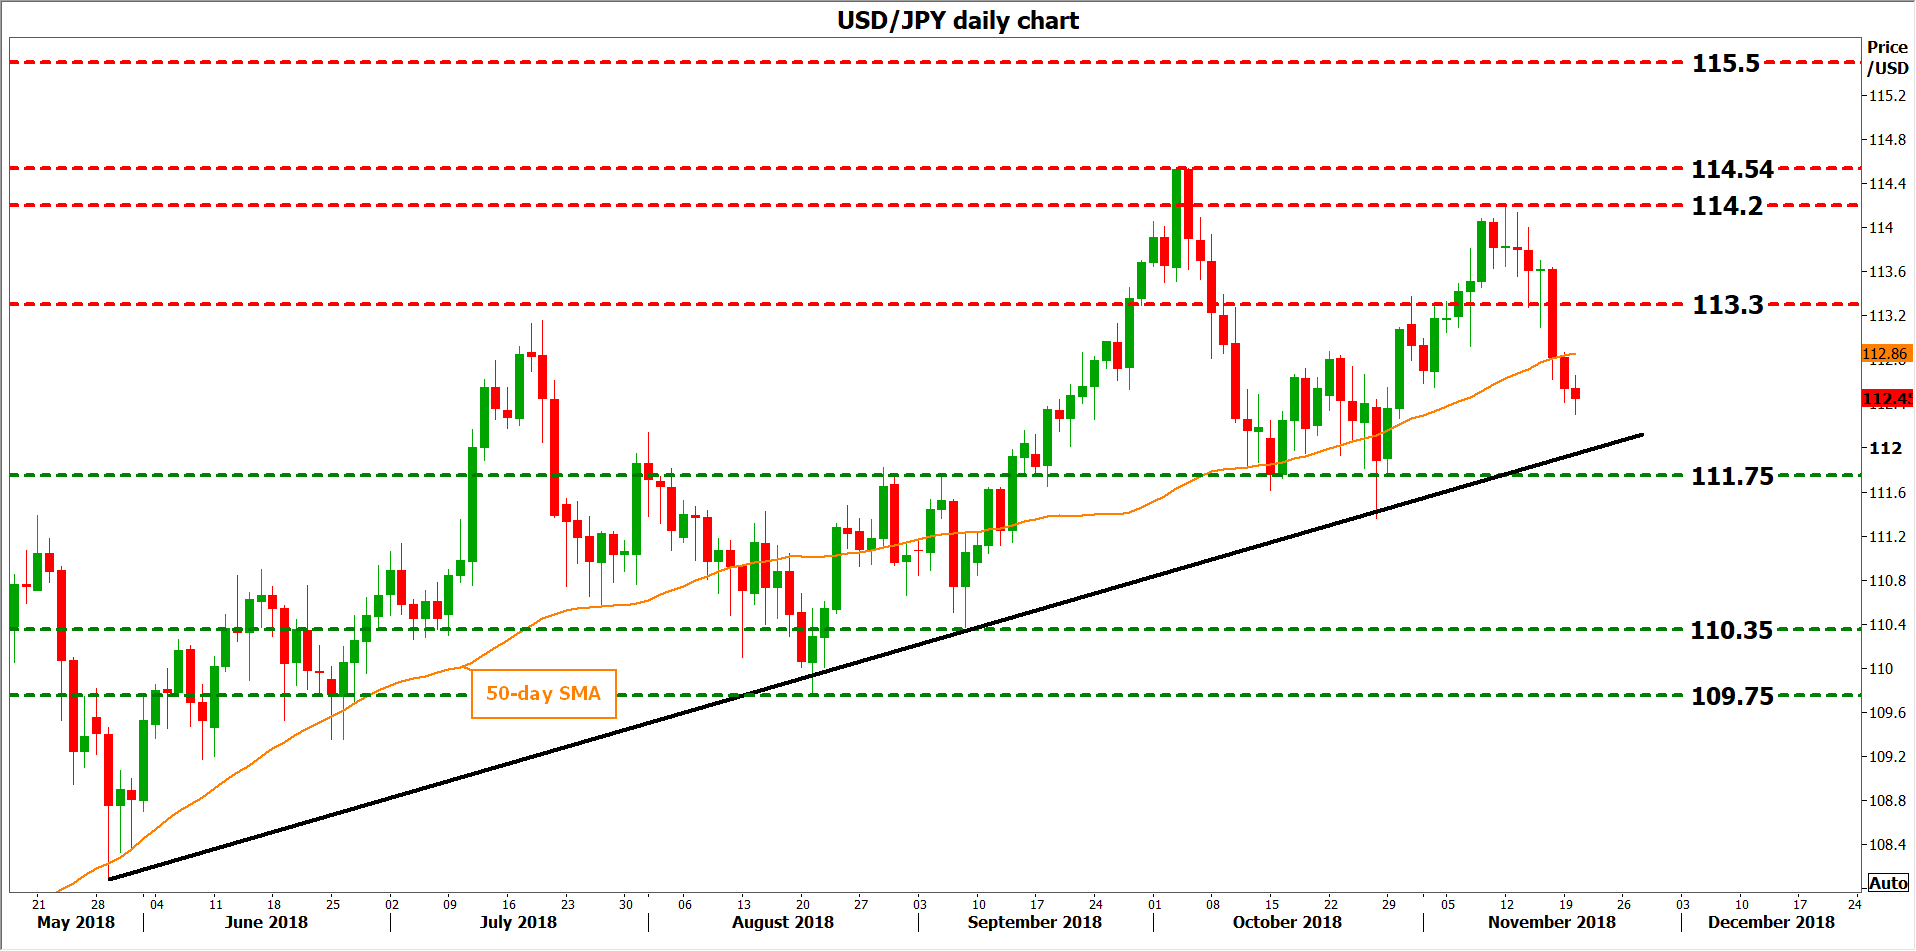
Technically, looking at dollar/yen, declines could meet immediate support near the crossroads of the 111.75 zone and the medium-term uptrend line drawn from the lows of May 29. A decisive move below that area could see scope for a drop towards the September 7 trough of 110.35, before the August 21 bottom of 109.75 comes into view.
On the flipside, a rebound may encounter initial resistance at 113.30, a hurdle that capped the decline on November 14. An upside break could open the way for a test of the one-year high of 114.54, assuming the November 12 top of 114.20 is violated first. Even higher, sell orders may be found at 115.50, the peak of March 2017.
Sunset Market Commentary
Markets
Global core bonds eke out small gains today. German Bunds outperform US Treasuries. The Bund enjoyed an unleg as BTP’s sold off in early trading. The German/Italian 10-yr yield spread rapidly widened from around 320 bps to 335 bps. 5SM leader Di Maio reiterated that key budget measures won’t be altered. The timing of his comments explains BTP’s sensitivity with the EC tomorrow publishing opinions on EMU countries’ budget plans. A new negative opinion will normally result in ECOFIN starting an “excessive deficit procedure” against Italy at its next ECOFIN meeting (Dec 5) which could ultimately result in a penalty. Risk aversion on European stock markets following weakness on WS and in Asia and a slow start to the latest retail BTP Italia issuance added to worries. The Bund profited from safe haven flows. The move halted as the Italian pressure eased, with the BTP spread retuning towards 326 bps (currently +4 bps intraday). The German yield curve bull flattens at the time of writing with yields 0.8 bps (2-yr) to 2.7 bps (30-yr) lower. The US yield curve flattens as well with yield changes ranging between +0.2 bps (2-yr) and -2.2 bps (30-yr). The test of key support levels (5-yr: 2.9%; 10-yr 3.05%; 30-yr: 3.3%) remains ongoing across the curve. US housing data were close to consensus, but confirm a cool down of the housing of market.
This morning it looked that the recent USD-decline would simply continue. EUR/USD filled offers in the 1.1470 area at the start of trading. However, the EUR/USD uptrend could not be sustained. Today’s correction was probably more a euro setback rather than a USD rebound. The EUR/USD decline coincided with a widening of Italian spreads. Spain making objections to the Brexit text maybe were also a euro negative. In US trading, global risk sentiment stayed negative, but this time the decline in core/US yields had no additional negative impact on the dollar. Contrary to negative surprise of the NAHB index yesterday, US housing data published today didn’t bring any additional negative surprise. EUR/USD kept a gradual negative intraday bias. The pair trades in the low 1.14 area. The risk-off sentiment is slightly weighing on USD/JPY, but for now yen gains remain limited. USD/JPY is trading in the 112.40 area.
BoE governor Carney and three MPC members testified on the inflation report before a Treasury committee today. It was a difficult balancing act for the BoE to give its view on monetary policy given different Brexit scenario’s without openly supporting one political option. Even so, the BoE welcomed the (potentially prolonged) transition period from the Brexit deal. Still, the BoE governor considers the threat of a chaotic Brexit uncomfortably high. The BoE will give its assessment on the Brexit plan and on a no-deal outcome to the Treasury Committee on Nov 29. However, the BoE suggested that easing of policy is far from sure, even in case of a no deal scenario as the UK economy is now in a different situation compared to the time of the referendum. The UK economy is running close to full capacity and inflation is at target. In this context, chances are bigger that the BoE will have to raise rates in case of a supply shock and/or a decline of sterling. Sterling temporarily gained a few ticks during the hearing, but those gains were limited and short-lived. Sterling traders first want more clarity on political developments before considering the reaction function of the BoE. EUR/GBP still hovers slightly below 0.89 area. USD strength is keeping cable in the mid 1.28 area.
News Headlines
US home construction increased 1.5% in October (m/m) vs. -5.5% in September against 2.2% expected. Building permits declined -0.6% last month while a drop of 0.8% was expected. Both indicators provide more evidence of a cooling of the housing market, following yesterday steep drop in NAHB homebuilder sentiment.
The Hungarian central bank (NBH) left its policy rate and deposit rate unchanged at resp. 0.90% and -0.15%, while the inflation in Hungary mounts up to 3.8%. The NBH pursues a 3% inflation target, but allows changes within the range of 2%-4%. The Hungarian forint remains near opening levels, with investors awaiting the NBH’s press release.
GBPAUD Attempts Rebound from 3-Month Low; Looks Bearish in the Medium Term
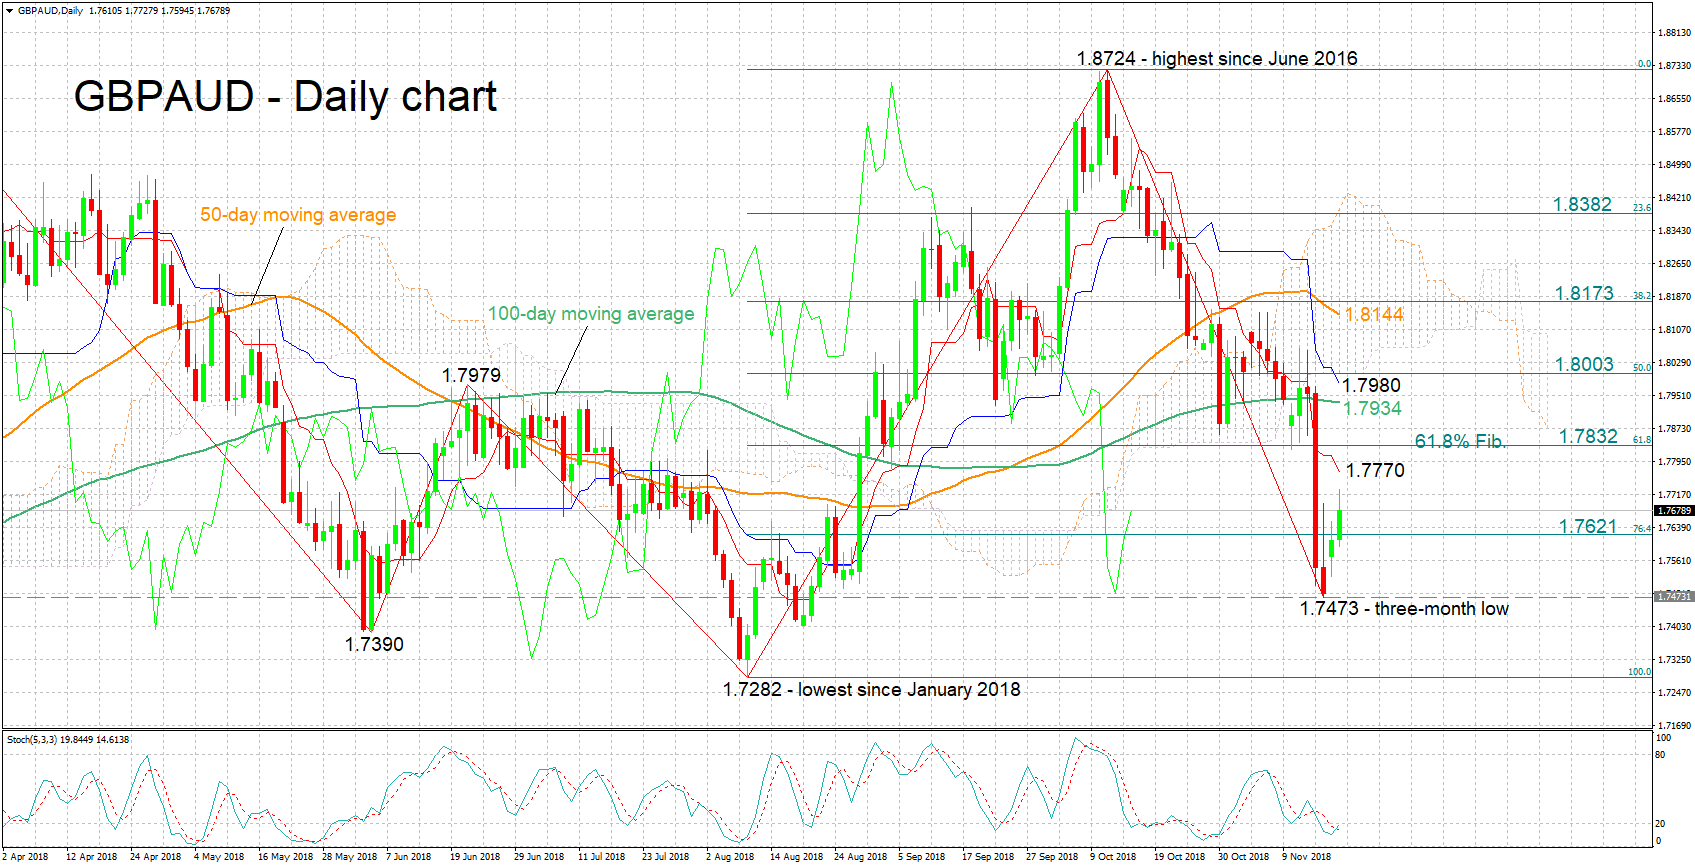
GBPAUD rebounded after hitting a three-month low of 1.7473 on Friday. It is currently trading around 200 pips above the aforementioned trough.
Despite recovering somewhat, the pair continues to look mostly bearish in the short term, something which is also supported by the negatively aligned Tenkan- and Kijun-sen lines. Notice though that the %K and %D lines of the stochastic oscillator have just recorded a bullish cross, which may constitute an early sign for gains in the very short term.
An extension of the recovery may see the pair finding resistance around 1.7770, the current level of the Tenkan-sen. Not far above, a barrier to gains could come around 1.7832, the 61.8% Fibonacci retracement level of the upleg from 1.7282 to 1.8724. Higher still, the focus would turn to the current level of the 100-day moving average line at 1.7934.
Should the pair re-enter a path of declines, immediate support could occur around the 76.4% Fibonacci mark at 1.7621. Steeper losses would eye last week’s three-month low of 1.7473 for additional support, while lower still, a previous bottom at 1.7390 would come into scope.
The medium-term picture continues to look predominantly bearish, with trading activity taking place below the 50- and 100-day MAs, as well as below the Ichimoku cloud.
To conclude, the short- and medium-term outlooks look negative at the moment, though some advances in the very short term are not to be ruled out.
US: Housing Starts Rise Modestly in October
Housing starts rose 1.5% in October, following a 5.5% drop in September. Building permits fell 0.6%, following a 1.7% rise the prior month. Permits are running ahead of starts but all the overshoot is in multi-family units.
Starts Improve Modestly in October
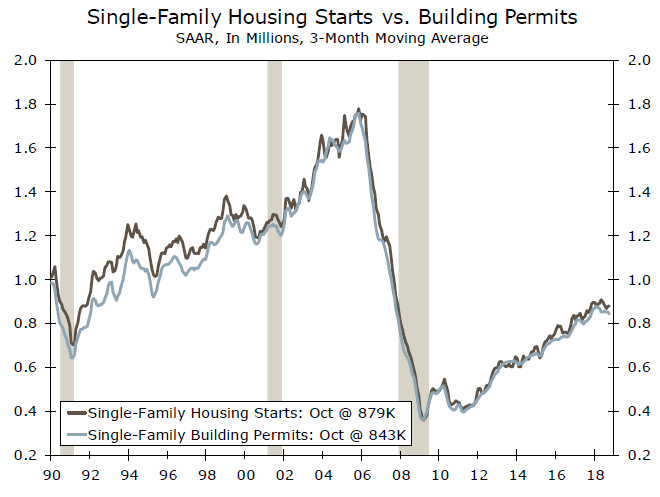
Housing starts rose modestly in October, with overall starts rising 1.5%. All of the gain, however, came from multifamily units, which jumped 10.3%. Most of that gain was in projects with five or more units, which rose 6.2% and are primarily apartment projects. Starts of single-family homes fell 1.8% in October, marking their second consecutive drop.
Single-family starts appear to have topped out in November of last year at a 948,000 unit pace, as starts rebounded after devastating hurricanes hit Texas and Florida. While hurricanes once again likely disrupted activity in parts of the South this past month, the impact was considerably less than last year, when nearly one-quarter of the nation's new home construction was impacted for at least some period of time. Single-family starts also fell in the West (-2%) and Midwest (-1.6%) but edged out a 14.8% gain in the Northeast, which accounts for the nation's smallest share of new single-family home construction.
Permits for single-family homes fell 0.6% in October and are running below starts, indicating that single-family starts are likely to continue to lose momentum in coming months. The year-to-date data provide a better assessment of the housing market, particularly as we enter the late fall and winter months, when building activity pulls back sharply across much of the country. Through October of this year, single-family starts are running 5.5% ahead of their year-ago pace. Most of that gain is in the West and South, where single-family starts are running 15.2% and 3.9% ahead of their yearago pace. Unfortunately, starts in both regions are losing momentum, largely due to affordability concerns. Permits for new single-family homes through the first ten months of the year are running 5.7% ahead of their year-ago pace but are running 3.4% below starts, again suggesting the single-family market will continue to lose momentum.
The weakness in the single-family market is being offset somewhat by continued strength in multi-family units. This past year was expected to see a shift in leadership in the housing market, as more renters opted to purchase a home. That shift has largely failed to materialize. While the homeownership rate has edged higher, the apartment market has caught its second wind. Many renters have opted to renew their existing leases because they feel they are priced out of the housing market. Apartment vacancy rates fell during the third quarter, despite an onslaught of new units this year, and rents have firmed.
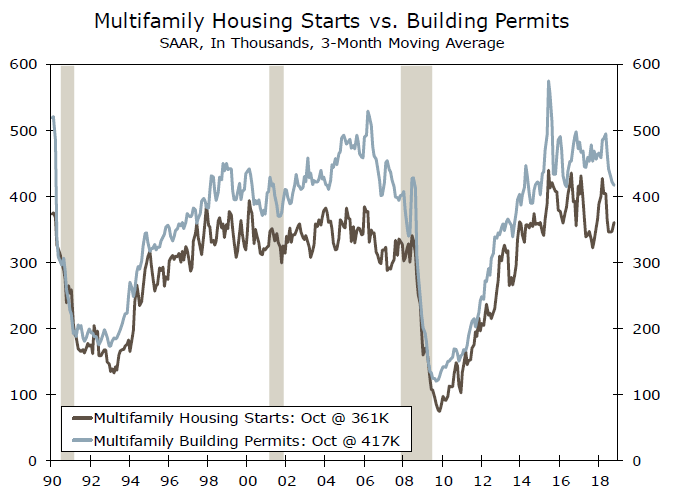
The multi-family market is the polar opposite of the single-family home market. Permits for projects with five or more units through October are running roughly even with their year-ago pace but are running 11.7% above starts through the first ten months of 2018. With demand remaining strong, we could see a bit more strength in apartment starts in coming months, even as single-family starts continue to drop.
US: Housing Starts Rise in October on a Rebound in Multi-Family Building
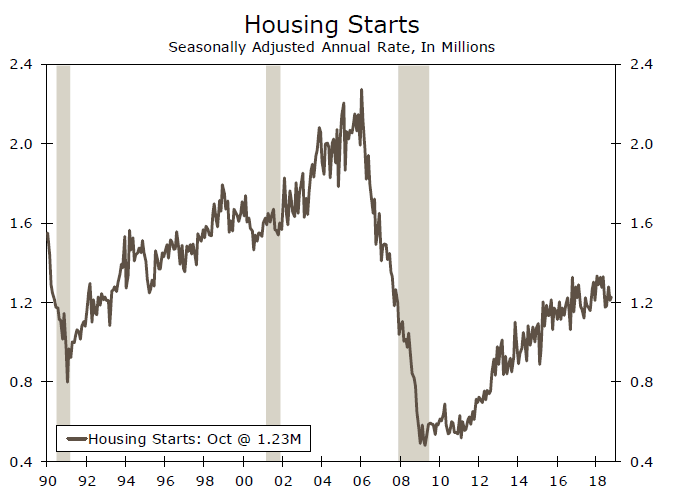
U.S. housing starts rose 1.5% to 1.23 million (annualized) in October from a upwardly revised 1.21 million in September. The gain was concentrated in the volatile multi-family segment, which rose 10.3% to 363k units. Single-family starts declined 1.8% to 865k units. The market expected a 1.8% increase in starts.
Building permits, on the contrary, edged lower by 0.6% in October to 1.26 million (from 1.27 million in September). Both single and multi-family permits fell in the month.
Regionally, starts were up almost 33% in the Midwest and 4.7% in the South (the largest region), but were down 34.1% in the Northeast and 4.6% in the West.
Key Implications
The contribution of the housing industry to overall economic output has been relatively muted in the past few quarters. Rebuilding activity following the destruction of homes by Hurricanes Florence and Michael, however, are expected to buoy starts in the near-term, particularly those in the single family segment.
Despite the near term fillip, homebuilding activity faces significant headwinds. These include heightened affordability concerns as both interest rates and home prices have risen in recent months. These, in addition to already present supply constraints (labor and lot shortages), are likely to limit the upside potential for sustained increases in starts. Nevertheless, we do expect starts to eke out modest gains for the remainder of the year on the back of rising wages and steady demand.
EURCAD Turns Neutral to Bullish after Surpassing 1.5100
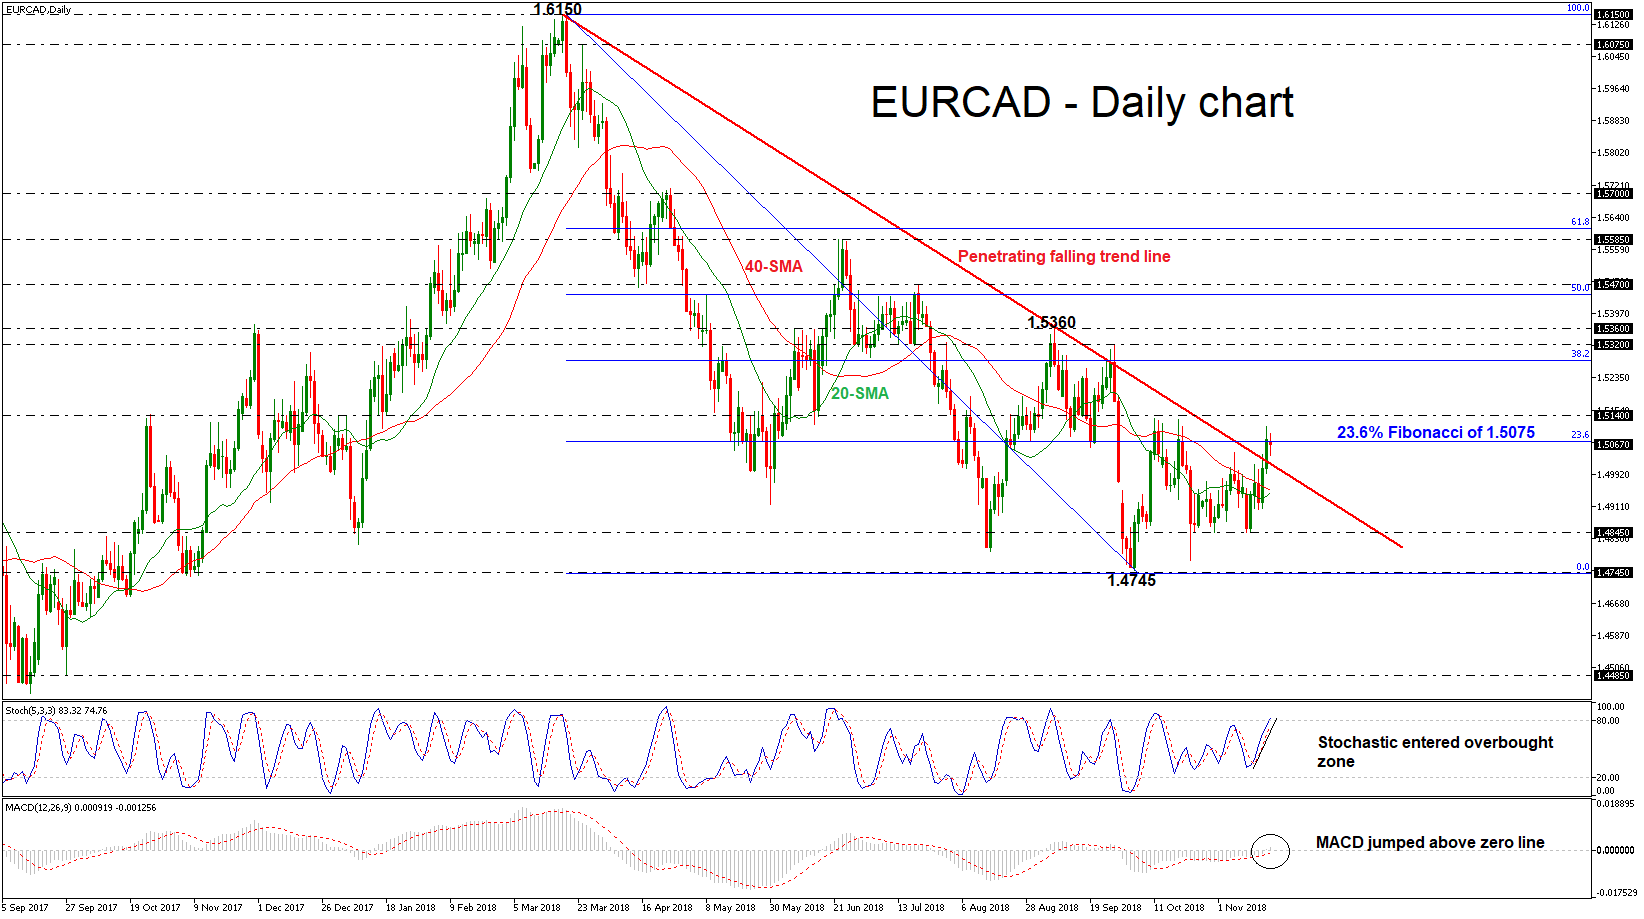
EURCAD broke to the upside of the falling trend line, however, it remains confined near the 23.6% Fibonacci retracement level of the downleg from 1.6150 to 1.4745, around 1.5075. The pair seems to be in a bullish correction mode as it jumped above 1.5100 and the technical indicators hold in positive territory. The stochastic oscillator is running into overbought zone, while the MACD jumped above the zero line.
Another closing day above the 23.6% Fibonacci mark, could push the pair until the next resistance of 1.5140. A stronger barrier, though, could be found at the 38.2% Fibonacci of 1.5280 since any strong violation of this point could increase chances for further gains probably towards the 1.5320 – 1.5360 resistance area.
However, if prices are unable to break above the 23.6% Fibonacci in the next few sessions, the risk would shift back to the downside, towards the 20- and 40-day simple moving averages (SMAs) around 1.4950. The next key support to watch lower down is 1.4845, identified by the recent lows.
In the medium-term, the outlook is changing to a more neutral to bullish one after the penetration of the descending trend line on Monday.
EUR/USD Mid-Day Outlook
Daily Pivots: (S1) 1.1411; (P) 1.1438; (R1) 1.1482; More.....
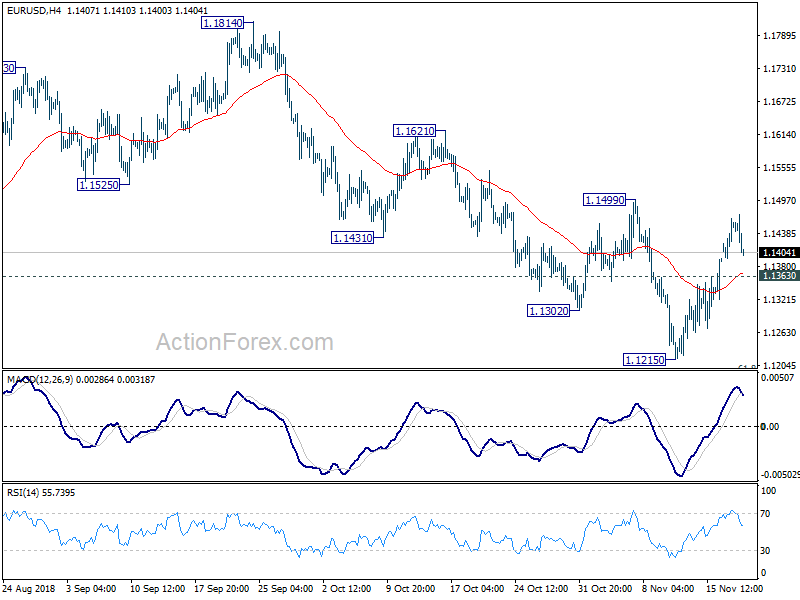
EUR/USD starts to lose upside momentum ahead of 1.1499 resistance, as seen in 4 hour MACD. Initial bias remains neutral and outlook stays bearish with 1.1499 intact. On the downside break of 1.1363 minor support will turn bias to the downside for retesting 1.1215 low first. Break will resume medium term down trend. However, on the upside, firm break of 1.1499 will indicate near term reversal and turn outlook bullish for 1.1814 resistance again.
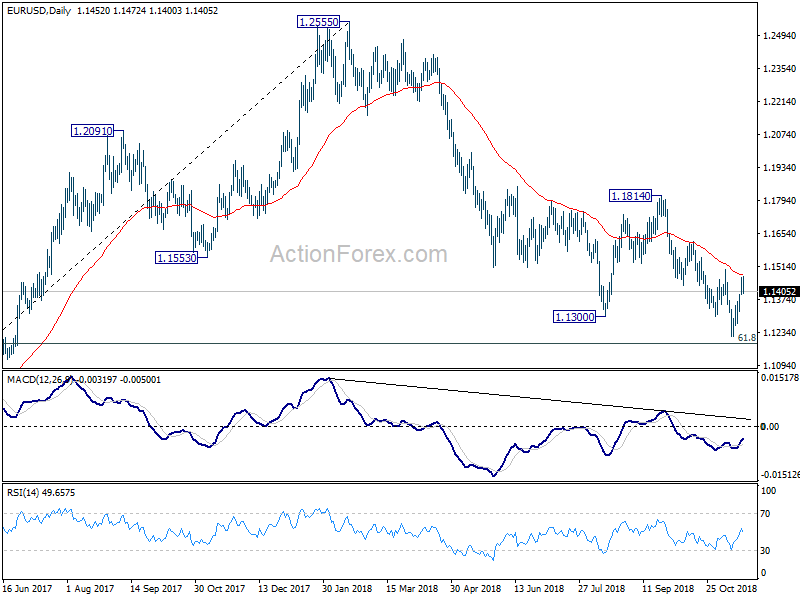
In the bigger picture, down trend from 1.2555 medium term top has just resumed and should target 61.8% retracement of 1.0339 (2017 low) to 1.2555 at 1.1186 next. Sustained break there will pave the way to retest 1.0339. On the upside, break of 1.1814 resistance is now needed to confirm medium term bottoming. Otherwise, outlook will stay bearish in case of strong rebound.
GBP/USD Mid-Day Outlook
Daily Pivots: (S1) 1.2802; (P) 1.2843; (R1) 1.2891; More...
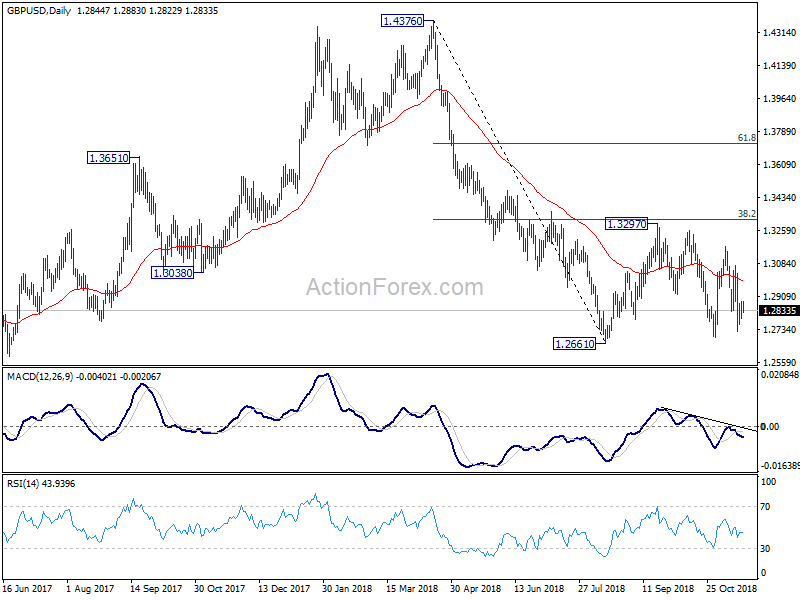
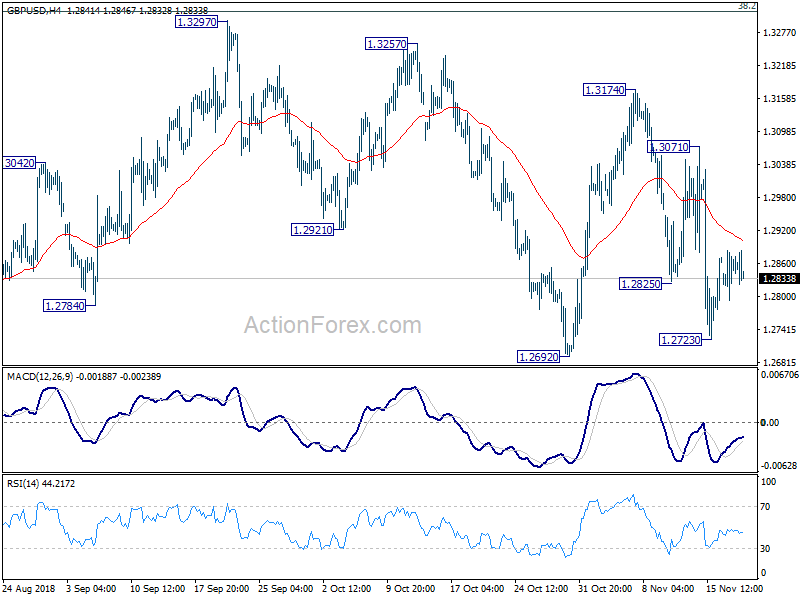
Intraday bias in GBP/USD remains neutral at this point. Outlook is also unchanged too. Price actions from 1.2661 are viewed as a consolidation pattern. Break of 1.2692 will bring retest of 1.2661 first. Firm break there will resume the larger down trend from 1.4376. On the upside, sustained break of 4 hour 55 EMA (now at 1.2903) could extend the consolidation with another rise. But even in case of strong rally, upside should be limited by 1.3316 fibonacci level to bring down trend resumption eventually.
In the bigger picture, whole medium term rebound from 1.1946 (2016 low) should have completed at 1.4376 already, after rejection from 55 month EMA. The structure and momentum of the fall from 1.4376 argues that it's resuming long term down trend. And this will be the preferred case as long as 38.2% retracement of 1.4376 to 1.2661 at 1.3316 holds. However, firm break of 1.3316 would bring stronger rebound to 61.8% retracement at 1.3721. And, the eventual depth of the fall from 1.4376, and the chance of hitting 1.1946 low, will depend on the strength of the interim corrective rebound from 1.2661.