

Sample Category Title
EUR/USD False Bearish Breakout Or Actual Downtrend?
The EUR/USD bearish breakout below the support trend line (blue) and 138.2% Fibonaccilevel of wave X vs W could indicate the continuation of the downtrend.
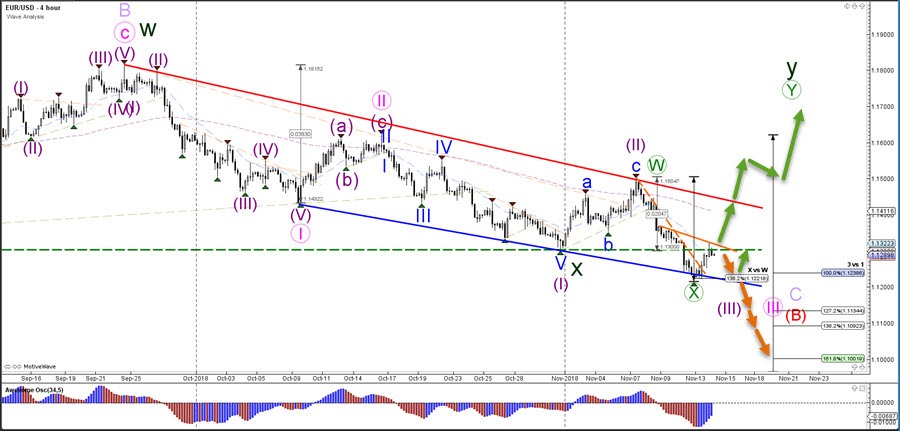
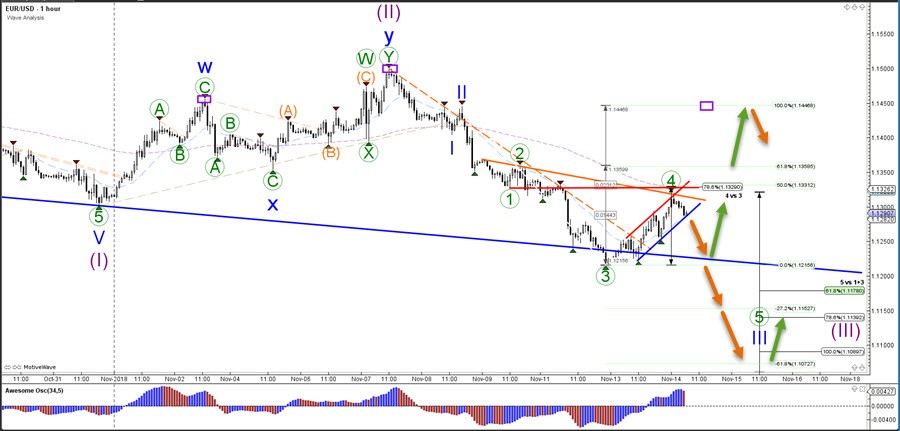
The EUR/USD is a critical decision zone. A bullish breakout could see price move up which would indicate a false bearish breakout below 1.13. The first target is the purple box which is a head and shoulders resistance level. A bearish break of the channel could see price challenge the larger channel support (blue) and a break below that could see price move lower towards the Fib targets within wave3 (blue).
Asian Macro Data And Upcoming Tencent Earnings In Focus
General Trend:
- Asian equity markets trade mostly lower
- Energy sector weighs on the Australian market
- Japanese automakers trade broadly higher, US said to be planning to hold off on implementing auto tariffs for now
- Tencent shares in focus ahead of upcoming earnings report
- Japan Q3 GDP contracts, natural disasters and trade impact cited
- Australia Q3 wages rise at the fastest pace since 2015, matches ests
- China Industrial Production and Fixed Asset Investments data beat ests, gov’t says support measures are starting to show impact
- Some analysts suggest, China government's policies are not strong enough to be effective; Notes recently released Oct banking data which missed ests (Hong Kong Press)
- Sri Lanka Central Bank unexpectedly hikes rates amid currency weakness
- Australia Oct labor data due on Thursday
Headlines/Economic Data
Japan
- Nikkei 225 opened +0.2%
- (JP) Japan considering start of next ordinary Diet session on Jan 4th - Japan press
- (JP) JAPAN Q3 PRELIM GDP Q/Q: -0.3% V -0.3%E; ANNUALIZED Q/Q: -1.2% V -1.0%E; NOMINAL Q/Q: -0.3% V -0.3%E; Exports -1.8% q/q (largest decline since Q1 2015); GDP Business Spending q/q: -0.2% v 0.2%e (1st decline since Q2 2016)
- (JP) Japan Economy Min Motegi: Q3 GDP contraction due to temporary hit to consumption from natural disasters, export decline; no change to view domestic economy recovering moderately
- (JP) Japan said to consider ending 30-month age cap on US beef imports - Japanese Press
- (JP) Japan Sept Final Industrial Production M/M: -0.4% v -1.1% prelim; Y/Y: -2.5% v -2.9% prelim; Capacity Utilization M/M: -1.5% v 2.2% prior
- (JP) Japan Sept Tertiary Industry Index M/M: -1.1% v -0.4%e (largest decline since 2016)
Korea
- Kospi opened flat
- (KR) South Korea Oct Unemployment Rate: 3.9% v 4.0%e
- (KR) South Korea Fin Min nominee Hong: Job situation is still grave, considering more steps on jobs - Korean press
- 005380.KR Govt putting pressure on union to join new plant in Gwangju as part of efforts to create new jobs and breathe new life into the local economy - Press
China/Hong Kong
- Hang Seng opened +0.3%, Shanghai Composite -0.3%
- (CN) MSCI announced constituent changes to China Indexes
- (CN) China PBoC Open Market Operation (OMO):Skips OMO v skipped prior (14th straight skip)
- (CN) CHINA PBOC SETS YUAN REFERENCE RATE: 6.9402 V 6.9629 PRIOR
- 2378.HK Prudential: Gives update ahead of conference: 9-month New Business Profit £2.76B v £2.35B y/y, APE Sales £4.97B v £4.96B y/y
- (CN) China NBS Spokeswoman Liu Aihua: China economy still facing many external uncertainties; economy is slower but stable; Room for policy adjustments remains relatively large as inflation remains mild
- (CN) China Oct Property Investment y/y: 9.7% v 9.9% prior
- (CN) CHINA OCT FIXED ASSETS EX-RURAL YTD Y/Y: 5.7% V 5.5%E
- (CN) CHINA OCT RETAIL SALES Y/Y: 8.6% V 9.2%E; YTD Y/Y: % V 9.3%E
- (CN) China Oct Surveyed Jobless Rate: 4.9% v 4.9% prior
- (CN) CHINA OCT INDUSTRIAL PRODUCTION Y/Y: 5.9% V 5.8%E; YTD Y/Y: 6.4% V 6.3%E
- (CN) China MoF sells 2-yr bonds at 2.7265% v 2.88%e; 5-yr bonds at 3.0737% v 3.23%e
- (CN) CHINA OCT AGGREGATE FINANCING (CNY): 728.8B V 1.380TE
- (CN) CHINA OCT M2 MONEY SUPPLY: 8.0% V 8.4E (matches record low); M1 MONEY SUPPLY Y/Y: 2.7% V 4.2%E
- (CN) CHINA OCT NEW YUAN LOANS (CNY): 697.0B V 904.5BE
- Looking ahead: 700.HK Tencent: Expected to report earnings later today
- (CN) China speculated to hold meeting on coal imports later today - Local Press
Australia/New Zealand
- ASX 200 opened flat
- AOG.AU Warns FY19 sales now at risk as residential markets continue to soften; will not affirms FY19 EPS – AGM [-7%]
- (AU) Australia Nov Westpac Consumer Confidence Index:104.3 v 101.5 prior; M/M: 3.9% v 1.0% prior
- (AU) Australia sells A$1.0B v A$1.0B indicated in Nov 2029 bonds, avg yield 2.7366%, bid to cover 3.91x
- (AU) AUSTRALIA Q3 WAGE PRICE INDEX Q/Q: 0.6% V 0.6%E; Y/Y: 2.3% V 2.3%E (matches the highest growth since 2015)
- RAP.AU Receives ISO 13485 certification for quality management system [+15%]
Other Asia
- (SL) SRI LANKA CENTRAL BANK (CBSL) RAISES KEY RATES (NOT EXPECTED)
North America
- US equity markets ended mostly lower: Dow -0.4%, S&P500 -0.2%, Nasdaq flat, Russell 2000 -0.3%
- (US) Fed's Quarles (hawk, FOMC voter): Fed is taking a number of measures to improve transparency - Congressional testimony
- MMM Authorizes $10B share repurchase program (9% of market cap)
- (US) US planning to hold off on implementing auto tariffs for now after Trump meeting
- BA FAA denies reports it is conducting investigation into safety of 737 MAX planes following crash of Lion Air flight 610
- SNAP Said to be cooperating with US regulators on inquiries possibly related to IPO, has responded to subpoenas and other requests from the DoJ and SEC - financial press
Europe
- (UK) Five pivotal senior ministers reportedly back UK Prime Min May's draft Brexit proposal - Sun's Newton Dunn; Raab, Hunt, Javid, Gove and Cox support the plan; Leadsom and Grayling also McVey and Mordaunt do not support the plan
- (IT) Italy Dep PM Di Maio: confirms Italy govt maintaining its 2019 budget deficit and growth targets
- (IT) Italy 5 Star League Official: Italian Government agrees on 2.4% budget deficit for 2019 - Comments on draft reply to EU
- (IT) Italy publishes letter to the EU: Asks EU for flexibility for extraordinary events. Sets privatization target at 1% of GDP for 2019; Plans €1B for infrastructure maintenance in 2019; Targets 2021 debt-to-GDP ratio of 126%
- (UK) Tory Whip Julian Smith: Confident that PM May will get Brexit deal through Parliament - financial press
Levels as of 12:50ET
- Hang Seng -0.6%; Shanghai Composite -0.6%; Kospi -0.3%; Nikkei225 0.0%; ASX 200 -1.7%
- Equity Futures: S&P500 -0.1%; Nasdaq100 -0.1%, Dax -0.1%; FTSE100 -0.5%
- EUR 1.1217-1.1320; JPY 113.76-113.99 ; AUD 0.7214-0.7238;NZD 0.6756-0.6783
- Dec Gold +0.2% at $1,203/oz; Dec Crude Oil -0.7% at $55.30/brl; Dec Copper -0.3% at $2.67/lb
Brexit, Italy And Oil Moves Make For Volatile Day Ahead
All eyes on 2pm UK cabinet meeting as May secures Brexit deal
It promises to be another interesting and potentially volatile day on Wednesday, with Brexit, the Italian budget, Sino-US trade and oil markets all battling for the spotlight.
After more than a year of negotiations and days of intense talks to get a deal wrapped up in time for an emergency EU summit this month, it was reported on Tuesday that Theresa May has come to an agreement with the EU and will seek the support of her cabinet on Wednesday, something that initially sent the pound soaring.
The pound quickly lost its spark though as a long list of politicians - that have been very vocal on the negotiations over the last 18 months – cast doubt on the ability of the reported deal to get through parliament and in some cases vowed to vote it down.
This was always likely to be the harder sell for May and the next month will be her most challenging so far but she’ll be confident that what she has appeases enough people to get it over the line. Whether it truly delivers on the referendum, protects the integrity of the United Kingdom and averts an economic shock is another matter entirely and will determine its success. The alternative though could be chaos.
Rome risks stand-off with Brussels
Italy called the European Commission’s bluff on Tuesday, re-submitting the draft budget without any changes to its 2.4% deficit target or its 1.5% growth targets that many have called unrealistic. The government instead agreed to continually monitor the deficit and ensure it doesn’t exceed the target and offered up asset sales of up to 1% of GDP and bring total debt down to 126% of GDP (from around 132% currently) as a sweetener to try and get an agreement over the line and avoid sanctions.
The ball is now in the ECs court and it must decide whether it wants a showdown with Rome which could cause turmoil for the country and fuel further anger and resentment towards Brussels. This comes at a time when populism and nationalism is already sweeping across the block and posing a threat to it. I don’t see the EC backing down as it would set a precedent for other countries to follow suit. This could present a significant risk for Italian investors in the near-term, with bonds and banks being particularly sensitive to the outcome. We could get a response from the EC by next week, leaving investors very nervous in the interim.
Oil plunges again as Trump calls for lower prices
Oil prices were in freefall on Tuesday, as another Tweet from Trump pressuring OPEC not to cut oil production and a report from the cartel alluding to lower oil demand sent Brent and WTI crashing more than 7%. This is the fourth consecutive reduction to OPECs demand growth forecasts and comes at a time when supply is rising faster than expected.
Regardless of Trump’s tweet, I struggle to see how we don’t see a production cut at the meeting early next month – with the Saudi’s having already announced a 0.5 million barrel a day cut for December – but markets are not yet pricing this in and with momentum very much with the sellers, they could easily go much lower before then. We may see some near-term support around $55 in WTI and $65 in Brent but I wouldn’t be surprised to see these slip back to $50 and $60, respectively.
It’s been a perfect storm for oil as of late, with lower global growth expectations, higher output from the US, Russia and Saudi Arabia, waivers on Iranian sanctions and general risk aversion in the markets sending Brent and WTI rapidly into bear market territory. The It’s not too long ago that people were talking about the prospect of $100 a barrel oil but that now feels like a distant memory.
GBPUSD Soars Over Brexit News
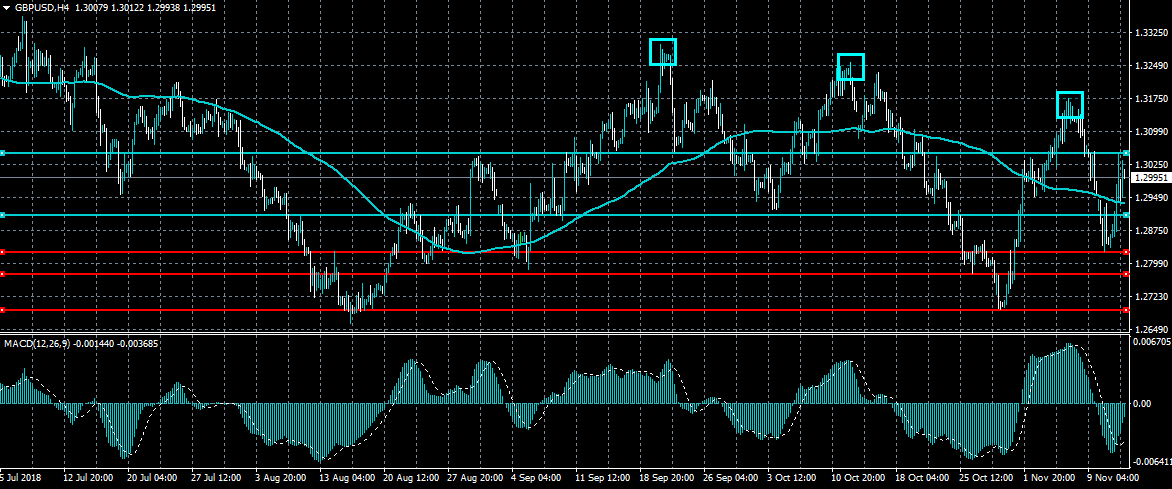
The British pound has surged higher against the US dollar, hitting 1.3045, following the news that the UK is close to securing a Brexit deal with the European Union. The GBPUSD pair is intraday bullish above the 1.2900 level and remains highly sensitive to incoming Brexit news. Bulls ideally need to break above the 1.3175 resistance level to negate the recent series of bearish lower highs.
The GBPUSD pair is intraday bullish while trading above the 1.2900 level, key technical resistance is now found at the 1.3090 and 1.3175 levels.
If the GBPUSD pair trades below the 1.2945 level, key support is found at the 1.2900 and 1.2836 levels.
EURUSD Bears Need To Defend 1.1300 Level
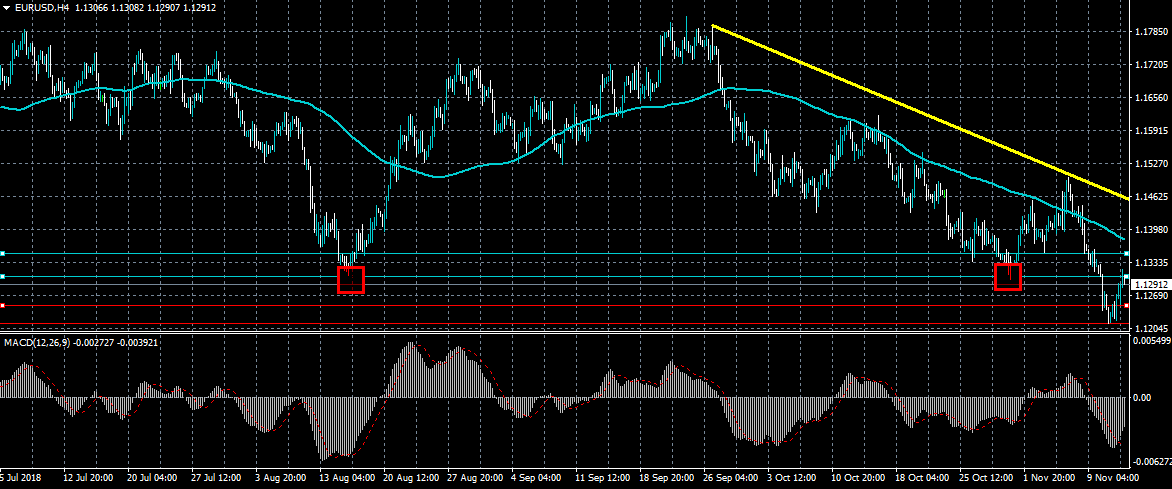
The euro has recovered back towards the 1.1300 resistance level against the US dollar over-optimism that the United Kingdom and the European Union are close to securing a Brexit deal. EURUSD sellers need to keep the price below the 1.1300 level to maintain the bearish pressure placed on the pair earlier this week. If bulls hold price above the 1.1300 level, we are likely to see a strong technical rebound towards the 1.1450 resistance level.
The EURUSD pair is only bullish while trading above the 1.1300 level, key resistance is now found at the 1.1380 and 1.1450 levels.
If the EURUSD pair trades below the 1.1300 level, key intraday support is found at the 1.1250 and 1.1216 levels.
Bitcoin Slide Continues As Ripple Tackles Swift
Last week, the price of Ripple jumped sharply after a news report said that the company was planning to partner with SWIFT – the biggest provider of global financial messaging services. The member-owned cooperative plays an important role in the world economy with banks making use of its services. For example, with an interbank wire transfer, the corresponding bank will receive a message through the SWIFT network.
While news of a potential Ripple/SWIFT collaboration pushed the price of Ripple from $0.49 to a high of 0.53, Ripple CEO Brad Garlinghouse made it very clear that no partnership would be taking place. On Bloomberg TV he explained how contrary to what SWIFT believes, blockchain and banking can go hand-in-hand confirming that at least 100 SWIFT-connected banks have signed on with Ripple.
“SWIFT said not that long ago they didn’t see blockchain as a solution to correspondent banking. We’ve got well over 100 of their customers saying they disagree. What we’re doing and executing on a day-by-day basis is, in fact, taking over SWIFT.”
Ripple is unlike other cryptocurrencies such as Bitcoin and Ethereum. Bitcoin was created to replace fiat currencies while ETH was created to help in the smart contract business. Ripple, on the other hand, was built to simplify international remittances. According to CoinMarketCap, Ripple is valued at $20 billion, making it the third biggest cryptocurrency after Bitcoin and Ethereum.
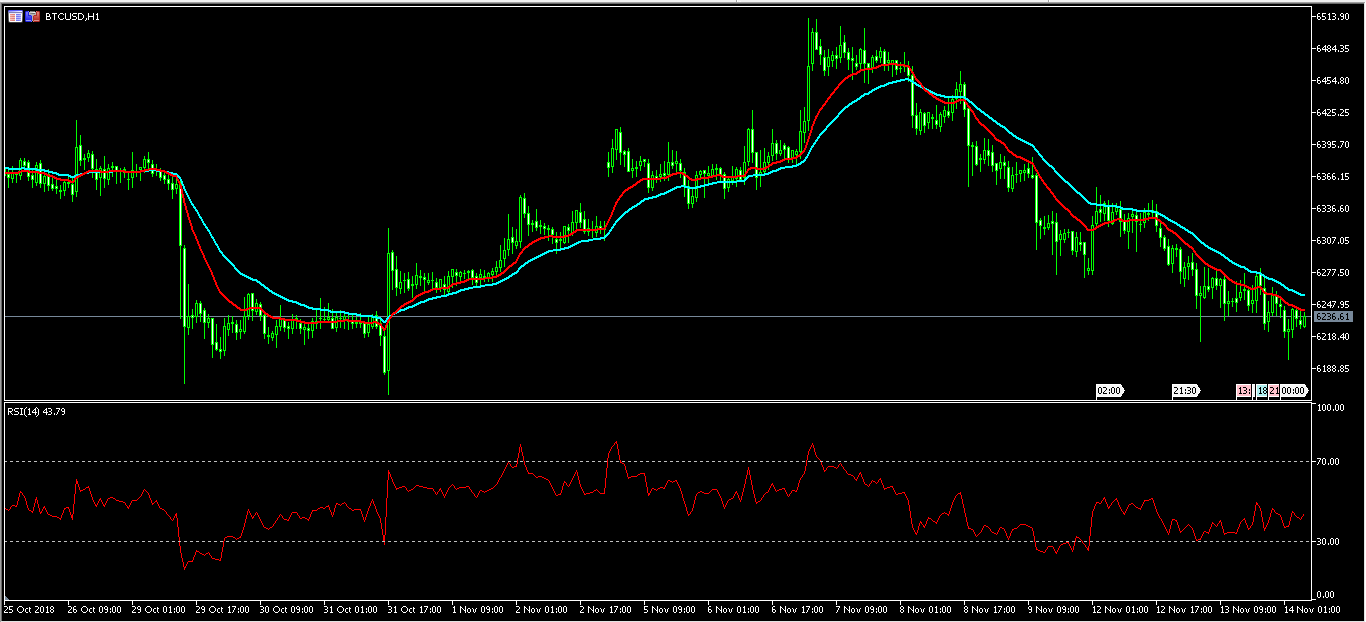
Meanwhile, the price of Bitcoin has been on a freefall. In the past few days, the price has dropped from a high of $6510 to an intraday low of $6196. The BTC/USD pair’s exponential moving averages point to a continued decline for the pair. The RSI, which is at 44 indicates that the pair will likely continue moving lower. If it does, it will possibly test the psychologically-important level of 6000.
Sterling Rises Cautionously Ahead Of Theresa May’s Toughest Day
Sterling rose after the United Kingdom hammered a deal with the European Union on Brexit. Prime Minister Theresa May now faces a crunch cabinet meeting later today during which she’ll try to win her colleagues’ support for the Brexit draft. Even before the legislators read the 400-page document, many of them said that they would not support the proposal. If the deal is rejected, it will subject the UK to a difficult scenario and raise the risk of a no-Brexit deal. Brexit news will be the main mover in the pound today even as the country releases important CPI numbers.
The yen continued to decline against the USD after Japan released important Q3 GDP numbers which showed that the economy contracted by minus 1.2% in the quarter. This was lower than traders were expecting and lower than the Q2 expansion of 3%. It was also the slowest pace since 2016. On a QoQ basis, the economy contracted by minus 0.3%. The GDP capital expenditure dropped by minus 0.2%, which was lower than the consensus estimate of 0.6% growth. The surprising contraction of the economy is likely a sign that the BOJ will hold rates steady for a long period.
China released mixed economic data today. The country’s retail sales rose by an annualized rate of 8.6%. This was lower than the consensus estimate of 9.2%. The unemployment rate remained unchanged at 4.9%. On the other hand, in October, industrial production rose by 5.9%, which was higher than the estimate of 5.8%. Fixed asset investments rose by 5.7%, which was higher than the estimate of 5.5%.
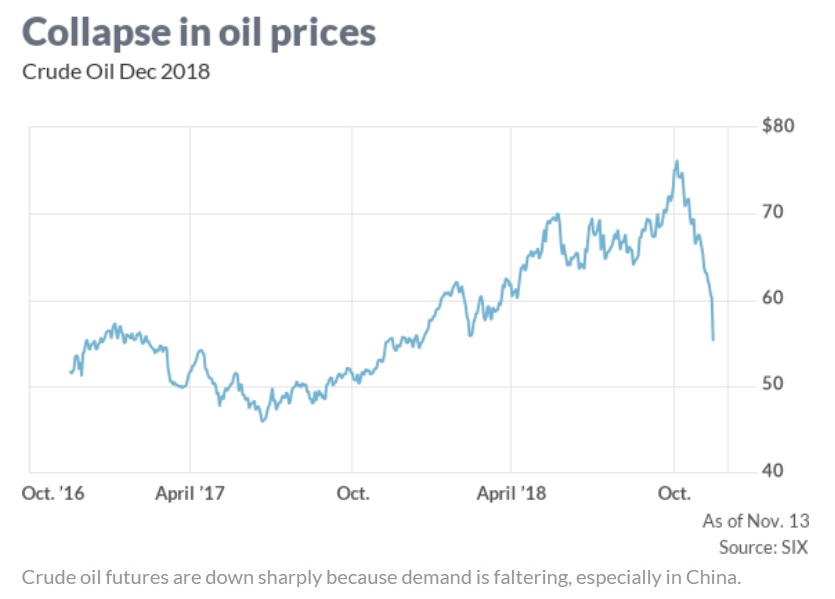
Crude oil had the sharpest decline in months yesterday. In the Asian session, the price continued to decline, reaching an intraday low of $64.82. In the past few weeks, the price has moved from a four-year high to the current bear market. The declines have erased hopes by the market that the price will reach $100 this year. The main reason for the decline is that while the world is flooded with crude oil, the demand has slowed.
EUR/USD
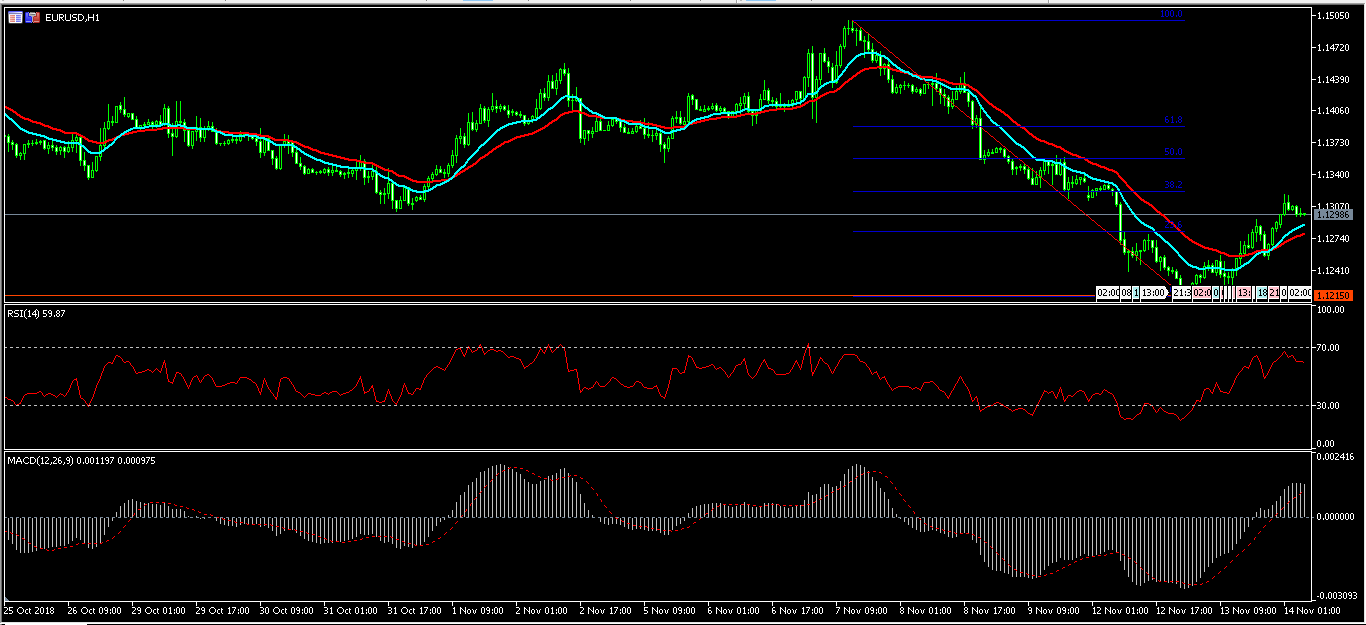
The EUR/USD pair rose in the Asian session to reach an intraday high of 1.1320. This was along the 38.2% Fibonacci Retracement level. The pair’s RSI is at 59 and heading down – an indication that the pair could see some declines today. This is confirmed by the MACD, which appears to be losing momentum. In the immediate short term, the pair is likely to test the 23.6% Fibonacci Retracement level of 1.1280. The biggest movers for the pair will be Brexit, EU employment numbers, and US inflation numbers.
GBP/USD
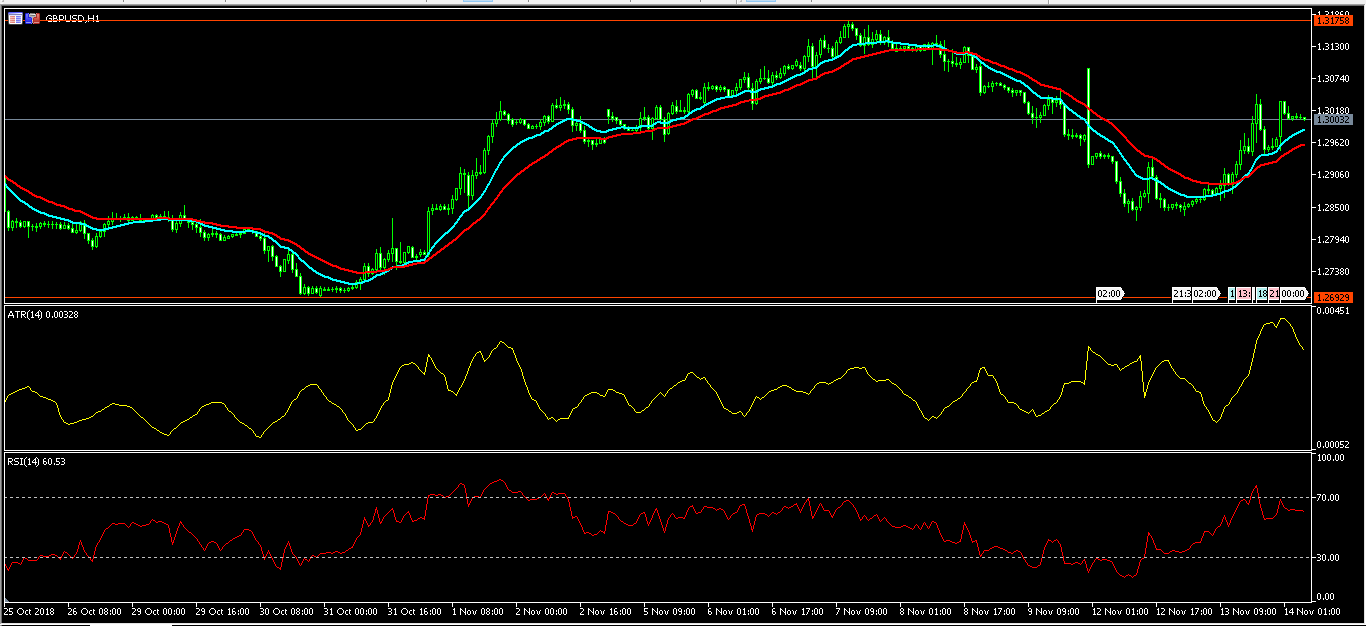
The GBP/USD pair rose to an intraday high of 1.3033. As the pair rose, so did the Average True Range (ATR) indicator, which is a measure of volatility. This is because there are concerns that the deal will not be accepted by May’s cabinet and parliament. The double EMA shows that the pair is likely to continue moving up, which is confirmed by the RSI. However, since today will be the most important day in terms of Brexit, the pair will likely be a bit volatile.
XBR/USD
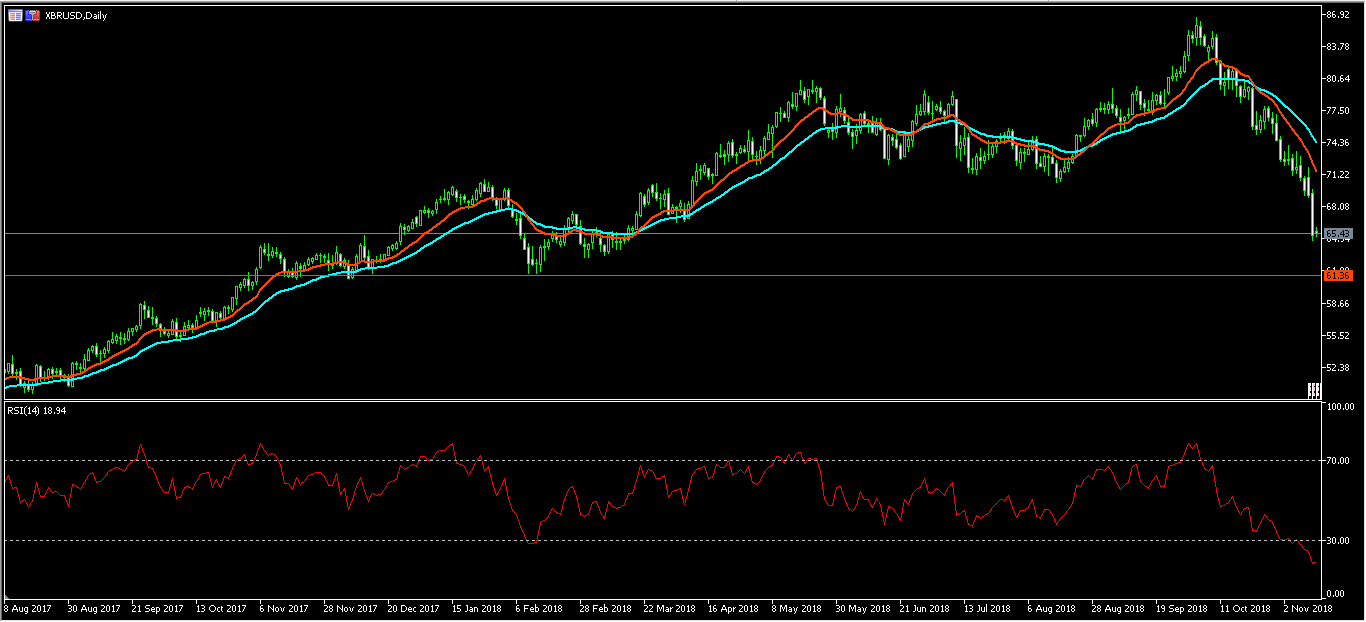
Brent crude oil declined sharply to an intraday low of $64.70. This was a 25% drop from this year’s high of $86. The XBR/USD double EMAs on the daily chart show that the pair is likely to continue the downward momentum. The RSI has declined to the oversold level of 18, which is a sign of the strength of the decline. It is also a sign that the pair could recover when it reaches an important support level. This support will likely be 61 or 60. Today, traders will be watching US crude stocks data, which will be released by EIA.
China’s Coming Recession Has Pushed Oil Below $60
Most market participants are having a hard time explaining why the price of crude oil CLZ8, -0.48% dropped like a rock during a time when the United States began to enforce sanctions on Iranian exports on Nov. 4 — sanctions centered on the extraordinary demand that the world stop buying Iranian oil (with generous exemptions). I'd say that a 20% decline in the price of oil in about a month falls into the category of rare events and may not have anything to do with supply, but rather that other driver of prices called demand.
Which country is the largest importer of oil, and therefore the largest driver of crude oil prices on global markets? China. In 2017, China overtook the U.S. as the largest importer of oil, so economic developments in China should be closely monitored by oil traders, as the Chinese economy is likely headed into a massive recession, and not due to the present trade frictions with the Trump administration.
The previous time we had such a sharp drop was in 2014-15, and that was clearly due to Chinese economic deceleration coupled with surging U.S. shale production. In 2018, we again have surging U.S. oil production, which surged past 11 million barrels per day, and we also have a decelerating Chinese economy driven by the belated actions of the Chinese government to deleverage its financial system. It is true that in prior years we have had bigger declines that were not primarily driven by China, the most notable of which was 2008, but China was not the dominant force in the crude oil market then. Today it is.
The Chinese “economic miracle” is built on a mountain of debt. As Chinese GDP grew over 12-fold in 20 years to $12.24 trillion at the end of 2017, credit in the Chinese financial system grew over 40-fold, taking the debt-to-GDP ratio from 100% to 400%, if one counts the shadow banking system. Shadow banking credit aggregates are omitted from official statistics, but they add at a minimum 100% to the total debt to GDP ratio for China.
The fact that such centralized macroeconomic management has worked for 25 years does not mean that it will keep working forever. I do not believe the Chinese can eliminate the economic cycle. Instead, the credit bubble that they have engineered will cause the coming recession to be a lot worse than it otherwise would have been, drawing parallels to the 1930s Great Depression in the U.S.
I think that what we will see in China, soon, will be the equivalent of what we saw in 2008. The final outcome will depend entirely on the policy response of the Chinese authorities. The American authorities made a lot of mistakes in 1929 and following years, resulting in the Great Depression. In 2008, the American authorities did not repeat those mistakes. I think we will find out soon enough what outcome the Chinese authorities will end up creating.
Cryptocurrency Mining Farms In China Shut Down For ‘Strict’ Tax Inspections
Cryptocurrency mining operations in the Chinese provinces of Xinjiang and Guizhou were suspended so the government could conduct “very strict” tax inspections and real-name registration checks. Power to the mining farms was shut off on November 5, sources told local daily Cong News. As a result, the mines lost about 1 million yuan (or roughly $143,700) a day during the period of “rectification.”
“Joint enforcement actions examined the mine's tax information, funds, and customer information,” Cong News reported. “It is understood that the tax inspection of the mine is very strict.” The tax inspection is now complete, but it's unclear if power to the mining farms has been restored yet. “It is understood that the mines, including business licenses, state-of-the-art power supply procedures, and employee Social Security, are officially complete,” Cong News noted.
The mining farms were required to sign an agreement promising that their mining data centers will implement “higher standards for the company's business real-name system,” as mandated by China's Public Security Department. The farms also agreed to not provide services to any customers that do not comply with these rules. It's unclear how this shutdown affected Bitmain, which recently deployed 90,000 S9 Antminer rigs to the coal-rich region of Xinjiang ahead of the Bitcoin Cash hard fork, which is scheduled for November 15.
Bitmain — the world's most valuable cryptocurrency company — is making moves to maintain its market dominance amid reports that its smaller rival Bitfury is considering an initial public offering in Amsterdam or London as early as 2019. The move would make Bitfury the first major crypto IPO listed in Europe, as CCN has reported. The Amsterdam-based blockchain startup could seek a valuation of $3 billion to $5 billion. In September 2018, Bitmain filed for an initial public offering in Hong Kong, with a potential valuation of up to $3 billion. Bitmain — which is valued at $10 billion — is on track to post $10 billion in revenue by the end of 2018.
EUR/USD Starts Rebound. USD/JPY Remains In Uptrend
EUR/USD found support near 1.1215 and started a short term correction. USD/JPY remains in an uptrend above the 113.70 support and resistance awaits near 114.10.
Important Takeaways for EUR/USD and USD/JPY
- The Euro declined heavily below 1.1300 until buyers appeared near the 1.1215 level.
- There was a break above a key bearish trend line with resistance at 1.1280 on the hourly chart of EUR/USD.
- USD/JPY settled above the 113.50 and 113.70 resistance levels.
- The pair is holding an important bullish trend line with support at 113.80 on the hourly chart.
EUR/USD Technical Analysis
The Euro started a major downside move from the 1.1500 resistance area against the US Dollar. The EUR/USD pair broke the 1.1440 and 1.1350 support levels to register nasty declines.
The pair even broke the 1.1280 support and settled below the 50 hourly simple moving average. Sellers pushed the pair close to the 1.1200 support area and formed a low at 1.1215. Later, the pair started an upside correction and recovered above the 1.1250 resistance.
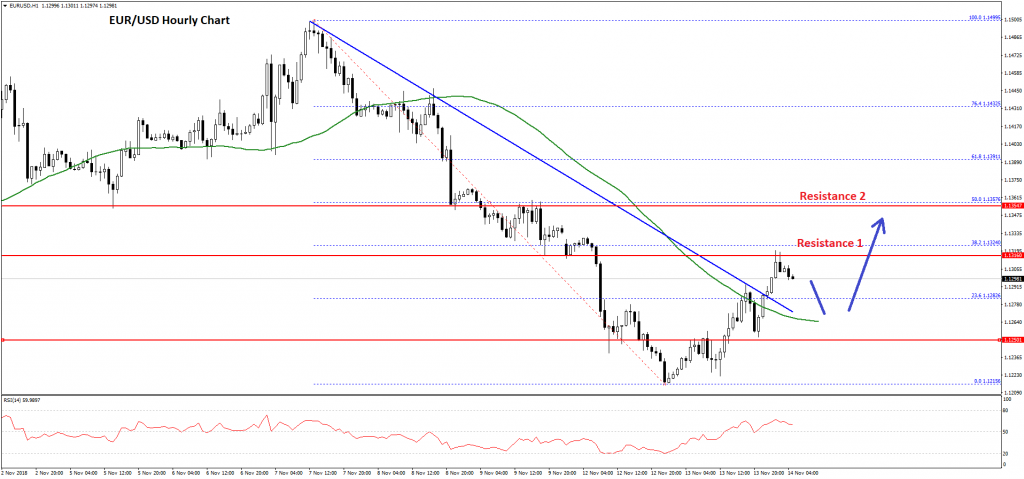
During the recovery, the pair moved above the 23.6% Fib retracement level of the last decline from the 1.1499 high to 1.1215 low. Moreover, there was a break above a key bearish trend line with resistance at 1.1280 on the hourly chart.
The pair traded above the 1.1280 resistance and the 50 hourly simple moving average. However the upside move was capped by the 1.1320 resistance area, which was a support earlier.
The pair is currently consolidating near 1.1300 and it seems like there could be a minor downside correction before the pair resumes its recovery. An initial support on the downside awaits near 1.1285, below which EUR/USD could test the 1.1265 level and the 50 hourly SMA.
On the upside, the pair must break the 1.1320 resistance to resume its recovery. The next major resistance awaits near 1.1350 and the 50% Fib retracement level of the last decline from the 1.1499 high to 1.1215 low.
USD/JPY Technical Analysis
There were continuous gains in the US Dollar above the 113.00 support level against the Japanese Yen. The USD/JPY pair traded above the 113.50 and 113.70 resistance levels to move further into the bullish zone.
The upside move was such that the pair broke the 114.00 resistance and traded as high as 114.24. Later, there was a downside correction and the pair declined below the 114.00 level. However, the decline was protected by the 113.70 area, which was a resistance earlier and now it is acting as a support.
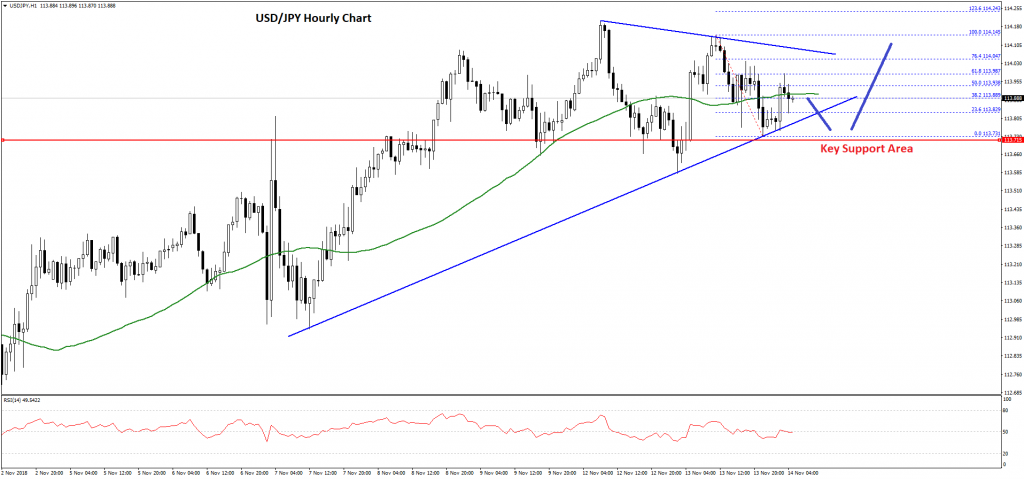
More importantly, there is an important bullish trend line with support at 113.80 on the hourly chart. The pair is currently moving higher towards the 61.8% Fib retracement level of the recent decline from the 114.15 high to 113.73 low.
It is currently trading above the 50 hourly simple moving average and 113.80, but it could face a solid resistance near the 114.05 and 114.10 levels. There is also a connecting bearish trend line at 114.10 on the same chart.
Therefore, a break above the trend line is needed for more gains above the 114.20 and 114.40 levels. Overall, it seems like USD/JPY may continue to consolidating above 113.70 before the next move. It will most likely climb higher towards 114.50 unless sellers push the pair below 113.70 and 113.50.