

Sample Category Title
Britain’s Economic Growth Expanded At Its Quickest Pace In Two-Years In 3Q 2018
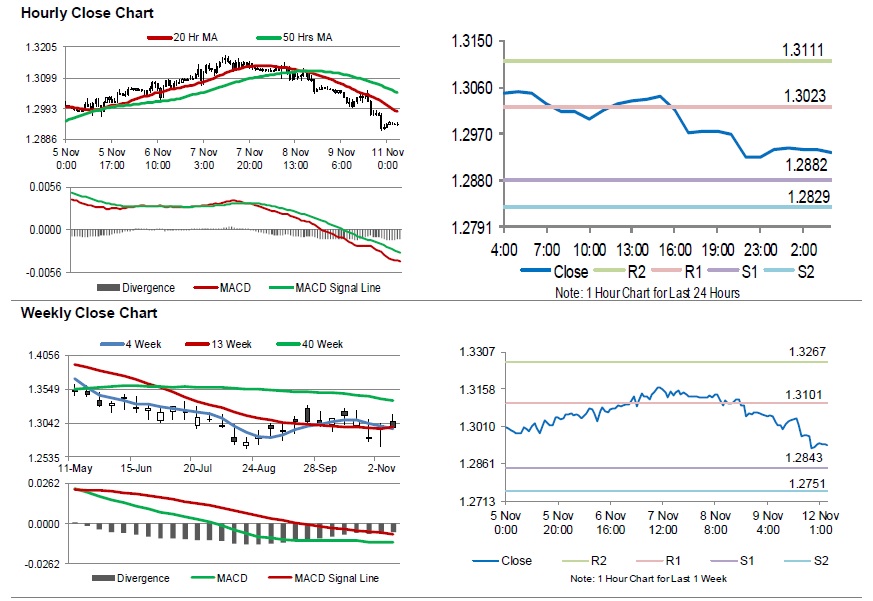
For the 24 hours to 23:00 GMT, the GBP declined 0.74% against the USD and closed at 1.2970 on Friday.
On the data front, UK's flash gross domestic product (GDP) climbed 0.6% on a quarterly basis in 3Q 2018, notching its highest level in two-years and in line with market expectations. In the previous quarter, the GDP had recorded a rise of 0.7%. Moreover, the nation's construction output increased 1.7% on a yearly basis in September, higher than market consensus for a gain of 1.3%. The construction output had registered a revised drop of 0.3% in the preceding month. Additionally, the nation's industrial production remained flat on an annual basis in September, following a revised rise of 1.0% in the prior month. Market participants had anticipated industrial production to advance 0.4%. Moreover, UK's visible trade deficit narrowed to a seven-month low level of £9.73 billion in September, compared to a revised visible trade deficit of £11.72 billion in the previous month. Market participants expected the nation to record a deficit of £11.40 billion.
In the Asian session, at GMT0400, the pair is trading at 1.2935, with the GBP trading 0.27% lower against the USD from Friday's close.
The pair is expected to find support at 1.2882, and a fall through could take it to the next support level of 1.2829. The pair is expected to find its first resistance at 1.3023, and a rise through could take it to the next resistance level of 1.3111.
In absence of key economic releases in the UK today, investor sentiment would be determined by global macroeconomic events.
The currency pair is trading below its 20 Hr and 50 Hr moving averages.
Japanese Yen Reverses Its Gains In The Morning Session
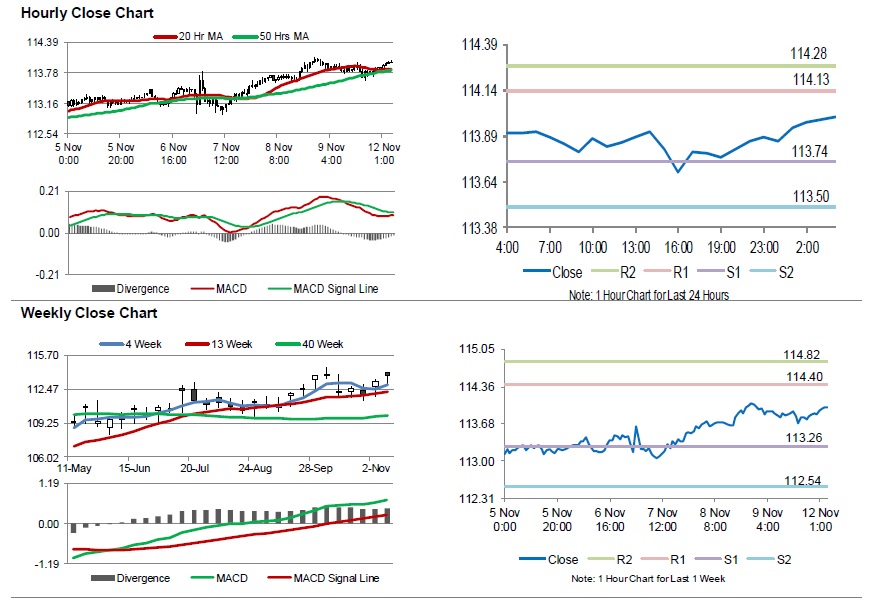
For the 24 hours to 23:00 GMT, the USD declined 0.19% against the JPY and closed at 113.81 on Friday.
In the Asian session, at GMT0400, the pair is trading at 113.99, with the USD trading 0.16% higher against the JPY from Friday’s close.
The pair is expected to find support at 113.74, and a fall through could take it to the next support level of 113.5. The pair is expected to find its first resistance at 114.13, and a rise through could take it to the next resistance level of 114.28.
Looking ahead, traders would await Japan’s machine tool orders for October, scheduled to release in a while.
The currency pair is trading above its 20 Hr and 50 Hr moving averages.
Swiss Franc Trading Lower This Morning
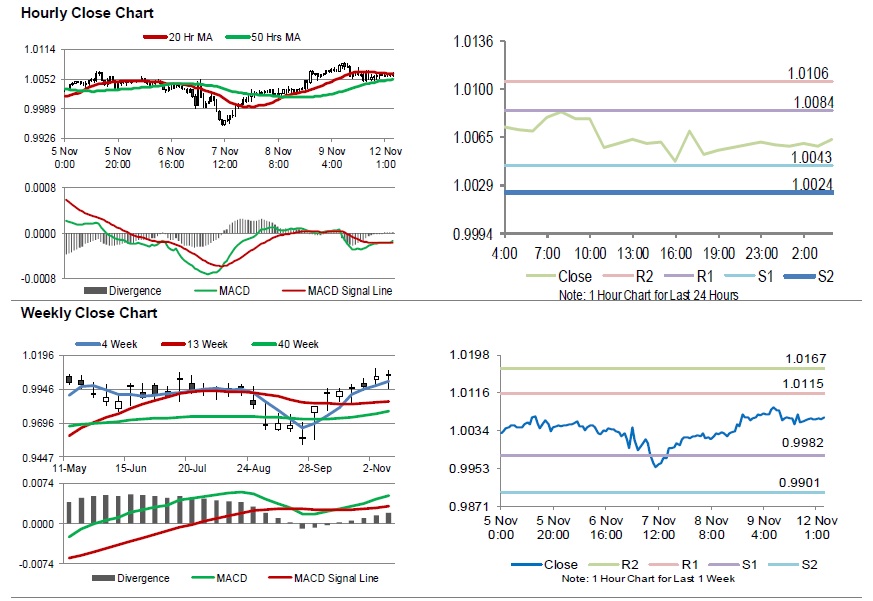
For the 24 hours to 23:00 GMT, the USD remained flat against the CHF and closed at 1.0057 on Friday.
In the Asian session, at GMT0400, the pair is trading at 1.0063, with the USD trading 0.06% higher against the CHF from Friday’s close.
The pair is expected to find support at 1.0043, and a fall through could take it to the next support level of 1.0024. The pair is expected to find its first resistance at 1.0084, and a rise through could take it to the next resistance level of 1.0106.
Moving forward, investors would keep an eye on Switzerland’s total sight deposits, due to release in a while
The currency pair is showing convergence with its 20 Hr moving average and trading above its 50 Hr moving average.
Loonie Trading On A Stronger Footing In The Morning Session
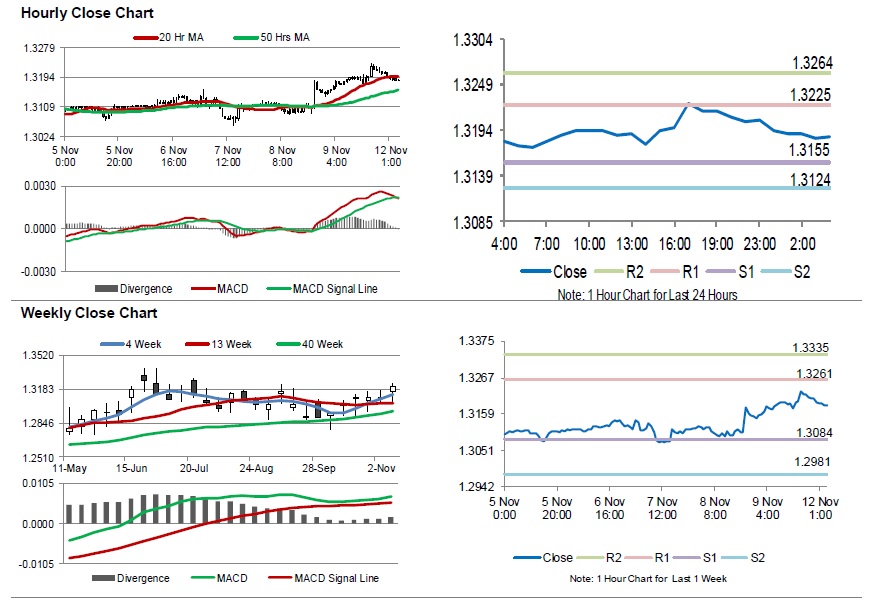
For the 24 hours to 23:00 GMT, the USD rose 0.45% against the CAD and closed at 1.3210 on Friday.
In the Asian session, at GMT0400, the pair is trading at 1.3186, with the USD trading 0.18% lower against the CAD from Friday’s close.
The pair is expected to find support at 1.3155, and a fall through could take it to the next support level of 1.3124. The pair is expected to find its first resistance at 1.3225, and a rise through could take it to the next resistance level of 1.3264.
The currency pair is trading between its 20 Hr and 50 Hr moving averages.
Aussie Trading Higher In The Asian Session
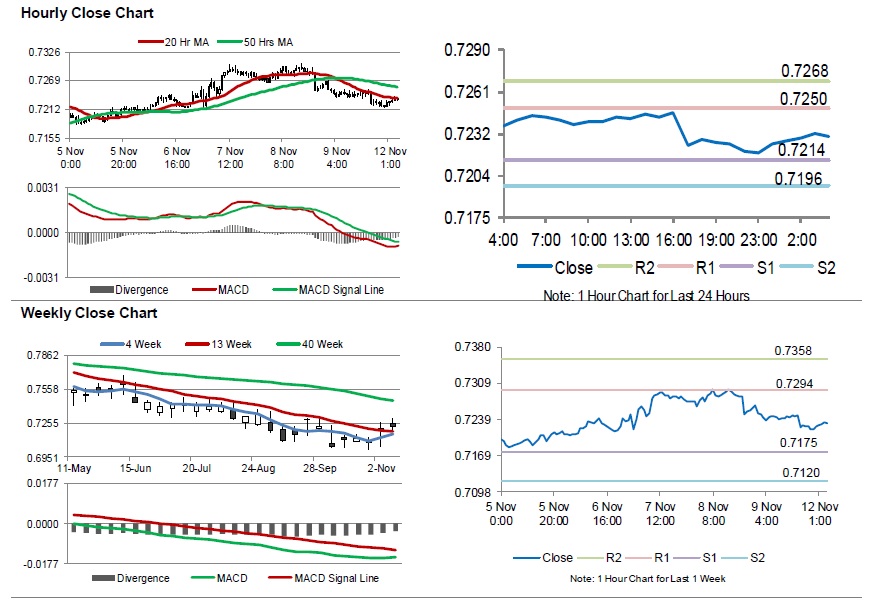
For the 24 hours to 23:00 GMT, the AUD declined 0.51% against the USD and closed at 0.7225 on Friday.
LME Copper prices declined 0.8% or $49.0/MT to $6088.0/MT. Aluminium prices rose/declined 0.6% or $12.5/MT to $1964.5/MT.
In the Asian session, at GMT0400, the pair is trading at 0.7231, with the AUD trading 0.08% higher against the USD from Friday’s close.
The pair is expected to find support at 0.7214, and a fall through could take it to the next support level of 0.7196. The pair is expected to find its first resistance at 0.7250, and a rise through could take it to the next resistance level of 0.7268.
Moving ahead, investors would keep an eye on Australia’s NAB business conditions and NAB business confidence indices, both for October, set to release overnight.
The currency pair is showing convergence with its 20 Hr moving average and trading below its 50 Hr moving average.
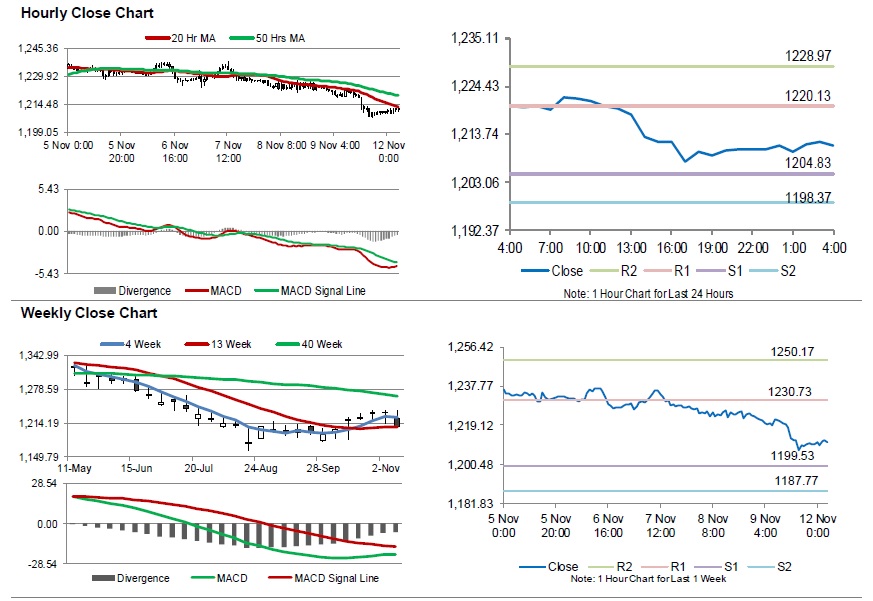
Gold: Yellow Metal Trading Higher In The Asian Session
For the 24 hours to 23:00 GMT, Gold declined 1.21% against the USD and closed at USD1209.00 per ounce on Friday, amid strength in the US dollar.
In the Asian session, at GMT0400, the pair is trading at 1211.30, with gold trading 0.19% higher against the USD from Friday’s close.
The pair is expected to find support at 1204.83, and a fall through could take it to the next support level of 1198.37. The pair is expected to find its first resistance at 1220.13, and a rise through could take it to the next resistance level of 1228.97.
The yellow metal is showing convergence with its 20 Hr moving average and trading below its 50 Hr moving average.
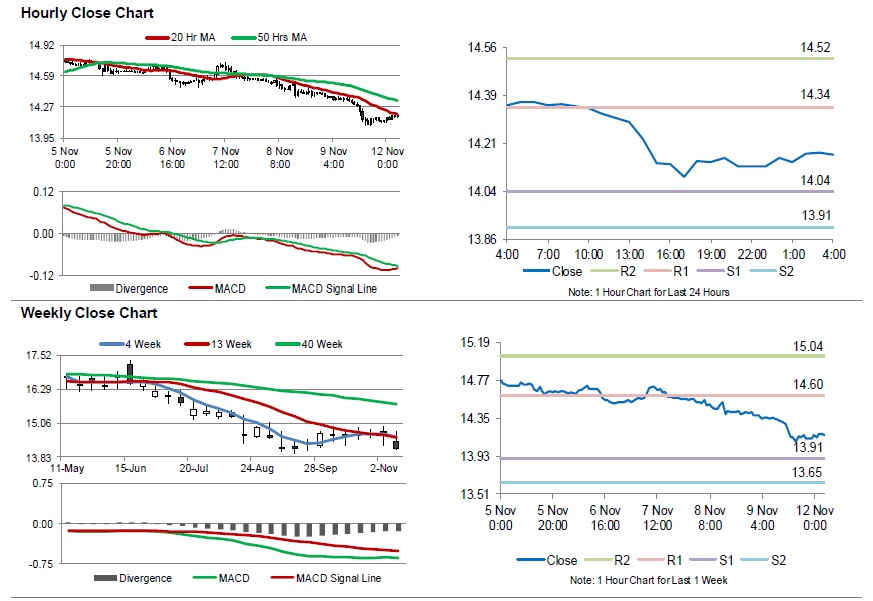
Silver: White Metal Reverses Its Losses This Morning
For the 24 hours to 23:00 GMT, Silver declined 1.73% against the USD and closed at USD14.16 per ounce on Friday, tracking losses in gold prices.
In the Asian session, at GMT0400, the pair is trading at 14.17, with silver trading 0.07% higher against the USD from Friday’s close.
The pair is expected to find support at 14.04, and a fall through could take it to the next support level of 13.91. The pair is expected to find its first resistance at 14.34, and a rise through could take it to the next resistance level of 14.52.
The white metal is showing convergence with its 20 Hr moving average and trading below its 50 Hr moving average.
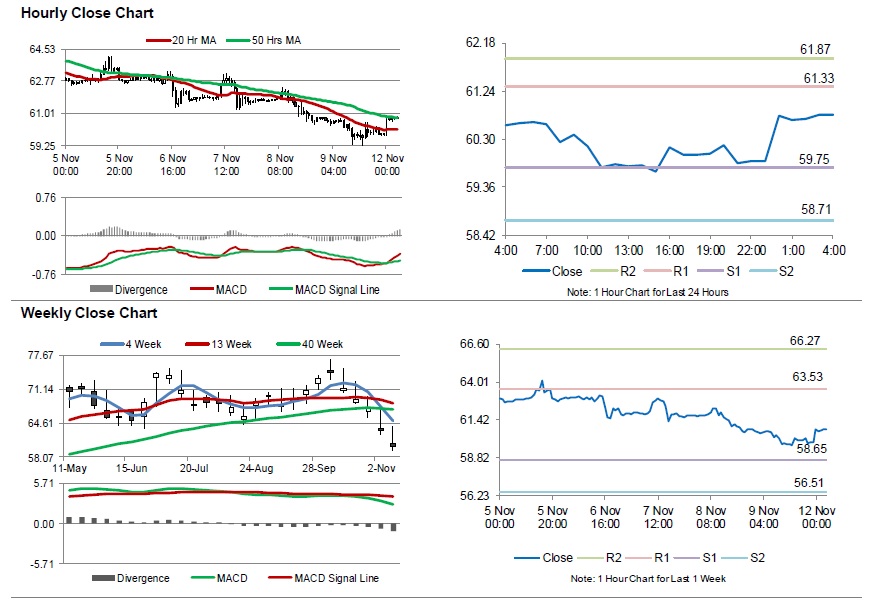
Crude Oil: Oil Trading On A Positive Footing In The Morning Session
For the 24 hours to 23:00 GMT, Crude Oil declined 0.92% against the USD and closed at USD60.19 per barrel on Friday, amid growing concerns over rising output and economic slowdown. Additionally, fresh figures from Baker Hughes disclosed that the number of active oil rigs climbed by 12 rigs to 886, in the week ended 09 November, recording its biggest increase since the week ended 25 May 2018.
In the Asian session, at GMT0400, the pair is trading at 60.78, with oil trading 0.98% higher against the USD from yesterday’s close.
The pair is expected to find support at 59.75, and a fall through could take it to the next support level of 58.71. The pair is expected to find its first resistance at 61.33, and a rise through could take it to the next resistance level of 61.87.
Crude oil is trading above its 20 Hr moving average and showing convergence with its 50 Hr moving average.
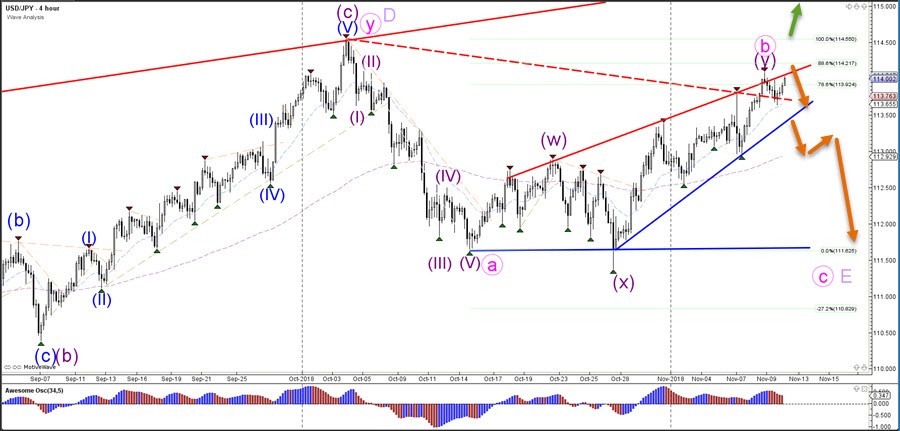
USD/JPY Tests Ultimate 88.6% Fibonacci Resistance Level
The USD/JPY bounced at the broken resistance trend line (dotted red) and is now testing the ultimate and last 88.6%Fibonacciretracement level, which is the final decision zone for the wave B (pink).
The USD/JPY bullish breakout indicates that a different wave pattern is likely to be valid whereas a bearish reversal could confirm the waveB (pink) and the start of wave C (pink) in larger wave E (purple).
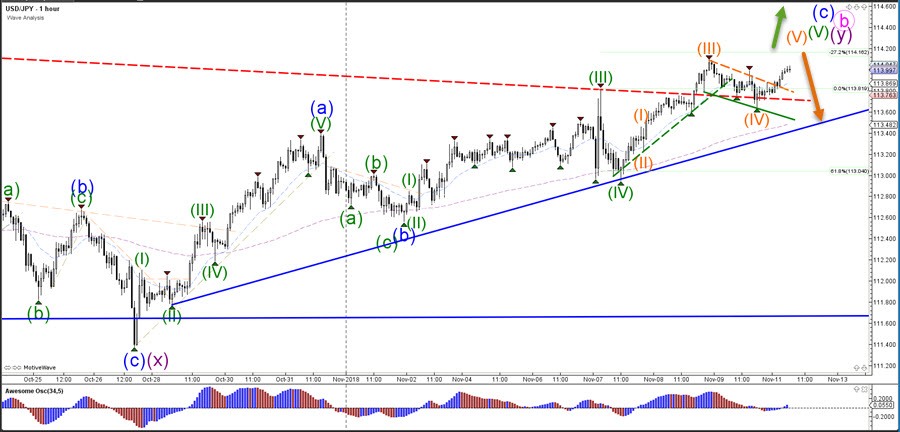
The USD/JPY seems to be building its final wave 5 (orange) of a wave 5 (blue) but whether price will start an uptrend or finish the bearish zigzag pattern remains unclear until we either see bearish or bullish price action or candlestick patterns become available at the 88.6% Fib.
Market Morning Briefing: Euro Has Crucial Horizontal Support Coming Up Near 1.13
STOCKS
Most Indices seem to have staved off the acute bearishness that prevailed towards end-October, but are hesitating to move up further immediately.
We had outlined a broad range of 25000-27000 for the Dow (25989.30, -201.92) for the next several days. Within this, there was a bit of profit taking on Friday, which could well extend down to 25500 this week. On the higher side, allow for 26500 in case the market goes up. The essential thing is, the market is likely to be ranged for some days.
The DAX (11529.16, +1.84) was quiet on Friday, and might be consolidative for a few days while it makes up its mind to move up towards 11800 in the medium term, given that it has possibly found long-term Support at 11051.04 on 26th October.
The Nikkei (22246, -236.67) dippped a bit on Friday, as expected. Some more near-term dip might find medium-term Support at 22000. Long-term Support seen at 21500-250.
On the Shanghai (2596.05 -1.39%), although the downtrend since 3600 (Jan-18) still persists, the bounce from 2449.20 on 19th October is also signicant in the long-term. It suggests that current near-term dips could find Buyers in the 2550-2500 region.
Among all the Indices, the KOSPI (2079) looks the most bearish while it is unable to rise past 2100-20. Still, like the others, it could find Support on dips into the 2050-2000 region.
The Nifty (10585.20, -13.20) saw a minor dip on Friday, is quoting slightly lower on the NGX today, but may well find Buyers on dip towards 10400 over the next few days. Similarly the Sensex (35158.55) could dip towards 34000 and attract Buyers there.
COMMODITIES
Brent (71.03) could rise towards resistance near 71.50-72.00 on daily candles in this week. A break above 72, if it happens, might establish last week's 69.13 as a medium term low for Brent.
WTI (60.77) : There is immediate resistance for WTI near 61 and higher resistance on daily candles near 62. On 3 day and weekly line chart, there still appears to be some scope of a downmove towards 58 before it rises decisively again.
Gold (1211) could possibly fall a little more towards support near 1200 on 3 day and weekly candles before rising from there.
Copper (2.6970) could fall more towards support near 2.65 on daily candles in this week.
FOREX
Watch 1.13 on Euro. Global Dollar strength might still restrict the downside for USDINR above 72.44 (or max, above 72.20).
Dollar Index (96.98) could face some resistance near 97.20-25. However, preference is for a break above that level. Higher up there could also be some channel resistance near 97.50 on 3 day candles.
Euro (1.1328) has crucial horizontal support coming up near 1.13. Looking at the weekly line chart, the preference is bearish for the weeks ahead – that is, a break below 1.13 is possible.
Dollar Yen (113.98): While above support on daily candles near 113.75, Dollar Yen could still rise higher towards resistance near 114.5 on daily line chart in the next 1-2 weeks.
Euro-Yen (129.13) : The bias on Euro Yen has turned bearish with the break of support near 129.25 on daily candles. It could now move down targeting support levels near 128-127 over the next couple of weeks.
Pound (1.2939) came off after testing a high of 1.3175 last week and could now move lower towards support zone near 1.28-1.27 over the next 1-2 weeks.
Aussie (0.7233) : There could be some support for the Aussie near 0.7175-0.7150. A break below those levels would be quite bearish. Only a decisive break above 0.73 would change the bias from bearish to bullish.
Dollar Rupee (72.77) has opened higher. Global dollar strength in this could prevent further downside below 72.44-72.20.
INTEREST RATES
Friday saw the US 10Yr (3.18%) dips a bit from the post-FOMC 3.22%, perhaps reflecting the dip in the Brent (69.88) below 70. As mentioned, there is good medium-term Resistance at 3.30%. Need to see how far down the US 10Yr will fall if Brent continues to move down towards $65. Long-term Support available near 3.05%.
Even the German 10Yr (0.40%) and Japanese 10Yr (0.11%) have dipped from 0.45% and 0.12% respectively, contrary to our expectation of a rise towards 0.53% and 0.16% respectively. But, while the German 10Yr could move sideways for a while, the Japanese 10Yr may have Support near current levels.
The 10Yr GOI (7.77%) is coming down to test important Support at 7.75%. A break thereof could be very bullish for Indian bonds, possibly attracting foreign buying again, with a lower Crude being directly beneficial for lower Indian inflation.