

Sample Category Title
Japan PM Abe to boost infrastructure spending to ensure recovery continues
Japanese Prime Minister Shinzo Abe is pushing for more public infrastructure spending in the upcoming fiscal year. At the Council on Economic and Fiscal Policy (CEFP) meeting today, Abe requested his cabinets to draw out plans with focuses strengthening infrastructure to withstand earthquakes and frequent flooding.
Economy Minister Toshimitsu Motegi said after the CEFP that "the prime minister asked me to take firm measures to ensure that our economic recovery continues." Motegi added that Abe also said "public works spending program expected at the end of this year should be compiled with this point in mind."
A preliminary public works plan will be compiled by the end of this month and the final version would be ready by the end of the year.
EUR/USD Remains At Risk of More Losses
Key Highlights
- The Euro recovered recently, but it failed to move above 1.1500 against the US Dollar.
- There was a break below a key bullish trend line with support at 1.1425 on the 4-hours chart of EUR/USD.
- The US Producer Price Index in Oct 2018 increased 0.6% in Oct 2018 (MoM), more than the +0.2% forecast.
- Today, the France ILO Unemployment Rate for Q3 2018 will be released, which is forecasted to decline to 9.0%.
EURUSD Technical Analysis
The Euro recovered from the 1.1300 swing low against the US Dollar. However, the EUR/USD pair failed to break the 1.1500 resistance area and later started a fresh decline.
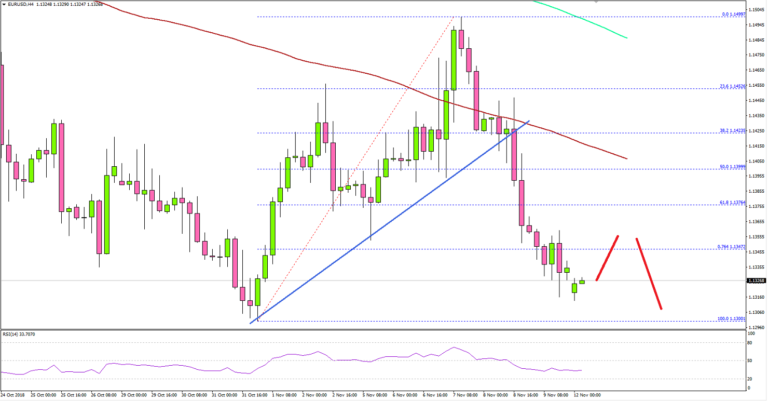
Looking at the 4-hours chart, the pair traded as high as 1.1499 and later started a sharp decline. The pair moved below the 1.1440 support zone and the 100 simple moving average (red, 4-hours).
It opened the doors for more losses and the pair declined below the 50% Fib retracement level of the last wave from the 1.1300 low to 1.1499 high. Moreover, there was a break below a key bullish trend line with support at 1.1425 on the same chart.
The pair even broke the 61.8% Fib retracement level of the last wave from the 1.1300 low to 1.1499 high, which is a bearish sign. Overall, it seems like the pair may continue to move down towards the 1.1310 or 1.1300 support levels.
If there is an upside correction, the broken supports near 1.1400 and 1.1420 are likely to act as strong hurdles for buyers in the near term.
Fundamentally, the US Producer Price Index for Oct 2018 was released by the Bureau of Labor statistics, Department of Labor. The market was looking for an increase of 0.2% in Oct 2018, compared with the previous month.
However, the result was better than the forecast as there was a rise of 0.6%. Looking at the yearly change, the US PPI increased 2.9%, more than the 2.5% forecast. The report added that:
The index for final demand less foods, energy, and trade services rose 0.2 percent in October after climbing 0.4 percent in September. For the 12 months ended in October, prices for final demand less foods, energy, and trade services advanced 2.8 percent.
Overall, the US Dollar buyers remain in control, which could result in more losses in EUR/USD in the near term.
Economic Releases to Watch Today
- Italian Industrial Output for Sep 2018 (MoM) – Forecast +0.6%, versus +1.7% previous.
- France ILO Unemployment Rate for Q3 2018 – Forecast 9.0%, versus 9.1% previous.
EURUSD Downside Pressure Builds Up Towards 1.3000 Zone
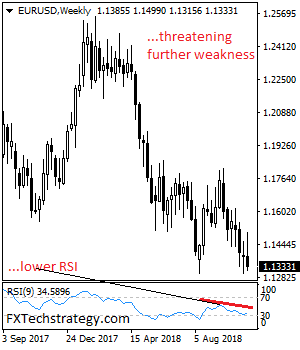
EURUSD downside pressure builds up towards the 1.3000 zone. This is coming on the back of its pasty week price weakness. Support lies at the 1.1300 level where a violation will aim at the 1.1250 level. A break below here will aim at the 1.1200 level. Further down, support lies at the 1.1150. On the upside, resistance resides at 1.1350 level with a break through there opening the door for further upside towards the 1.1400 level. Further up, resistance comes in at the 1.1450 level where a violation will expose the 1.1500 level. All in all, EURUSD continues to face further downside pressure medium term.
GOLD Eyes Additional Price Weakness Towards 1,200.00 Area
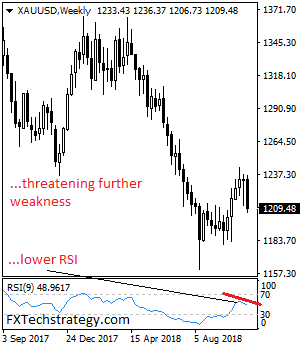
GOLD eyes additional price weakness towards 1,200.00 area in the new week. This is coming on the back of its past week losses. On the downside, support comes in at the 1,200.00 level where a break will turn attention to the 1,190.00 level. Further down, a cut through here will open the door for a move lower towards the 1,180.00 level. Below here if seen could trigger further downside pressure targeting the 1,170.00 level. Its weekly RSI is bearish and pointing lower suggesting further weakness. Conversely, resistance resides at the 1,220.00 level where a break will aim at the 1,230.00 level. A turn above there will expose the 1,240.00 level. Further out, resistance stands at the 1,250.00 level. All in all, GOLD looks to weaken further lower short term.
Daily Markets Broadcast
Wall Street down for a second day. Oil rebounds.
US markets extended the post-FOMC decline on Friday as US producer prices rose more than forecast in October, affirming the Fed’s hawkish stance on rates. At the weekend, OPEC ministers talked about a plan to reduce oil supplies going in to 2019, which has given crude oil a lift in early trading today.
US30USD Daily Chart
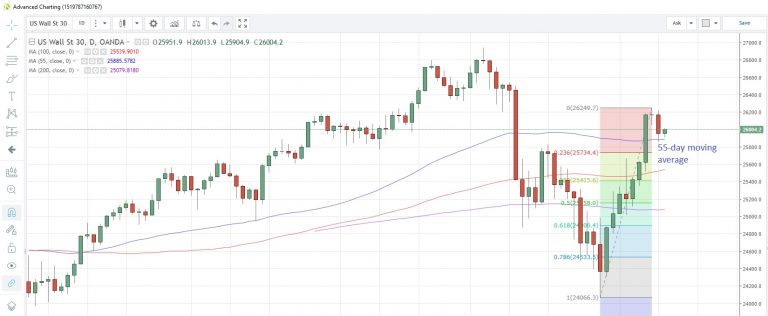
The US30 index fell for a second day Friday, retreating further from four-week highs
The index tested the 55-day moving average at 25,886, but this average held on the day. Markets have opened slightly in the black this morning
It's a US holiday today commemorating Veterans Day, so activity, volumes and liquidity may be less than normal.
DE30EUR Weekly Chart
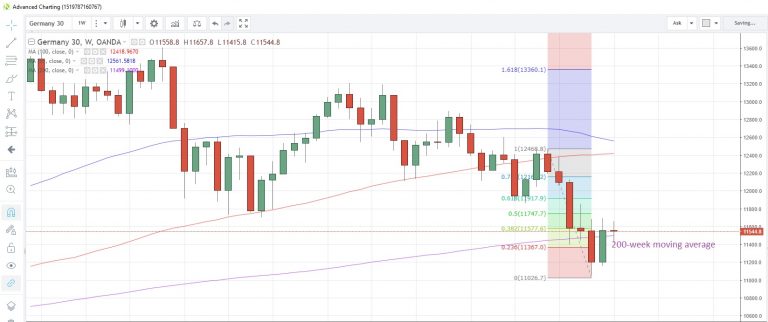
The Germany30 index recouped early losses to close in positive territory Friday. A more positive outlook for Brexit negotiations helped sentiment. Talk that UK PM May could hold Cabinet meeting today or tomorrow to approve Brexit deal after talks with Ministers yesterday
The index is still hovering above the 200-week moving average at 11,499
Italy Deputy PM Di Maio says confident of 2019 budget deficit/GDP ratio of 2.4%, based on growth and spending cuts. EU's Dombrovskis says their budget based on overly optimistic assumptions.
WTICOUSD Daily Chart
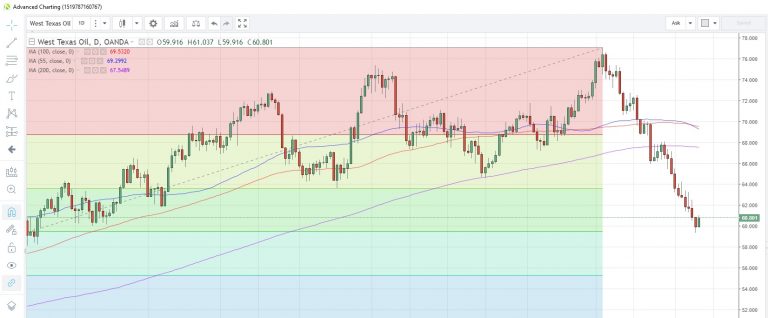
WTI could advance for the first time in eleven days after weekend OPEC developments
On Friday, WTI dropped below the $60 mark for the first time since February 14
The OPEC meeting at the weekend saw members and allies making plans to reduce production in 2019, in an attempt to halt sliding oil prices. Saudi Arabia to cut production by 500,000 barrels per day in December.
Italy Tria to lower growth forecast to meet EU budget demand
Italy was requested by the European Commission to submit a new or revised draft budget plan (DBP) by November 13, tomorrow, after rejection. Ahead of that, it's reported that Economy Minister Giovanni Tria is considering to tweak the plan by lowering 2019 growth forecast.
According to Italian coalition government's own budget, 2019 GDP growth is projected at 1.5%. And, the budget deficit target is 2.4% of GDP. Tria has pledged last week to maintain the "pillars" of the budget. And clearly, the pillars don't necessarily include growth forecast.
La Repubblica reported that Tria could cut the growth estimate to 1.0%. On the other hand, Il Messaggero said he could cut the forecast to 1.2%. According to European Commission's own projections, Italy's growth would be at 1.2% in 2019. Also Tria might also look at automatic mechanism to cut public expenses to keep deficit under the 2.4% cap.
The Oil Market’s Far Reaching Implications
Oil Markets
OPEC meeting in Abu Dhabi
WTI futures are up over 1.2 % and Brent + 1 % this morning. Saudi Arabia has stepped in front of the Oil market bears proactively announcing they will reduce supply by .5 million barrels per day in December. Khalid al-Falih told reporters that “Saudi Aramco's customer crude oil nominations would fall by 500,000 bpd in December versus November due to seasonally lower demand”, but “There is no consensus yet among oil producers about cutting production,”. This announcement comes on the back of the joint statement Friday that that Saudi Arabi and Iraq will work together to stabilise prices
Oil markets are the hottest topic on the street as the recent slide in prices are having far-reaching implications across all asset classes
Over the weekend the Joint Ministerial Monitoring Committee (JMMC) of the OPEC+ met in Abu Dhabi as growing frictions amongst members intensified with Iran calling for an end the JMMC and its offshoot the Joint Technical Committee (JTC). And there are even rumours that King Abdullah Petroleum Studies and Research Center, (a Saudi think tank) is role-playing scenarios if Saudi Arabia exited the producer's group.
And while supply cuts topped the agenda, the JMMC does not set policy but will establish the groundwork for of the full members OPEC meeting in early December.
Oil prices above $80 are never welcome by OPEC customers, and that seems to be a similar consensus among OPEC+ and US producers. However, producers are concerned that the latest selling frenzy could see Brent oil reach $ 60 or below. So, it's in OPEC's best interest to tame the current supply glut, primarily since they intended to the production cut in December. But with the prompt markets overflowing with light and sweet grades, something must give, and OPEC solution seems the most viable outcome. But where oil prices are headed next will depend on the producers, but with Russia not fully supporting a production cut, things could get a little testy approaching the December meeting.
However, producers may get some breathing space from falling prices over the next few weeks as demand from refineries will pick up after returning from their annually scheduled maintenance period. Its anticipated demand could rise by as much as 1.5 million barrels per day by year-end
OPEC Shale Shocker
Baker Hughes reported US energy firms added oil rigs despite oil futures plummeting and US inventories skyrocketing. Drillers added 12 oil rigs in the week to Nov. 9, bringing the total count to 886, the highest level since March 2015. A bit odd when this metric is an indicator of future supply which tells me the industry has few if any worries about demand for oil breaking down any time soon. But one thing that is abundantly clear, OPEC is in for a Shale shocker as US crude production increased to a record 11.6 million barrels per day and will cross the 12 million thresholds next year.
But at $70 Brent are we really in a Bear market? Yes and no.
Technically speaking we are in a bear market as defined as a 20% decline from a market peak
Indeed a record 10-day losing streak has everyone panicking while causing a high-speed reassessment of the state of global oil supplies. Taking into account that OPEC has revised down its short-term global demand outlook for three months in a row, the forecast does look bleak
But in reality, this is a supply glut, but it's unlikely Asia's unquenchable demand for oil is about to dry up anytime soon so prices could base. Plus as we've seen in the past, OPEC and allies have been able to stabilise prices during supply surplus which will undoubtedly happen this time around leaving traders to speculate on the timing for production cuts to occur.
None the less, the consumer will get an early Christmas gift at the pumps as supply glut is expected to extend into year end.
Oil falls 1 Percent, US crude on a longest losing streak since 1984 Reuters ” what a difference a month makes” Michael Tran, commodity strategist at RBC Capital Markets.
Were Iran sanctions expected to be a game changer?
For a short-term, they were going to be until market supply caught up. I recall having this exact conversation a few months ago with local Energy Editor, where we both humorously concluded there would be a massive run-up in prices until a few weeks before Iran sanctions take hold. Only for the reality check to set in when the market realises Saudi Arabia converted the shortfall into a surplus.
Trump waivers affect.
Well, a funny thing happened on the way forum, Saudi Arabia and Russia increased production starting way back in June, while the US unofficial oil minister, “Donald Trump” may have orchestrated probably one of the best sleights of hand tricks in some time. He effectively drove prices lower by offering up far more Iran sanction waivers than expected, catching the producers and traders alike completely wrong-footed while effectively correcting oil prices back to the perceived Brent $ 65-75 sweet spot. Remember these taps can be turned off as quickly as they were turned on.
Never one to miss out on a press op, “We're going to let some of the oil go out to these countries that do need it because I don't want to drive the oil prices up to $100 or $150 a barrel, which could happen very easily,” Trump said during a press conference on Wednesday. Trump argued that prices have “come down very substantially” recently “because of me.”CNN He does have a point, though.
Fact Box: The Knowns and unknowns of US Iran oil sanction waivers: Reuters
G-10 Currency Markets
FOMC is messaging the same signals, gradual increases coming, certainly no Dovishness, this leaves the USD firm and EUR back towards the critical 1.1300 level. Trading the dollar has been a bit of an oddity or sorts the base few weeks, completely ignoring the strong US economic data while focusing on a highly improbable Fed pause. But really with the US economy firing on all cylinders while growing concerns that global growth has peaked, all point to a favourable dollar outcome heding into year end.
The Euro
The USD has traded very well over the past 24-hours, but I don't think this has so much to do with the FOMC as it is about the EURO's ugly duckling persona around Italy risk, after all, there was hardly a change in the FOMC, and a December hike was always the markets base case scenario. With that in mind, the move to 1.1300 was a bit quicker than expected and while there some definite carry appeal into the USD by G-10 standards, the movement does feel a bit overdone.
The Japanese Yen
The dollar was rallying everywhere yesterday but not so much in USDJPY. Suggesting that market positions are a tad long and the equity markets risk overhang is now weighing on trader's sentiment. The dips remain shallow, however, suggesting that a convincing push above 114.50 is still in the tea leaves, but a possible escalation in risk aversion around US-China trade war is keeping new buyers cautious.
The Australian Dollar
Not unexpected the Aussie dollar came under fire from a lacklustre policy statement (SOMP) but with the stronger USD and China factory inflation wobble, G-10 traders were noticeably increasing their Short Aussie China proxy bets on Friday. So the Australian dollar appears headed for a near-term test of the critical .7200 level. Its been a tough grind shorting the AUD lately, but China risk looks poor and RBA a tad delusional which is usually a right combination for an AUDUSD sell-off. But given the steady outperforming data in New Zealand, selling AUDNZD does look quite attractive.
China's far-reaching influence
Flagging growth in China revived global growth concerns. Naturally, pressuring EM Asia and triggering a global equity market sell-off. But the diverging comprehensive global growth narrative should continue to favour broader USD gains. Specifically, it was Friday's China factory gate inflation wobble that is weighing on global equities and commodities alike. With manufacturing activity in China expected to recede further, it should dampen price pressure on commodity markets and will continue to weigh on global growth prospects.
But adding more fuel to the equity sell-off was President Trump's trade adviser Peter Navarro criticised Wall Street executives and accused Chinese President Xi Jinping—without mentioning him by name—of failing to live up to highly publicised trade deals. WSJ
Indeed, the fear of escalating trade war is coming back to haunt investors yet again.
As I've been harping to anyone that was buying into the post-midterms equity markets rally, curb your enthusiasm as we're by no means out of the woods on the US-China trade story. Don't expect a resolution to pop out of thin air given the great trade divide. And with neither party willing to blink, we could be dealing with trade woes throughout 2019 and into 2020.
In recent months, the Chinese authorities have responded to signs of slower growth in parts of the economy and a more challenging outlook by easing financial conditions in some ways. However, the effect of the current round of policy easing has been relatively small as I suspect overt easing could cause unwanted sell-off in the Yuan. As well, easing policies have been very targeted given that China remains committed to deleveraging, well at least during this current cycle to avoid re-leveraging. (borrowing this from the RBA) So by all accounts, for the Aussie bulls counting on more stimulus efforts from the Pboc monetary policies, they may be much less bullish for Australia than past efforts.
Australia Markets
ASX
Benign US political gridlock in my view indicates no softening in US trade war stance, in fact, I think an emboldened President Trump with the backing of House Democrats, who are just as hawkish on that front, should continue to play out negatively for regional and local Australian markets. And if we factor in the expected slow burn on China economic data as the drag from US tariffs takes hold, even more so after China's front-loading capacity diminishes, we should see continued pressure on commodity prices and more sustained pressure on commodity constituents on the ASX.
Asia Markets
The stronger USD effectively tightens financial conditions in Asia suggesting that the longer the dollar remain in favour, the higher the likelihood for growth slowing next year. With US yields on the rise again, bearish sentiment is permeating local bond and equity markets.
Asia Currencies
While the massive drop in oil prices will take some pressure off oil importing deficit countries like IDR and INR, but any hope for a reconciliation of US-China trade tensions is far too premature.
Indonesian Ruphia
The USDIDR caught a significant downdraft last week as oil prices collapsed. While the outlook for Oil remain bearish OPEC discussion will need to be monitored.
The Chinese Yuan
With China's current account surplus evaporating, US-China monetary policy divergence and China terms of trade expected to weaken, USDCNH higher should be the path of least resistance.
The Malaysian Ringgit
The Malaysian Ringgit is expected to struggle on some fronts. Traders are increasingly pricing in greater BNM vs FED policy divergence which makes Friday's Q3 GDP print so incredibly crucial for the Ringgit, even more so with the BNM striking a dovish chord. On the optimistic side of the equation, we could get a reprieve as the 0 GST should have boosted consumption. Tax relief has some forecasters looking of Q3 GDP to rebound from 4.5 % in Q2 to 5.1 % for Q3. However, I think this would only be mildly positive for the Ringgit, but a miss below 5 % would persuade a quicker move to the critical USDMYR 4.20 level.
US markets
The USD will have a plethora of items to anchor itself to this week, and given the strong economic performance in this year's data, we should expect another good week for the dollar.
With the Fed's November meeting in the rear-view mirror, it's time for the markets to come back to reality. We know with a high degree of certainty the Feds will raise interest rates in December for the fourth time in 2018, but that doesn't mean it's time to bring out the snooze pillow. Specifically, Fed Chair Powell's Wednesday discussion with Dallas Fed President Kaplan (non-voter/neutral bias) will be significant as the discussion will likely fill in some blanks from what amounted to a scanty FOMC statement. But for those looking for anything other than Powell to expound that the Fed policy is a “gradual” path of policy normalisation, yes higher US interest rates on a data dependent basis, need to wake up and smell the coffee. For Fed Chair Jay Powell, I suspect ” Red October ” is still a movie and not a big enough concern that should cause the Fed to stop raising interest rates. After all, isn't part of “raising interest rates a prudent move when market valuations become a source of concern” ( Janet Yellen) CNBC
But funnies aside, apparently the FOMC is little concerned with tightening in financial conditions triggered by a stronger USD and lower equity markets. It's not a case of ignoring weakness in equities during October or the rapid tightening of Financial Conditions; these conditions have not shown up in US data as an economic drag. But more important for market participants, Chair Jay Powell has made it abundantly clear the Fed will be entirely data dependent despite some concerns the desire to normalise interest rates blind the Fed.
Wednesday's US CPI release will be the week's main event. The market is expecting a strong inflation print after going through a recent soft patch in consumer prices. ((+0.4% forecast vs. +0.1% previously) and core (+0.3% vs. 0.1%). While a downside miss won't necessarily keep the Fed from hiking in December, a softer inflation profile will keep market expectations very low with regards to returning US rates to Neutral( 3%) and could quash all those discussions about the Fed meandering into restrictive territory
Thursday's retail sales data will also share some of that spotlight but given robust consumer confidence and a healthy jobs market; one can only assume the US consumer will have their purse string loosened. But this print could provide substantial guidance as to what to expect for the rest of Q 4 as we head into the spendthrift holiday season.
For equity markets, keep in mind November 15 will be the last day for hedge fund investors to notify managers to exit their positions before the end of the year (45-day withdrawal turnaround). My best guess is with a considerable tail risk from Trump -Xi November G-20 meeting along with tight funding conditions entering year end which will likely see more pressure on equity markets, we could see more downward persuasion on US equities this week, strictly from a year-end profit-taking perspective. Of course, fund managers who have extremely bullish views heading into the year-end might warehouse positions expecting to sell them back to clients at higher valuations next year. However, ” If history is any guide, the rush for the exits will be swift and accelerate. Clients have already pulled $11.1 billion even before funds fell into the red for the year. Bloomberg
On US interest rates front, still firmly planted in the bear camp and expected UST 10 year yields to test 3.50 %. Even with congressional gridlock, interest continues to point higher given the strong chance of bipartisan agreement on infrastructure investment, this despite the congressional divide reducing the likelihood for additional fiscal stimulus. While there's an outside chance we could see other economic stimulus policy adjustments, the odds remain well below the Mendoza line. But let's not make a meal of it, the prospect for additional tax cuts, given the massive US budget deficit, was creating huge divisions among the Republican party and these policies were no shoo-in. So it's very unclear if Washington gridlock marks a significant shift on that front for 2019.
As for the funding crunch theory, in currency markets, the US$ year-end turn funding pressures has been a factor for the past few weeks which has been pressing long-dated 2-month tenors into expensive territory. (Cash Funding and FX Swaps into early January)
Gold Markets
All that glitters isn't gold. With the Fed on track for a December rate hike and the dollar looks likely to hold a bid into year-end, the odds for Gold to test $1150 over the next few months seem more likely that a test of $ 1250. There is little to no haven appeal, and with the US leading indicators remaining robust suggesting the US services-based economy is firing on all cylinders suggesting the Fed will stay on track. The University of Michigan Survey and PPI came in above expectations, signalling consumer confidence remains strong. All that chatter about a Fed pause in 2019, is far too untimely suggesting that considering the economic growth slowdown around the globe, the USD should remain in good standing from growth differential perspective which could tarnish Gold appeal heading into year-end. Indeed, higher US interest rates and a stronger USD are flashing Red for Gold investors.
An opinion piece on Oil
The fear of missing out (FOMO) is a widespread disease that afflicts even the cagiest of traders. The perfect example was the latest Ramp on oil prices and the subsequent collapse since early October ( -21%) FOMO was getting driven by a theoretical supply y crunch from Venezuela and Iran as the US imposed sanctions were to take effect came. But this all occurred on the backdrop of a rising US dollar and moderating global growth (PMIs). Historically the USD and comprehensive PMI index have a very tight correlation with oil prices, and at the peak of the Oil ramp, the correlation metric suggested Oil prices were 30 % + overvalued (as per Deutsche Bank data). So as more significant than expected US Iranian waivers came into play, which in my view was little more than US intervention in oil markets to reduce price pressure heading into the midterm election, all the while OPEC, Russia and US had been raising production, the market was caught completely wrongfooted. Now, as the market shifts to the slowing global narrative, it could be argued using that same USD/PMI index correlation to oil metric, that the market is still 10 % overvalued (Deutsche Bank). So, what does this mean? It means OPEC will look to cap production and ensure that Brent remains in the happy 65-75-dollar price range. Funny how we closed the week right on top $70 on the prompt Brent contract.
Sterling gaps down as UK PM May cancels emergency cabinet meeting on Brexit
Sterling gaps down the week and stays the weakest one as it's getting more unlikely for a Brexit deal within November. There was originally a planned emergency cabinet meeting today to approve a Brexit deal. But UK Prime Minister Theresa May dropped the plan due to resistance within her own cabinet. And it's unlikely for May to come up with something by Tuesday's regular meeting to secure enough support.
Irish backstop remains the sticky point. But now, it's over the right for UK to unilaterally exit the backstop. EU and Ireland have been explicit that UK cannot do that. On the other hand, it's unacceptable for some Tories that UK would have to be locked into the customs arrangement of the backstop forever.
Additionally, May is facing more rebellion even within the remain camp of the Tories. It's rumored that four more pro-Europe ministers are on the brink of resignation, following ex-transport minister Jo Johnson's departure last week.
Eco Data 11/12/18
[php_everywhere instance="1"]
Forex Forecast and Cryptocurrencies Forecast
First, a review of last week’s events:
EUR/USD. Recall that, when giving the last week's forecast, 60% of experts had expected the euro to grow to the zone 1.1480-1.1525, and turned out to be 100% right: by Wednesday November 7, the pair had risen to the height of 1.1500.
The remaining 40% of analysts had suggested that the pair would still go down and re-test support for 1.1300 against the background of weak economic indicators of the Eurozone and problems with the Italian budget. This script has also been implemented. On Thursday, November 8, the euro began to decline after the report of the European Commission, which lowered its GDP forecast for 2019 from 2.0% to 1.9%. A further fall in the euro and a strengthening of the dollar was facilitated by a press release from the US Federal Reserve, which showed that the US currency was expecting another increase in the interest rate until the end of 2018.
As a result, the dollar has won back 175 points from the euro, groping for a local bottom at the level of 1.1325, followed by a slight rebound, and as a result, the pair froze at 1.1335;
GBP/USD. The situation with the British pound was similar to the euro last week. Supported by graphical analysis and almost 90% of oscillators and trend indicators on H4, 40% of experts had voted for the continuation of the pair’s growth to 1.3100-1.3220, and on November 7, the pair reached the height of 1.3173. This was followed by a reversal, and, as the bears' supporters had proposed, the pair rushed down to reach the support at the level of 1.2955 on Friday, pushed by the US Federal Reserve comments. It met the end of the weekly session in the zone 1.2970;
USD/JPY. The dollar strengthened towards the Japanese currency as well. However, the pair did not manage to overcome the key resistance level of 1.1400, and finally finished the week at 113.80, demonstrating a weekly gain of only 60 points;
Cryptocurrencies. It turns out that the mid-term elections held in the US can be viewed not only as a struggle of Republicans and Democrats, but also as a fight between supporters and opponents of cryptocurrencies. And, judging by the comments, the blockchain supporters won in a number of states. The positive background is complemented by the information that the major American digital companies are actively and successfully creating lobbies to promote their interests in the Senate, Congress and the US government.
As for the negative news one can mention the appeal of the South Korean Bar Association to the government to regulate the crypto-market, as well as accusations from the US Securities Commission (SEC) against the founder of the EtherDelta cryptocurrency exchange Zachary Coburn in illegal activities.
As for the top virtual currencies, as we predicted, most of them reacted calmly to all these pieces of news. Thus, the bitcoin has not only stayed within the specified range of $6,200-6,660, but also narrowed its scope to $6,320-6,610. The altcoins, following the reference cryptocurrency, showed a moderate increase over the week: the Ethereum (ETH/USD) went up 4%, the Litecoin (LTH/USD) 0.5%, the Ripple (XRP/USD) - 8%. The most impressive dynamics was demonstrated by the BCH/USD: the Bitcoin Cash quotes rose from $425 to $570 from the beginning of the month to the evening of November 9, that is, by 34%.
As for the forecast for the coming week, summarizing the opinions of a number of analysts, as well as forecasts made on the basis of a variety of methods of technical and graphical analysis, we can say the following:
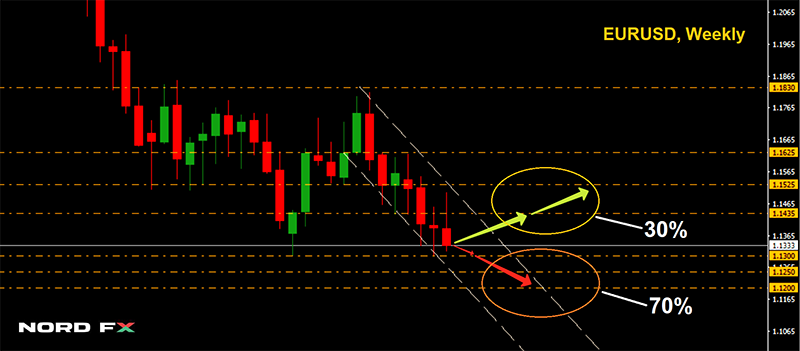
EUR/USD. According to 70% of experts, the Fed's statement will still have some time to influence the strengthening of the dollar. That is why they believe that the pair will not only be able to drop to the year's low of 1.1300, but, in case the economic statistics of the Eurozone are weak and there is positive news from the USA, it will break through this support and reach values in the area of 1.1200-1.1250. Both graphical analysis on H4, and the vast majority of oscillators as well as trend indicators agree with this forecast. However, about 20% of the oscillators on H4 already give signals the pair is oversold, which may be a precursor for a close correction.
30% of analysts also expect a trend reversal up. In their opinion, the dollar is now overvalued, and we can expect the pair to return to the zone 1.1435-1.1525.
This week one should, first of all, pay attention to the data on GDP in the Eurozone and on the inflation in the United States, which will be released on Wednesday, November 14 and Thursday, November 15, and on inflation in the Eurozone on Friday November 16;
GBP/USD. Important macroeconomic data is expected next week from the UK. The data on the labor market will be made public on Tuesday, November 13, and the next day data on consumer price inflation will be published, which, according to forecasts, may increase by 0.1%. And the higher its performance, the more likely it is that the interest rate on the British pound will rise.
However, at the moment the majority of analysts (65%), along with graphical analysis on H4 and 90% of indicators, are pessimistic, predicting the “Briton” a further fall. The nearest target is 1.2850, the next one is 1.2810.
An alternative point of view is represented by 40% of experts and 10% of oscillators, signaling the pair is oversold. The targets for growth are 1.3150, 1.3175 and 1.3235. The nearest resistance is 1.3040;
USD/JPY. The strong dollar has raised the pair to the horizon of 114.00. The expectations of a rise in interest rates by the Bank of Japan are almost close to zero, so 55% of experts, as well as about 60% of indicators on H4 and D1, support bullish sentiment, expecting the pair to continue to grow to resistance levels of 114.55 and 115.40.
At the same time, there is a divergence between the indications of a number of oscillators and the quotes of the pair. In addition, we must bear in mind that the height of 114.55 is the high of 2018, which can be a serious barrier to the further growth of the pair. Therefore, 45% of analysts together with 40% of indicators and graphical analysis on H4, expect that the pair will be able to return to the support of 113.10 in the near future, and then to the level of 111.75. And as for the medium-term forecast, more than 60% of experts already side with the bears;
Cryptocurrencies. Quotes of these pairs are still largely determined by the news. But as mentioned above, cryptocurrencies have already developed a fairly strong immunity against the news. Therefore, we should not expect strong jumps in the bitcoin market value yet.
The actions of a number of regulators, such as the SEC, will deter the growth. The CoinDesk website has reported that the fines imposed on Zachary Coburn are only the first signs, further sanctions against a number of crypto exchanges may follow. The vice-premier of Thailand is also thinking of bringing order to the virtual market, as reported by the Bangkok Post.
On the other hand, no major players are interested in the collapse of the main cryptocurrency, and the lower limit of volatility is still determined by the mining profitability level. When it is reached, the active buying up of coins begins, and the quotes are going up.
Therefore, the forecast remains almost unchanged for the second month: the BTC/USD will continue to move in a narrow range of $6,200-6,660. The next resistance is $6,780, the next support is around $6,100.